Gdoc/Admin

Popular pages

Research and data to make progress against the world’s largest problems.

14,371 charts across 123 topicsAll free: open access and open source

Our Mission

What do we need to know to make the world a better place?

To make progress against the pressing problems the world faces, we need to be informed by the best research and data.

Our World in Data makes this knowledge accessible and understandable, to empower those working to build a better world.

Read about our mission

We are a non-profit — all our work is free to use and open source. Consider supporting us if you find our work valuable.

Donate to support us
As seen on
Logos of the publications that have used our content. From left to right: Science, Nature, PNAS, BBC, Financial Times, The New York Times, The Guardian, The Atlantic, and The Washington Post

Data Insights

Bite-sized insights on how the world is changing, published every few days.

See all Data Insights
A bar chart illustrating the number of people living in poverty in Latin America in 2023. The chart highlights that Brazil, Venezuela, and Mexico account for 59% of the population living on less than $3.65 per day, totaling 52.2 million individuals. Brazil is represented by the longest bar, showing 23.5 million people, followed by Venezuela with 15.5 million and Mexico with 13.2 million. Other countries displayed include Colombia (10.2 million), Guatemala (5.8 million), Peru (4.3 million), and several others, with the smallest bars indicating very few affected, such as Uruguay (0.1 million) and Costa Rica (0.3 million). The chart provides a clear visual representation of poverty levels across the region.

Data source: Chang, Evans and Rivas Herrera (2024), Inter-American Development Bank. Note: Data in international dollars at 2017 prices, adjusted for inflation and differences in living costs between countries. The graph is licensed under CC BY.

Brazil, Venezuela, and Mexico account for 59% of people living in poverty in Latin America

A recent report by the Inter-American Development Bank (IDB) highlights the high concentration of poverty in Latin America. Across the region, around 89 million people — more than one in seven — live on less than $3.65 a day.

Poverty can be measured using various poverty lines; here, we’re looking at the $3.65 line, which the World Bank uses to define poverty in lower-middle-income countries.

The chart shows that 52.2 million people living under this line are in just three countries — Brazil, Venezuela, and Mexico — representing 59% of the region’s total.

As the report explains, while Brazil and Mexico don’t have the highest poverty rates, their large populations mean they have the largest number of people living below this line. Venezuela, in contrast, has a smaller population but one of the region’s highest poverty rates.

Identifying where poverty is most concentrated can help target efforts to reduce and eliminate it.

You can explore more data on poverty, including different poverty lines and world regions, in our Poverty Data Explorer

Continue reading
A chart titled "There is no universal trend in housing prices in European countries" presents price changes of residential properties purchased by households in the 12 most populous European Union countries. It displays a grid layout. 

In the top row from left to right: 
- **Portugal** shows a steep increase of +50% from 2010 to 2023.
- **Czechia** indicates a +44% rise.
- **Sweden** reflects a +36% increase.

In the second row:
- **Germany** has a +33% change.
- **Netherlands** exhibits a +17% increase.
- **Poland** shows a +11% rise.

In the third row: 
- **Belgium** and **France** both have a modest increase of +6%.
- **Greece** shows a decrease of -9%.

In the fourth row: 
- **Spain** indicates a decline of -13%.
- **Romania** has a notable decrease of -27%.
- **Italy** shows a -28% drop.

The chart indicates that data has been adjusted for inflation and cites Eurostat as the data source for 2025. A note at the bottom reminds viewers about the inflation adjustment.

Recent surges in house prices have affected many — but not all — countries in the European Union

One of the most pressing problems I hear from European friends is that they cannot find an affordable place to live. Housing costs represent one of the largest expenses for most Europeans. While many people rent, purchasing a home remains a goal for some.

The chart shows the change in house prices of residential properties purchased by households in 12 countries across the European Union since 2010. In many, prices have increased sharply (even after inflation). Portugal shows the most dramatic increase, with prices rising by 50%.

But this large increase has not happened everywhere. Rises have been more modest in France and Belgium, and prices have actually fallen considerably in Romania and Italy.

These huge differences matter to young Europeans hoping to find their first home after leaving their family house.

Continue reading
A bar graph illustrating the share of global area burned by wildfires across different regions from 2012 to 2024. The graph is divided vertically into segments representing five regions: Africa, Europe, Asia, Oceania, and North and South America. The deep red color represents Africa, which dominates the graph, showing more than half of the total area burned. Other regions, represented by lighter colors, fill the remaining sections of the graph. The year labels are placed along the horizontal axis, indicating the timeline of the data. The title emphasizes that more than half of the area burned by wildfire is in Africa. The data source is the Global Wildfire Information System, with the year of the data being noted as 2025. The graph is under a Creative Commons BY license.

Every year, more than half of the global area burned by wildfire is in Africa

It’s often difficult to understand the scale of wildfires globally. That’s because most news coverage focuses on only a few countries.

News headlines might be filled with stories about large fires in Greece, Portugal, the United States, or Canada, but when we look at the data, the global total is no higher than usual.

This is because the global trend is so strongly dictated by the extent of fires in Africa, which we almost never hear about. As you can see in the chart, Africa experiences more than half of the burned area globally every year. In some years, it’s as much as two-thirds of the total.

Whether it’s a “high” or “low” year for wildfires globally largely reflects whether it’s a high or low year for Africa. These global trends don’t tell us much about the extent of wildfires in other regions.

Track global, regional, and country-level data on wildfires, which we update weekly →

Continue reading
This image presents a series of bar graphs showing the changes in air travel CO2 emissions for Greece, Egypt, Turkey, and Portugal from 2019 to 2024. Each graph displays annual emissions in millions of tonnes.

The top left graph for Greece shows a dip in emissions during 2020 followed by a rise, ending with emissions projected to be higher than in 2019 by 2024. The label "2019 CO2 emissions" is highlighted in red.

The top right graph for Egypt also illustrates a significant rise, increasing from 2.9 million tonnes in 2019 to 4.3 million tonnes by 2024.

The bottom left graph for Turkey demonstrates a continuous upward trend in emissions from 2019 to 2024, starting near 0 and reaching up to 15 million tonnes.

The bottom right graph for Portugal shows fluctuations, with emissions dropping below 2019 levels in 2021, but returning above it by 2024.

The data source for this information is OECD, with a note explaining that the figures include emissions from both domestic and international aviation and that international aviation emissions are assigned to the country of departure. The data pertains specifically to CO2 emissions from commercial passenger flights only.

In several countries, air travel emissions now surpass pre-pandemic levels

Global air travel collapsed in 2020 as lockdowns and travel restrictions took effect. With fewer flights, CO₂ emissions from commercial aviation fell sharply. The chart shows Egypt as an example, where they dropped by more than half.

As air travel rebounded, emissions rose too — in many countries, they’ve now surpassed pre-pandemic levels. These countries are highlighted in red on the chart.

Emissions from flying make up about 2.5% of global CO₂ emissions, but air travel has one of the highest carbon footprints per passenger. As demand grows, reducing its impact will be important for meeting climate goals.

Read my colleague Hannah Ritchie’s article to learn more about aviation’s contribution to global CO₂ emissions →

Continue reading
A scatter plot showing the dates of peak cherry tree (Prunus jamasakura) blossoms in Kyoto, Japan, with the range of dates on the y-axis showing from March 11 to April 30. 

The vertical axis is labeled with dates in late March to late April, while the horizontal axis ranges from the years 812 to 2025. 

Pink dots represent individual blossom dates, with a darker red line marking the 20-year average blooming date, which trends earlier over time. 

The note at the bottom clarifies that the average calculation requires at least five years of data within the 20-year interval and mentions that dates may vary by one day during leap years. 

The data source is Yasuyuki Aono, from published work in 2021 and personal communications in 2025.

Japan’s cherry trees have been blossoming earlier due to warmer spring temperatures

The peak flowering of cherry trees in Kyoto, Japan, has been recorded since the ninth century. Yasuyuki Aono and colleagues from the Osaka Prefecture University collated this data from historical diaries and chronicles, indicating the dates on which cherry blossom viewing parties had been held or other observations of peak blossom.

In 2025, the peak cherry blossom happened on April 4th.

This long-run data is a proxy measure for how the climate has changed. The onset of cherry blossoms is linked with warmer temperatures. Since the early 20th century, the combined effects of urbanization and higher temperatures due to climate change have gradually moved the peak blossom earlier in the year.

Explore this data in our interactive visualization

Continue reading
A line graph titled "Every world region and ocean has warmed — the Arctic Ocean and Europe much more than others" displays the temperature differences between each decade's average surface temperature and a baseline average from 1991 to 2020, measured in degrees Celsius. The vertical axis has temperature values ranging from -2°C to 1°C. The horizontal axis lists decades from the 1940s to the 2010s.

The lines represent various regions and oceans, with the Arctic Ocean and Europe showing significant warming trends. The Arctic Ocean's line rises sharply, indicating an increase of 2.8°C in the 2010s compared to the 1940s. Europe's line also trends upward, showing a smaller but notable increase. Other regions and oceans are represented by less pronounced lines, which fluctuate around the average line.

In the footer, the data source is noted as "Contains modified Copernicus Climate Change Service information (2025) CC BY."

The Arctic is the world’s region that has warmed the most, followed by Europe

The world is heating up. By the 2010s, the global average temperature of the air above the surface was about 1°C higher than in the 1940s. But some regions are warming much faster.

The chart shows how average surface air temperatures have changed each decade across continents and oceans compared to historical averages.

The Arctic warmed more than any other region — by the 2010s, it was 2.8°C hotter than in the 1940s.

In the Arctic, melting sea ice has amplified this temperature increase: ice reflects sunlight, so having less of it leads to more warming.

Europe was in second. Since land heats up faster than water, its mostly land-based geography has increased its rate of warming. It has also seen a rapid reduction in aerosols from air pollution. These improvements in air quality can inadvertently increase temperatures because there are fewer aerosols to reflect sunlight.

You can explore how temperatures in each continent, ocean, and country have changed over time →

Continue reading
A bar graph titled "More than 95% of foreign aid comes from governments, rather than private donors" illustrates the distribution of foreign aid in 2023. The left portion shows a large maroon bar labeled "Foreign aid from governments," reaching $232 billion. The right section features a smaller tan bar labeled "Foreign aid from private donors," indicating $11 billion. A note beside the tan bar states that 4.5% of foreign aid came from private philanthropic donors. The footnote specifies that "Private donors" refers to philanthropic foundations reporting to OECD and excludes many individual charity donations or private investments. The data source is attributed to OECD (2024) and indicates that the information is shared under a Creative Commons BY license.

Most of the world’s foreign aid comes from governments, not philanthropic foundations

Foreign aid provides millions worldwide with life-saving treatments, emergency food supplies, and humanitarian assistance.

But where does most of this money come from: the governments of rich countries, or wealthy individuals?

95% of foreign aid comes from governments. Less than 5% comes from private philanthropic donors. This data focuses on larger private donations in the form of grants; it does not include the smaller, individual charity donations you or I might make.

This means that those of us living in wealthy democracies — which is many of our readers — play a key role in determining the size of the global foreign aid budget. If we want more aid to reach the world’s poorest, we hold some power through the governments we elect and the priorities we demand of them.

Most of our governments — including my own in the United Kingdom — do not meet the UN’s target of giving 0.7% of their gross national income in aid. In fact, the UK has recently announced plans to cut its aid budget significantly.

Explore global data on who gives and receives foreign aid

Continue reading

Get Data Insights delivered to your inbox

Receive an email from us when we publish a Data Insight (every few days).

By subscribing you are agreeing to the terms of our privacy policy.

Explore our data

Featured data from our collection of 14,371 interactive charts.

See all our data

What share of children die before their fifth birthday?

What could be more tragic than the death of a young child? Child mortality, the death of children under the age of five, is still extremely common in our world today.

The historical data makes clear that it doesn’t have to be this way: it is possible for societies to protect their children and reduce child mortality to very low rates. For child mortality to reach low levels, many things have to go right at the same time: good healthcare, good nutrition, clean water and sanitation, maternal health, and high living standards. We can, therefore, think of child mortality as a proxy indicator of a country’s living conditions.

The chart shows our long-run data on child mortality, which allows you to see how child mortality has changed in countries around the world.

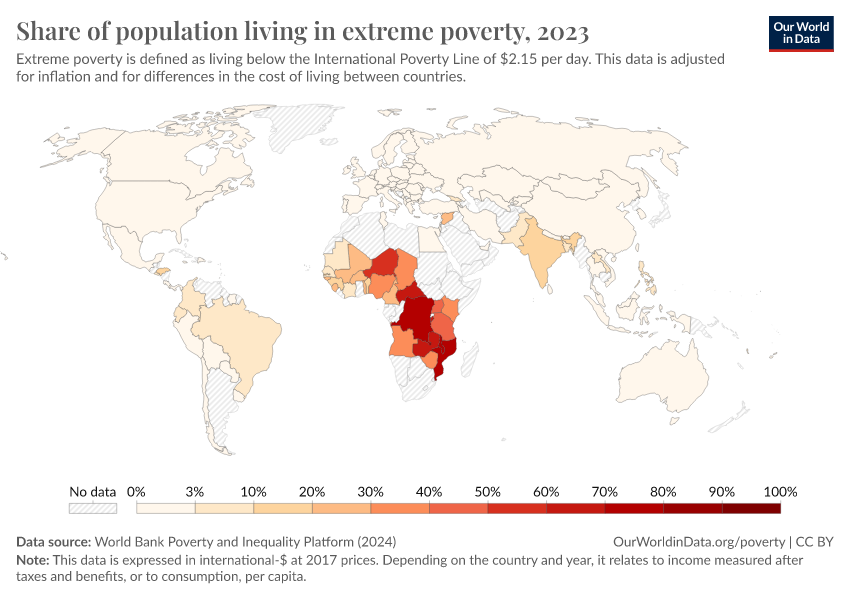
Explore and learn more about this data

Share of population living in extreme povertyWorld Bank

Life expectancy at birthLong-run estimates collated from multiple sources by Our World in Data

Per capita CO₂ emissionsLong-run estimates from the Global Carbon Budget

GDP per capitaLong-run estimates from the Maddison Project Database

Share of people that are undernourishedFAO

Literacy rateLong-run estimates collated from multiple sources by Our World in Data

Share of the population with access to electricityWorld Bank

Data explorers

See all our Data Explorers

Interactive visualization tools to explore a wide range of related indicators.

Subscribe to our newsletters

Receive our latest work by email.
By subscribing you are agreeing to the terms of our privacy policy.

All our topics

All our data, research, and writing — topic by topic.

Population and Demographic Change

Health

Energy and Environment

Food and Agriculture

Poverty and Economic Development

Education and Knowledge

Innovation and Technological Change

Living Conditions, Community and Wellbeing

Human Rights and Democracy

Violence and War