Gdoc/Admin

State Capacity

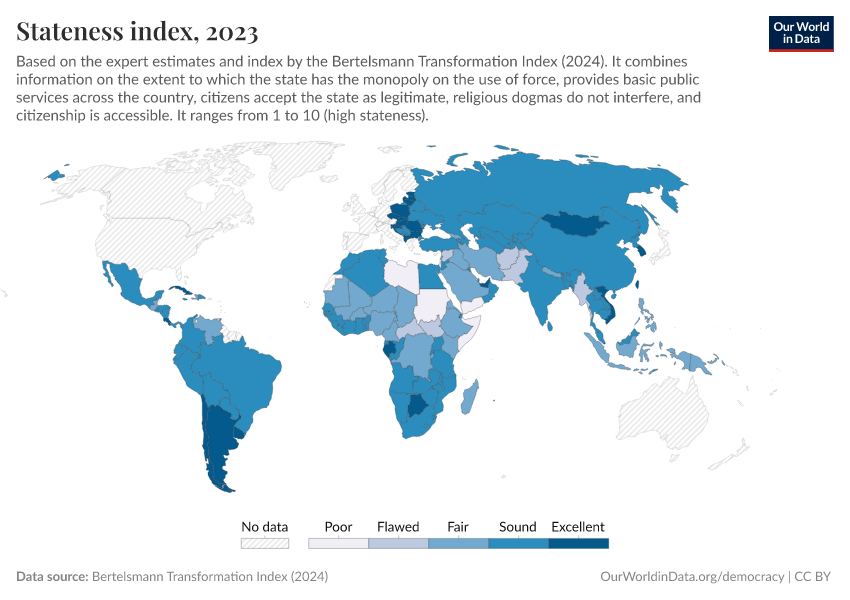
State capacity is the ability of governments to effectively implement their policies and achieve their goals.

The goals of governments vary a lot, and some governments are much more ambitious than others. However, they typically include protecting their citizens against internal and external threats and encouraging economic activity.

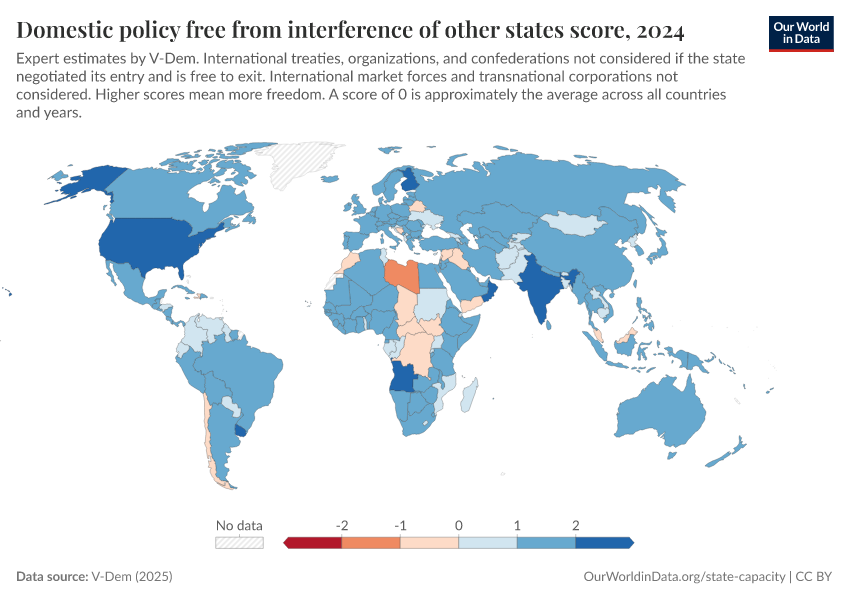
The policies they pursue to achieve these goals range from keeping other governments from interfering in their actions, disarming other violent actors within their territory, upholding the rule of law, and providing infrastructure and other public goods.

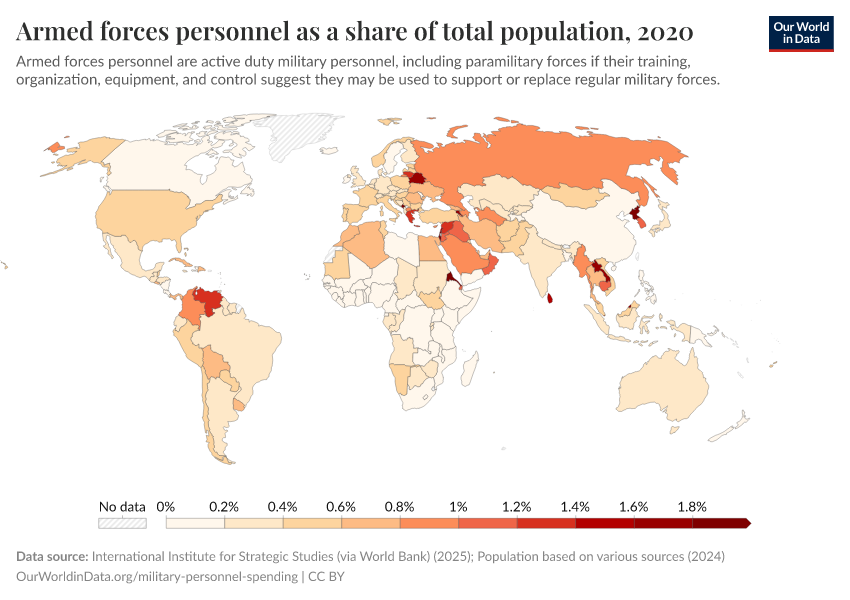
To do that, states must sustainably raise sufficient resources, usually by collecting taxes; hire skilled and impartial security forces and public servants; and gather accurate information about their populations, among other things.

Understanding state capacity is crucial because it shapes a country's ability to address its many challenges. On this page, you can find related data and visualizations on how state capacity differs around the globe and how this has been changing over time.

Key Insights on State Capacity

Countries differ a lot in how much taxes they collect

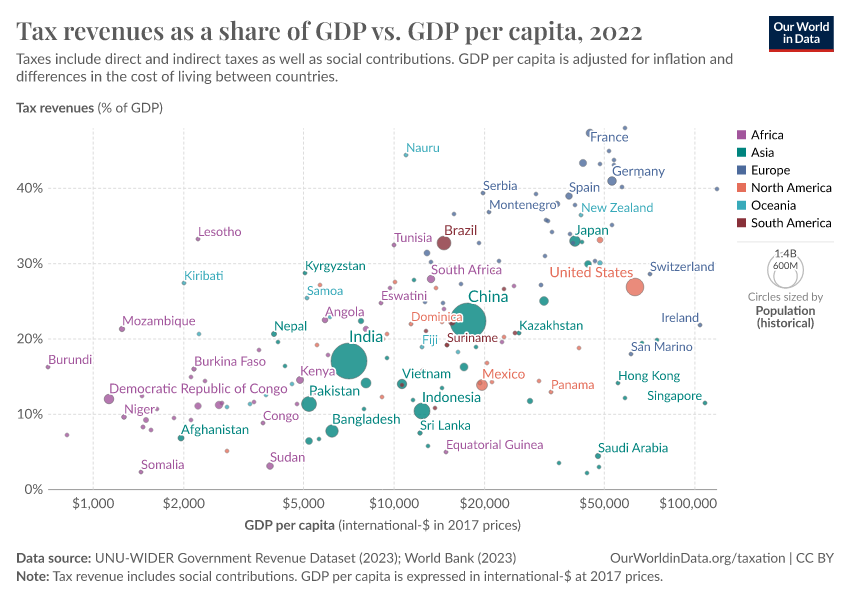
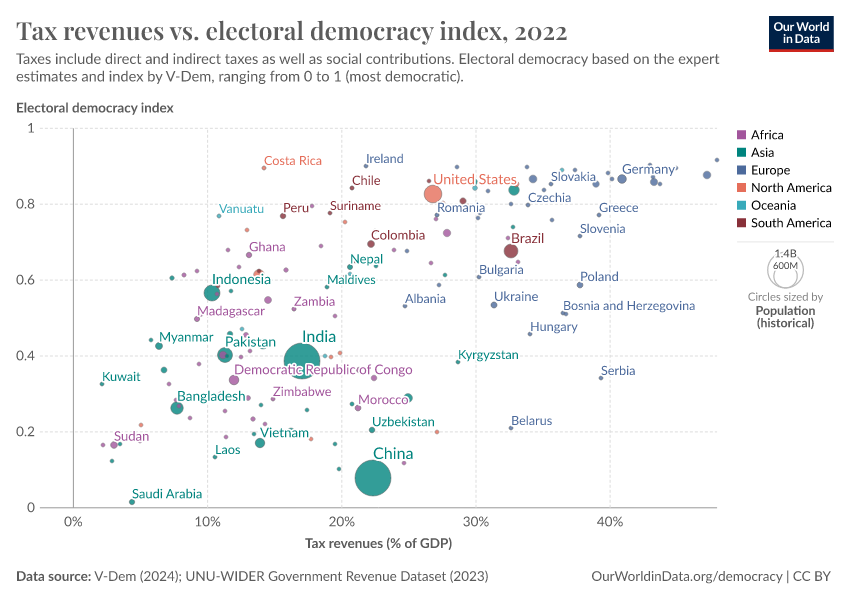
Governments must sustainably raise sufficient resources to pay for their employees and policies, such as providing infrastructure and public services. They usually do so by collecting taxes.

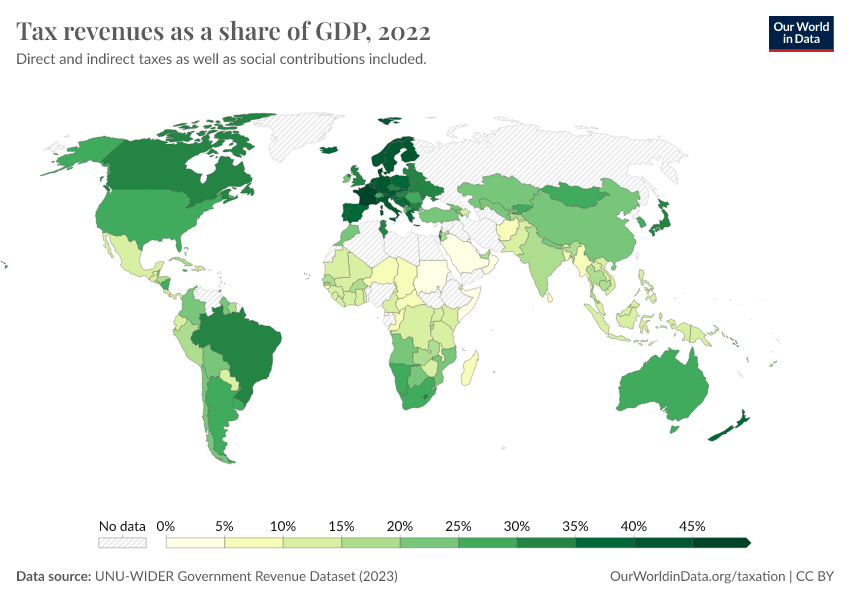
The map, drawing on data from the UN, shows that countries differ greatly in how much taxes they collect. Here, this is expressed as government tax revenues as a share of gross domestic product (GDP).

In many European countries, tax revenues sum up to over a third of GDP. In France and Denmark, it is about half.

In most other countries in the world, it is much less. In a few, taxes make up only a few percent of GDP.

Importantly, differences in tax revenues only partially reflect different abilities to collect them. Some of these differences are also due to policy choices and political preferences for higher or lower taxation.

But because other types of revenues, such as natural resources and foreign aid, can be volatile, collecting taxes remains at the heart of countries’ ability to finance their actions.

What you should know about this data
  • We rely on data from UNU-WIDER’s Government Revenue Dataset1 to measure tax revenues.
  • We remove the data points flagged by UNU-WIDER as lacking accuracy, quality, or comparability.

Most countries effectively control their territory, but some do not

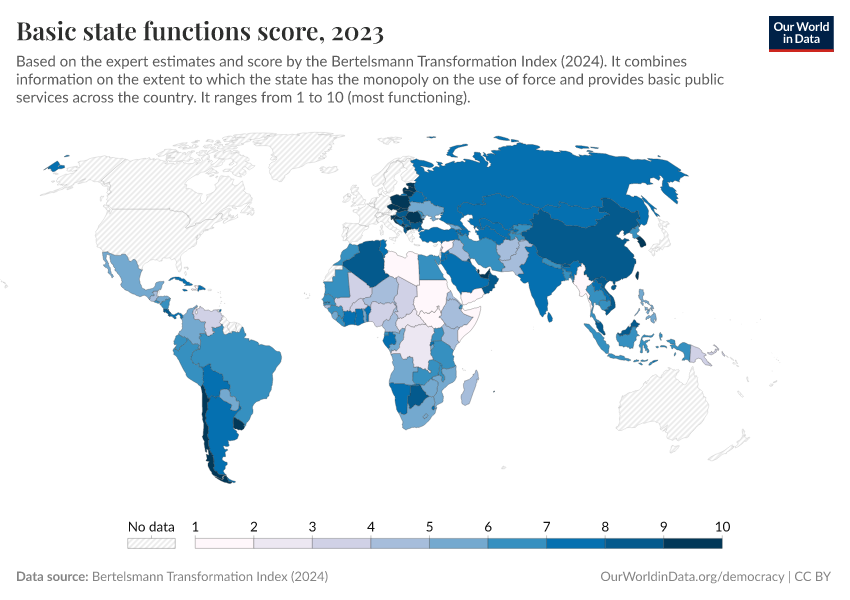
To protect their citizens against internal and external threats, uphold the rule of law, and provide infrastructure and other public goods, governments need to control their territory.

This map shows how governments are doing in that regard, using data coded by country experts from the Varieties of Democracy (V-Dem) project.

We see that most countries control all or almost all of their territory. In them, the government is recognized as the main authority practically everywhere and can assert its power — sometimes by force — over actors that reject its authority.

However, some countries do not control large parts of their territory. They are concentrated in West and East Africa and Central and South America. In parts of these countries, insurgent groups, criminal organizations, or other countries are the main authority. In these areas, national governments often struggle to implement their policies effectively.

Yet, this used to be similar in many countries that control their territory today. This shows that governments can increase the control of their territory.

What you should know about this data
  • We rely on data from the Varieties of Democracy (V-Dem) project2 to measure governments’ effective territorial control.
  • V-Dem’s experts consider the extent to which the government is recognized as the main authority and can assert its power over other actors if necessary. Such actors include insurgent groups, criminal organizations, and other countries. They also consider that some countries may be so weak their reach cannot cover remote areas.
  • V-Dem combines the experts’ ratings with supplementary information (the experts’ ratings of hypothetical countries, their stated uncertainties, and personal demographics) to produce best, upper-, and lower-bound estimates of the indicator.
  • We describe the V-Dem data, and how we expand the years and countries covered, in our article on its electoral democracy index.

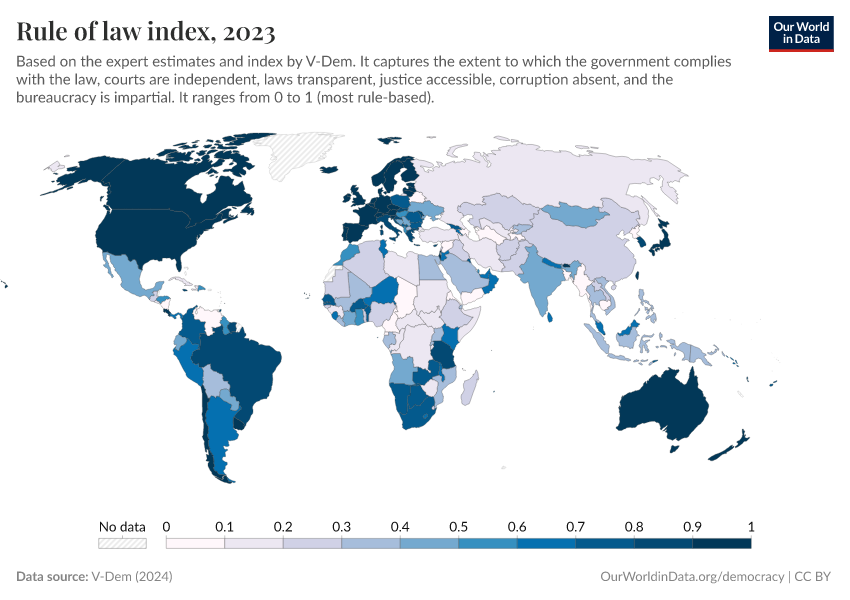
Bureaucracies are more rigorous and impartial in some countries than others

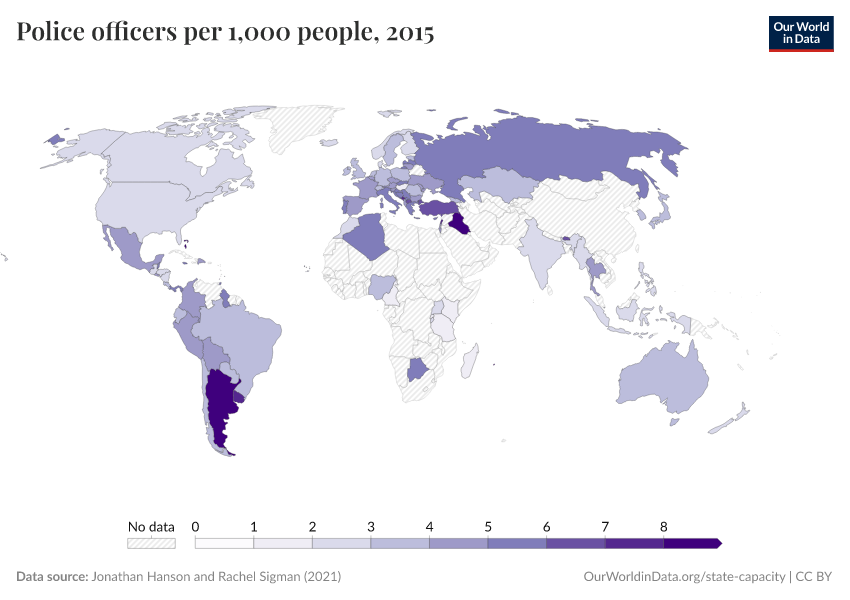
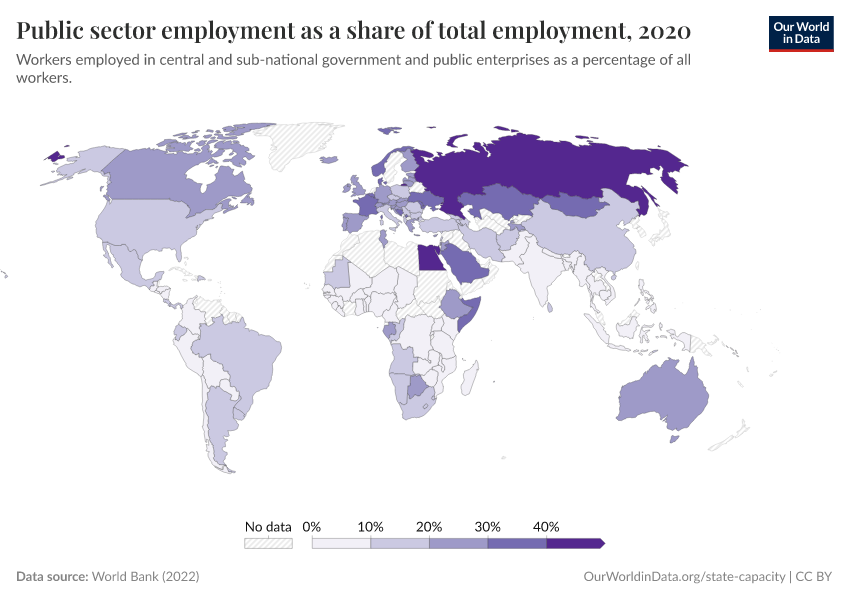
Governments need to hire skilled and impartial public servants to enforce and implement their policies effectively. These public officials include soldiers, police officers, administrators, health workers, and educators.

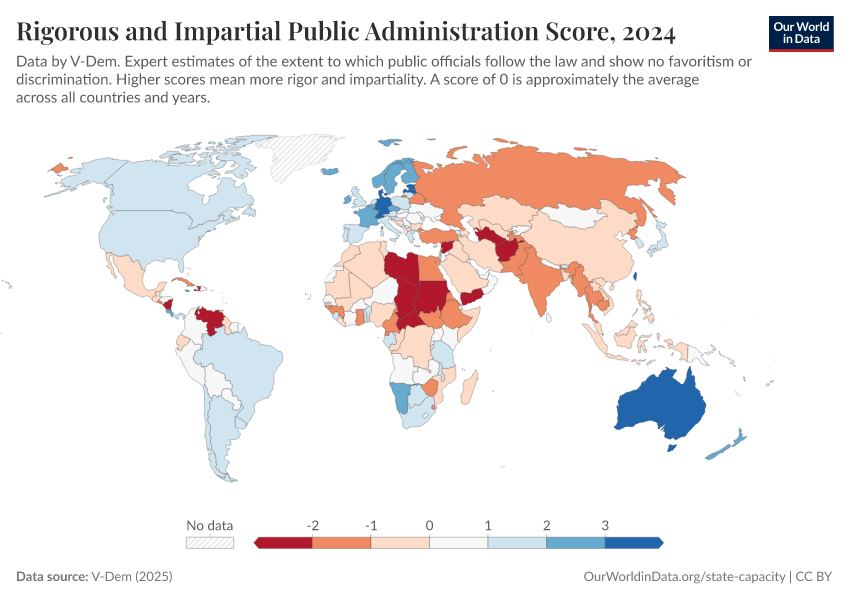
This map shows data on the rigor and impartiality of bureaucracies in each country, using data coded by country experts from the Varieties of Democracy (V-Dem) project.

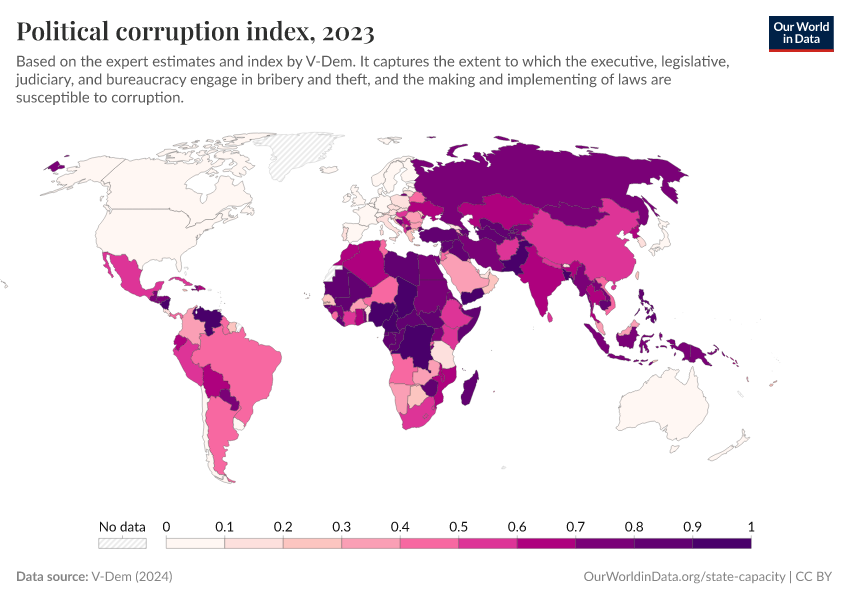
We see that the bureaucracies of some countries are assessed as highly rigorous and impartial. These tend to be concentrated in Europe and the Americas but can be found worldwide. In them, public officials tend to refrain from corruption and enforce the rule of law.

In other countries, concentrated in Africa and Asia, public administration is more arbitrary. In them, nepotism, corruption, and discrimination are more common, according to V-Dem’s experts.

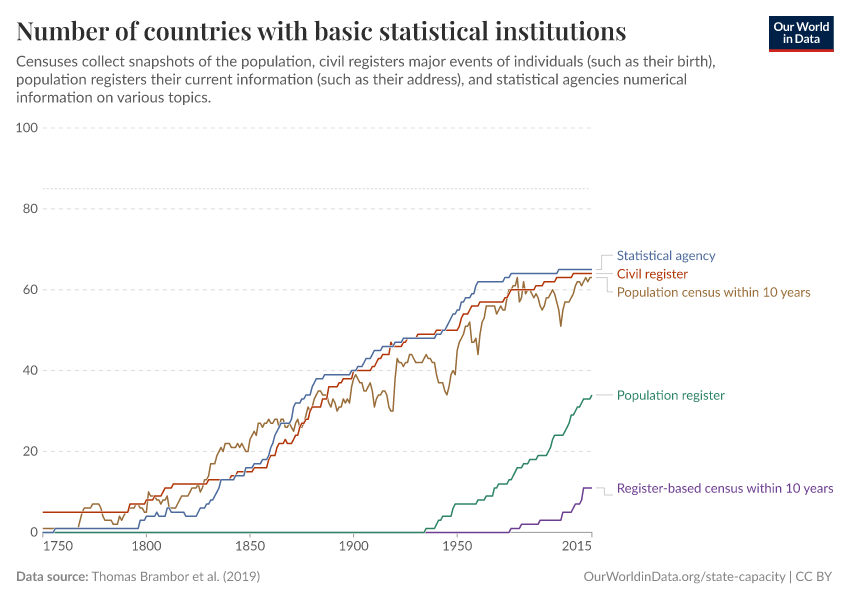
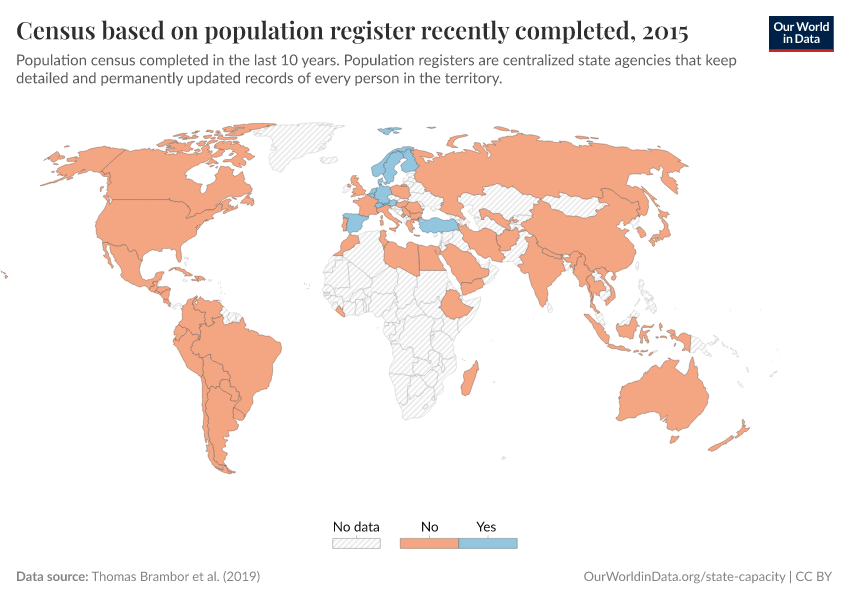
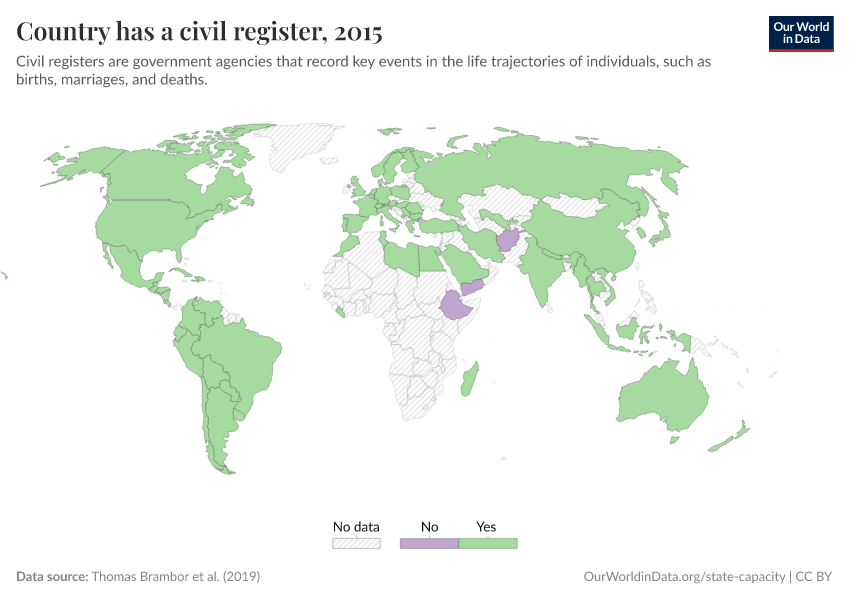
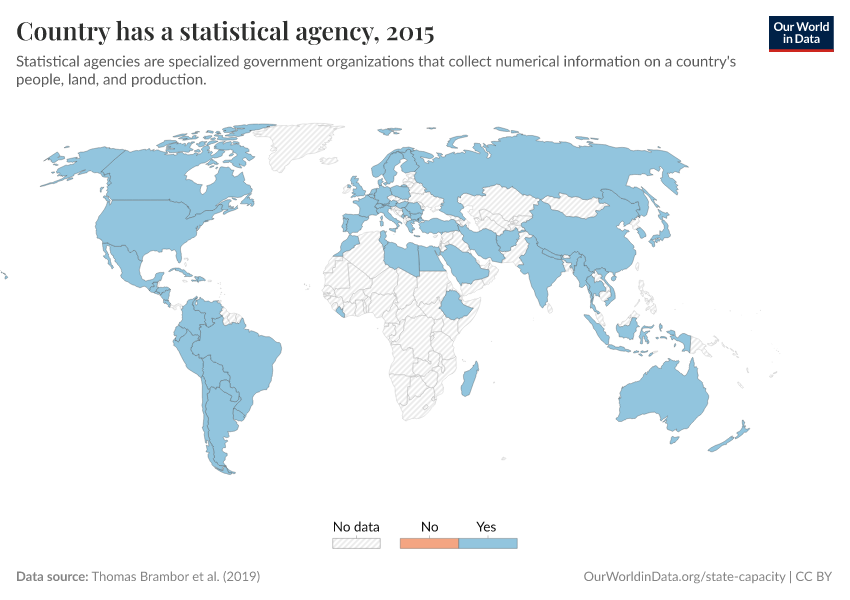
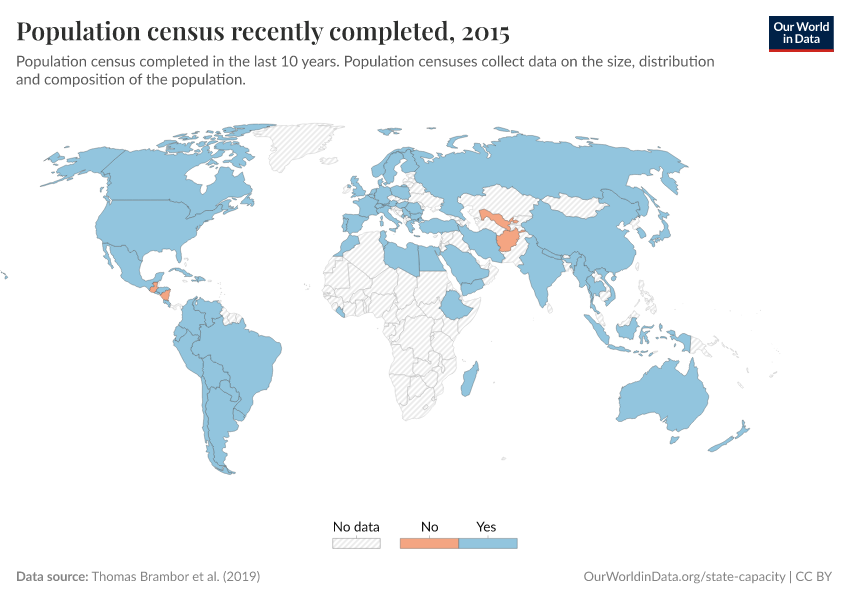
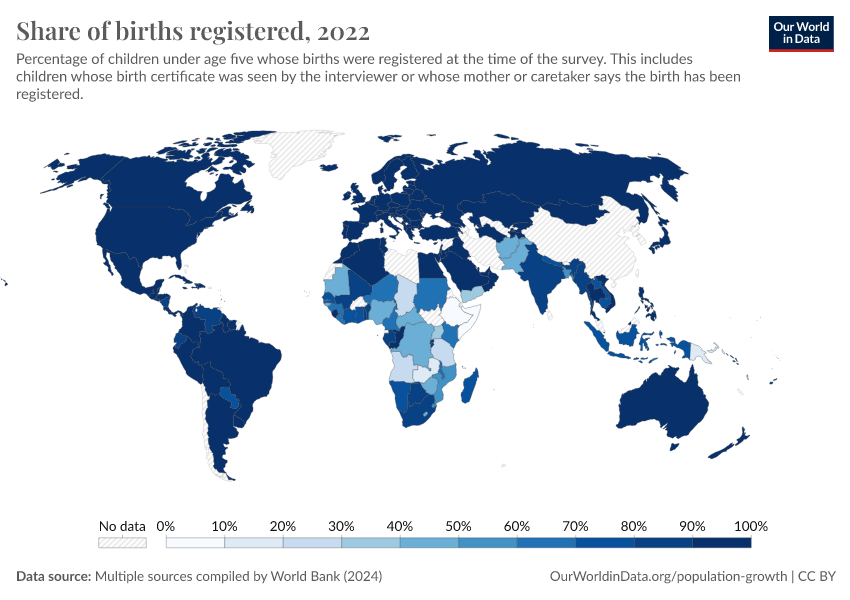
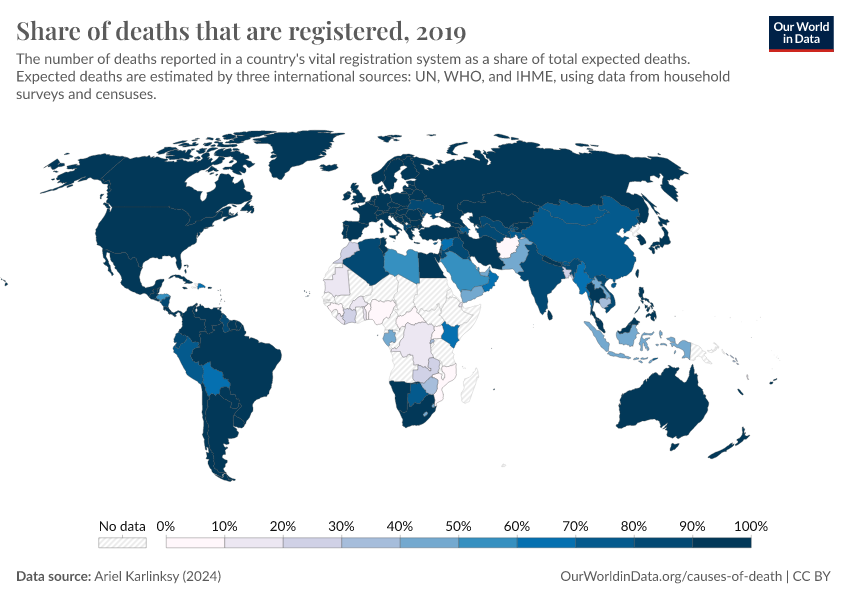
While the quality of bureaucracies matters, their effectiveness also depends on how many people work for them, and what they do. One core task is to collect basic information about a country’s population, such as who was born and who has died, through civil and population registries, population censuses, and statistical agencies.

What you should know about this data
  • We rely on data from the Varieties of Democracy (V-Dem) project2 to measure the rigor and impartiality of public administrations.
  • Higher values indicate a more rigorous and impartial public administration. Specific values, including zero, do not have an intuitive meaning.
  • We describe the V-Dem data, and how we expand the years and countries covered, in our article on its electoral democracy index.

Many states have increased their capacities in recent decades

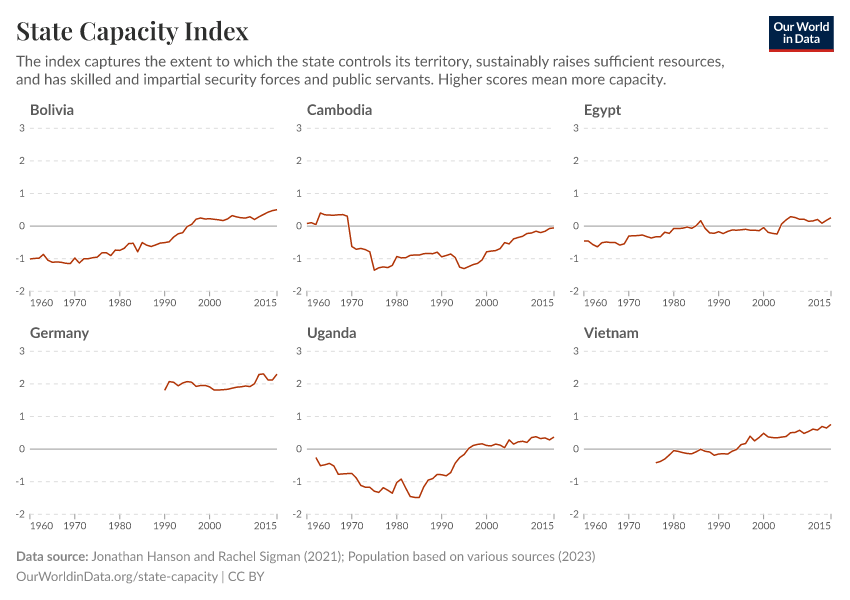
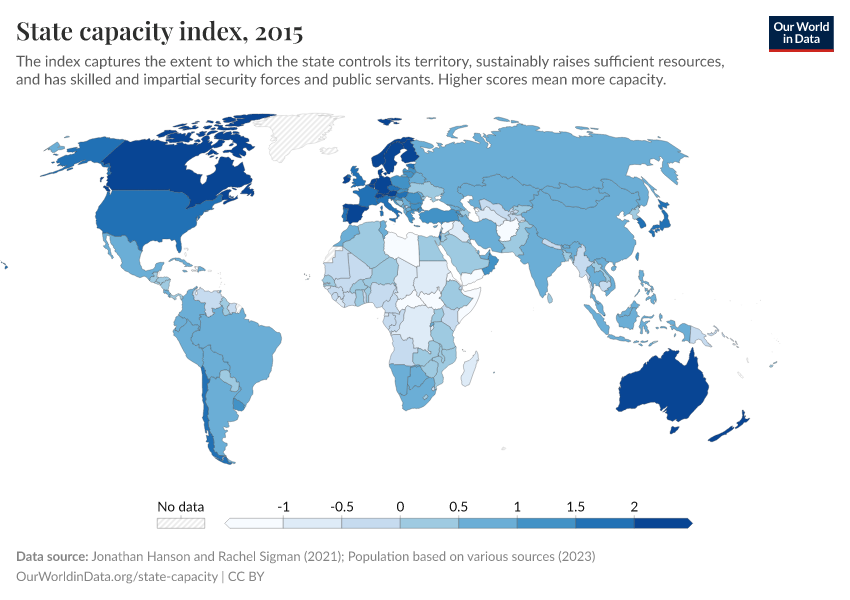
The chart illustrates this by showing the State Capacity Index by researchers Jonathan Hanson and Rachel Sigman. The index aggregates 21 indicators, such as how much countries can control their territory, raise sustainable resources, and hire skilled and impartial security forces and public servants.

A large majority of countries across the world have improved their score over the last decades. This particularly happened in countries with previously lower levels of state capacity, such as Uganda and Vietnam. But it has even happened in those with already high capacity, such as Germany.

We can see this trend towards greater state capacities across all major world regions and income groups and in more specific metrics, such as territorial control, public administration and statistical institutions.

Still, some countries have deviated from the global trend, and their capacities have decreased. This has happened especially in those affected by conflict.

What you should know about this data
  • We here rely on Jonathan Hanson and Rachel Sigman’s State Capacity Index3 to measure state capacity.
  • The State Capacity Index combines 21 different indicators of coercive, extractive, and administrative capacity.
  • Higher values indicate more capacity. Specific values, including zero, do not have an intuitive meaning.

For centuries, many territories and people were ruled from elsewhere

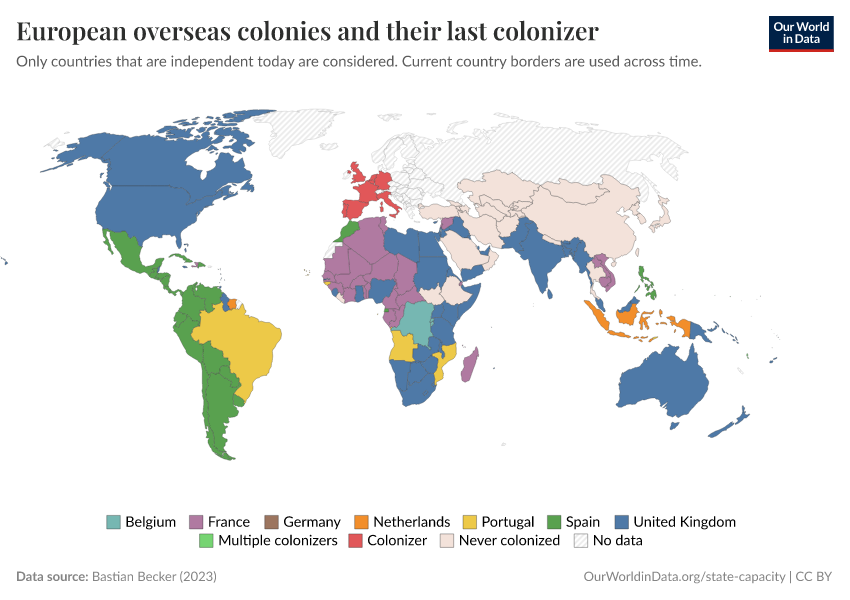
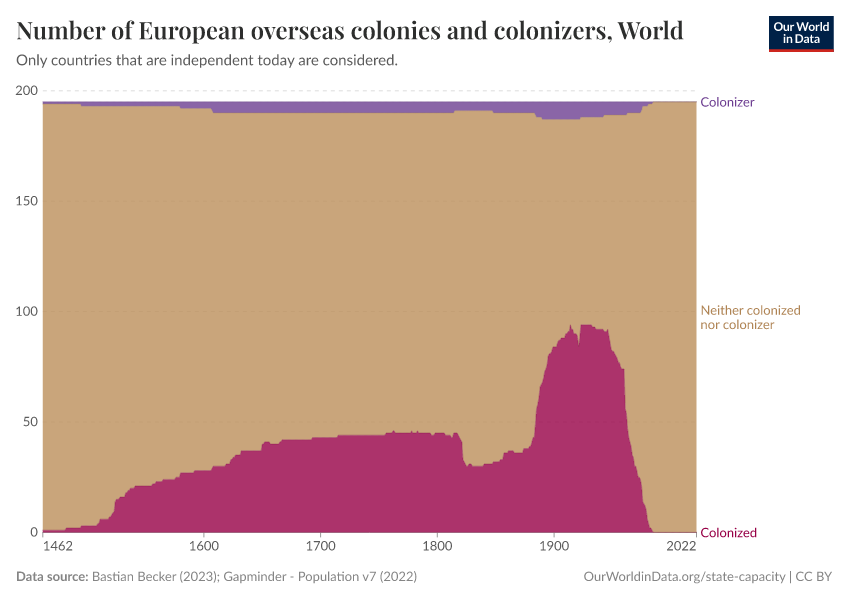
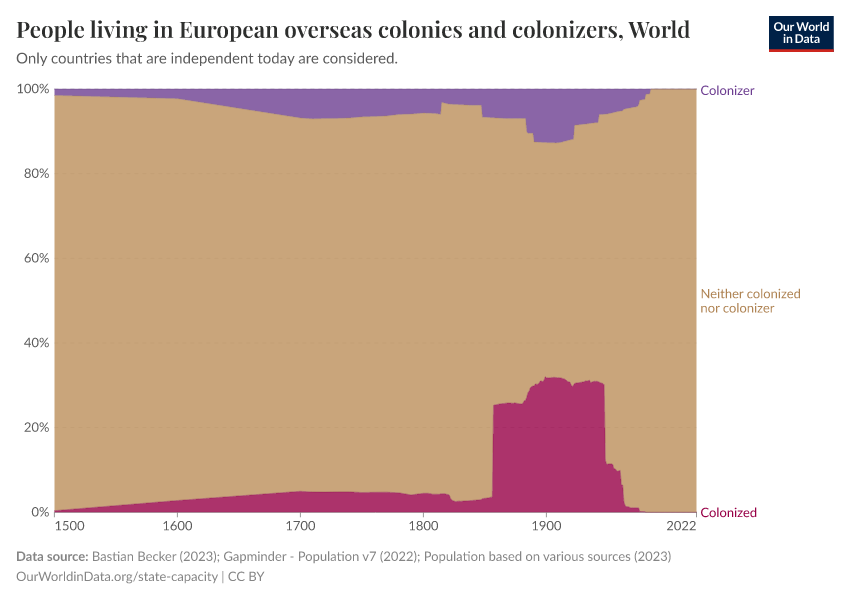
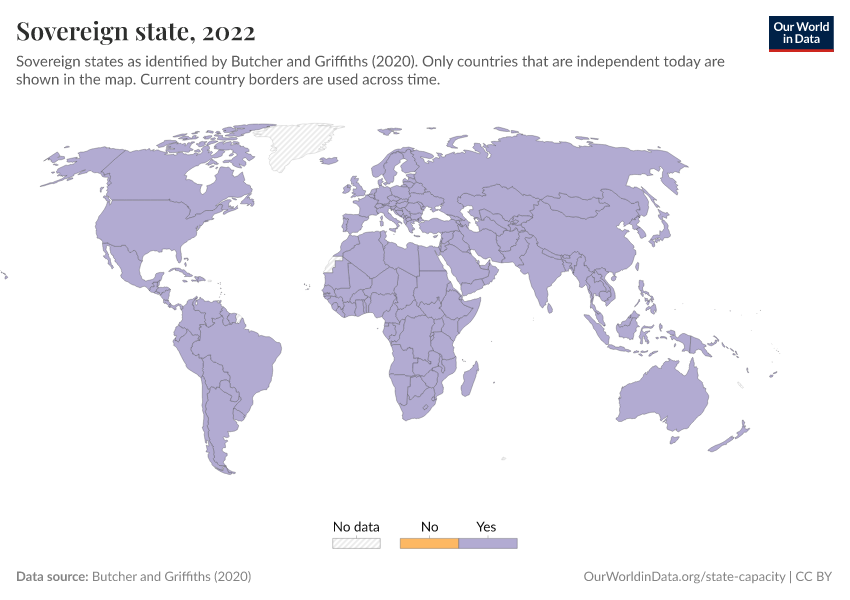
State capacity presumes the existence of a state. But for centuries, large parts of the world were not able to govern themselves. Instead, they were ruled as colonies by distant colonial powers in Europe.

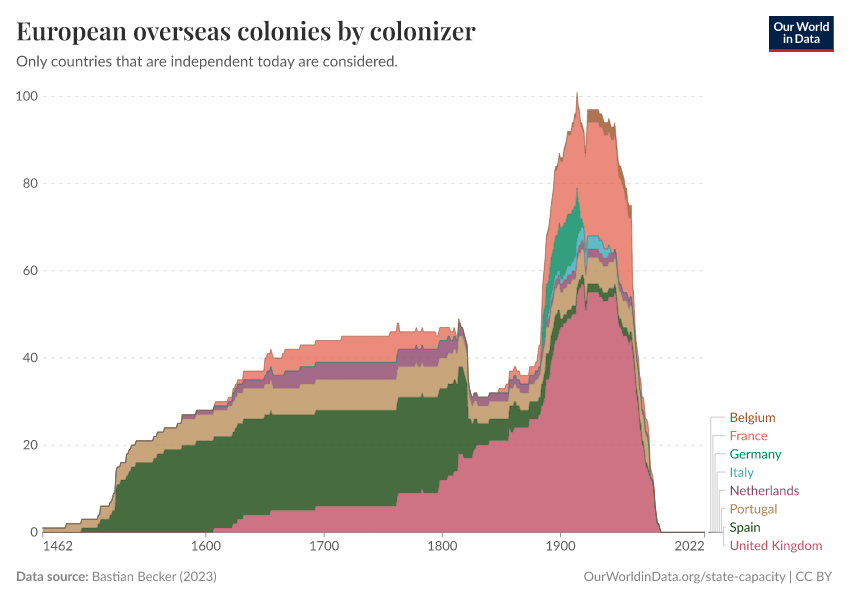
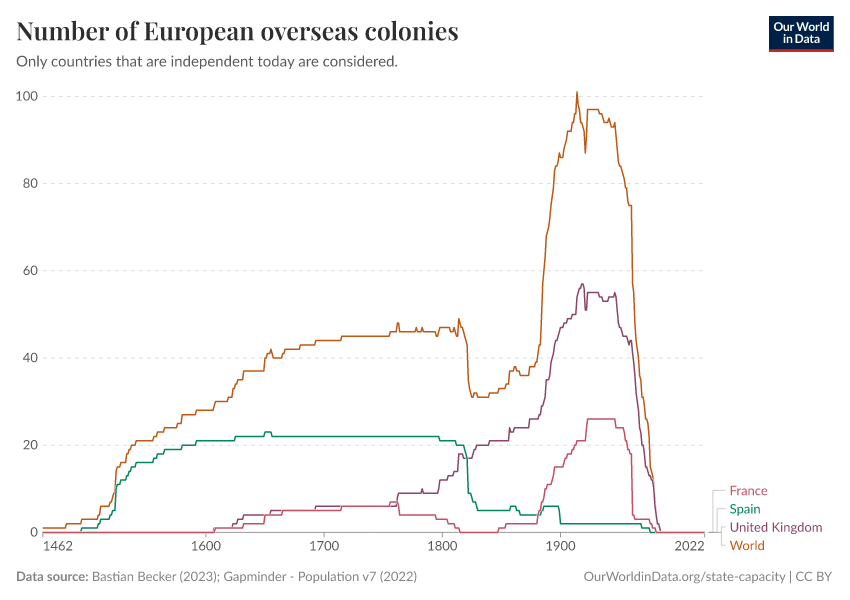
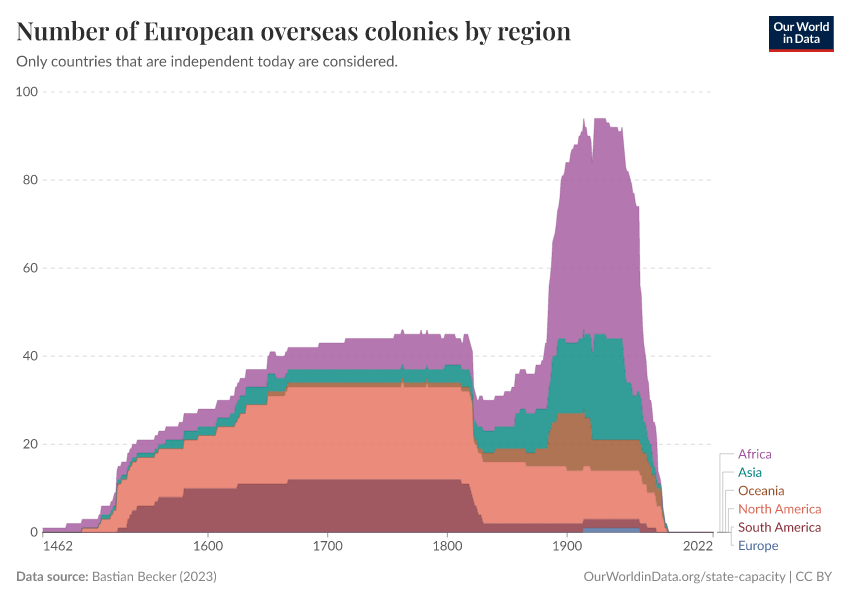
The chart, using data from researcher Bastian Becker, shows that European overseas colonialism started in the 15th century with Portugal and Spain establishing colonies, especially in the Americas.

Colonization peaked in the early 20th century, with France and the United Kingdom ruling most colonies, mainly in Asia and Africa. Between the mid-19th and mid-20th centuries, a fourth to a third of the world’s population lived in European overseas colonies.

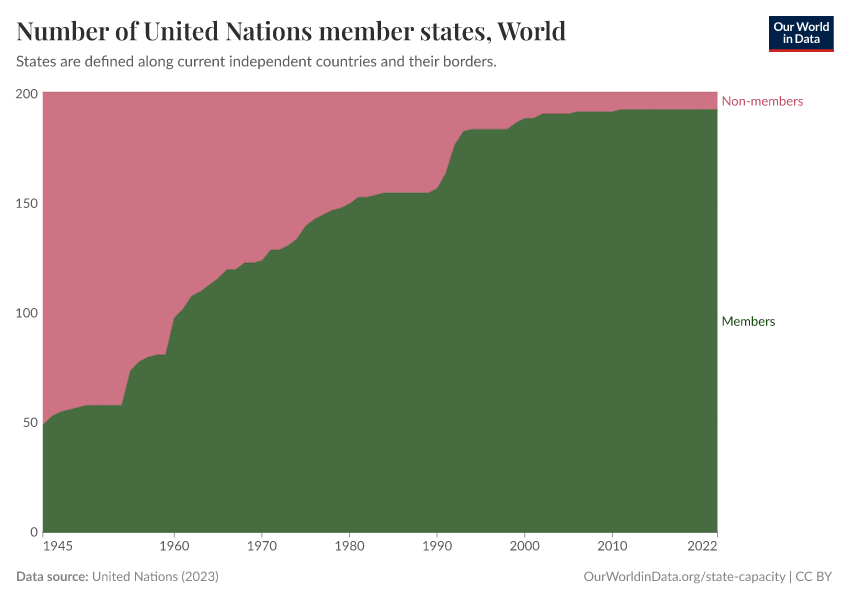
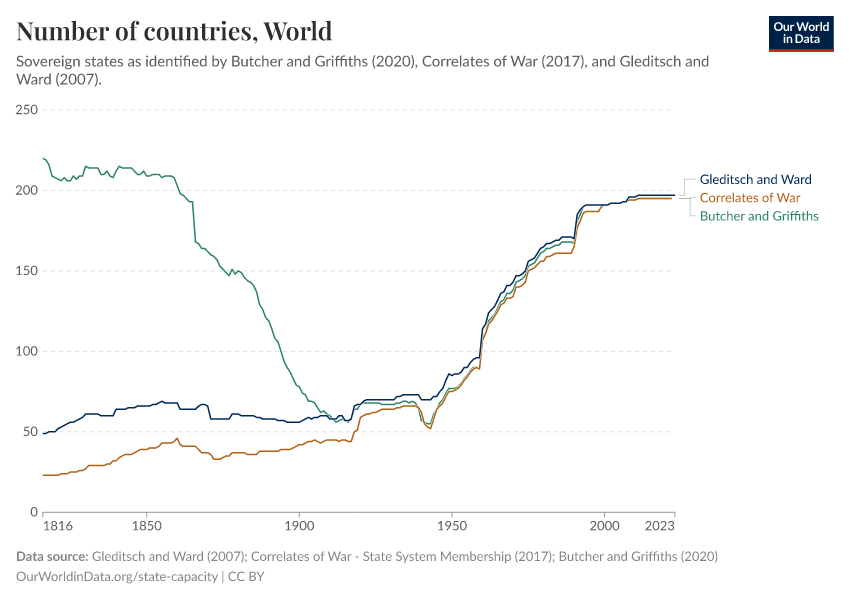
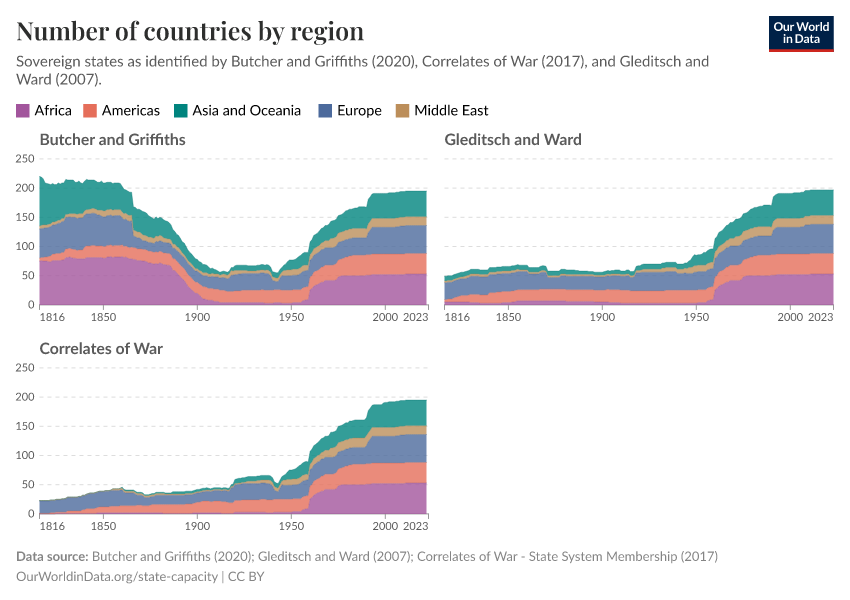
Decolonization, after a first wave in the Americas in the early 19th century, gained momentum after World War II and accelerated in the 1960s. The number of colonies declined rapidly, and independent countries increased significantly.

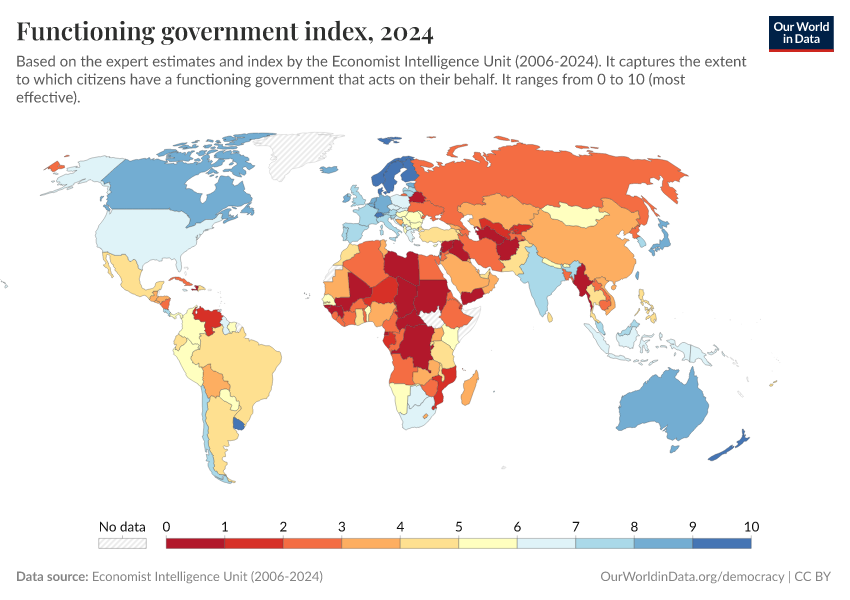
The end of widespread colonial rule has meant that now many more territories have far-reaching control over their own affairs and a say in the international community, such as at the United Nations.

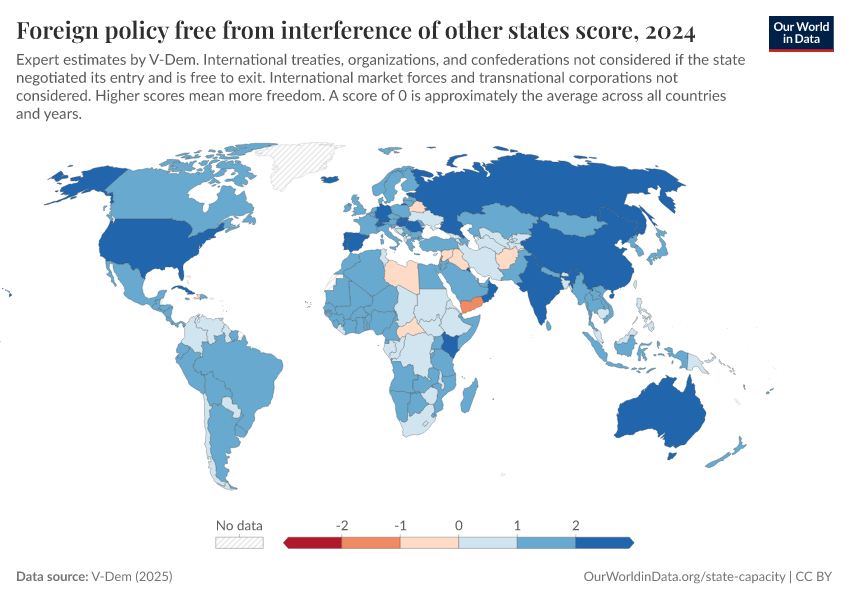
Still, while dozens of countries have become formally independent, some territories continue to have formal constraints on their self-government until today, and the domestic and foreign policies of many others remain influenced by foreign countries.

What you should know about this data
  • We rely on the Colonial Dates Dataset by Bastian Becker4 to identify European overseas colonies.
  • The Colonial Dates Dataset looks at one common type of colonialism: European countries colonizing countries overseas. It does not cover non-European colonizers, or European countries occupying their neighbors.
  • The dataset identifies the years of colonization for each currently independent country by comparing several original secondary sources. When dates differ across sources, we use the last date across them.
  • The CShapes project provides an alternative perspective by looking beyond countries that are independent today, and classifies some overseas territories as colonies to this day.

Interactive Charts on State Capacity

Acknowledgements

We thank Javier Fuenzalida and Anna Petherick for their very helpful suggestions and ideas.

Endnotes

  1. UNU-WIDER Government Revenue Dataset. Version 2023. https://doi.org/10.35188/UNU-WIDER/GRD-2023

  2. Coppedge, Michael, John Gerring, Carl Henrik Knutsen, Staffan I. Lindberg, Jan Teorell, David Altman, Michael Bernhard, Agnes Cornell, M. Steven Fish, Lisa Gastaldi, Haakon Gjerløw, Adam Glynn, Ana Good God, Sandra Grahn, Allen Hicken, Katrin Kinzelbach, Joshua Krusell, Kyle L. Marquardt, Kelly McMann, Valeriya Mechkova, Juraj Medzihorsky, Natalia Natsika, Anja Neundorf, Pamela Paxton, Daniel Pemstein, Josefine Pernes, Oskar Rydén, Johannes von Römer, Brigitte Seim, Rachel Sigman, Svend-Erik Skaaning, Jeffrey Staton, Aksel Sundström, Eitan Tzelgov, Yi-ting Wang, Tore Wig, Steven Wilson and Daniel Ziblatt. 2023. V-Dem [Country-Year/Country-Date] Dataset v13. Varieties of Democracy (V-Dem) Project.

  3. Hanson, Jonathan and Rachel Sigman. 2021. Leviathan's Latent Dimensions: Measuring State Capacity for Comparative Political Research. Journal of Politics 83(4): 1495-1510.

  4. Becker, Bastian. 2019. Introducing COLDAT: The Colonial Dates Dataset. SOCIUM/SFB1342 Working Paper Series, 02/2019

Cite this work

Our articles and data visualizations rely on work from many different people and organizations. When citing this topic page, please also cite the underlying data sources. This topic page can be cited as:

Bastian Herre and Pablo Arriagada (2023) - “State Capacity” Published online at OurWorldInData.org. Retrieved from: 'https://ourworldindata.org/state-capacity' [Online Resource]

BibTeX citation

@article{owid-state-capacity,
    author = {Bastian Herre and Pablo Arriagada},
    title = {State Capacity},
    journal = {Our World in Data},
    year = {2023},
    note = {https://ourworldindata.org/state-capacity}
}
Our World in Data logo

Reuse this work freely

All visualizations, data, and code produced by Our World in Data are completely open access under the Creative Commons BY license. You have the permission to use, distribute, and reproduce these in any medium, provided the source and authors are credited.

The data produced by third parties and made available by Our World in Data is subject to the license terms from the original third-party authors. We will always indicate the original source of the data in our documentation, so you should always check the license of any such third-party data before use and redistribution.

All of our charts can be embedded in any site.