Marriages and Divorces
How is the institution of marriage changing? What percentage of marriages end in divorce? Explore global data on marriages and divorces.
This page was first published in July 2020 and last revised in February 2025.
Marriage, as a social institution, has been around for thousands of years.1 With things that are thousands of years old, it is easy to assume that they can only change slowly. But developments in marriage since the middle of the 20th century show that this assumption is wrong: in many countries, marriages are becoming less common, people are marrying later, unmarried couples are increasingly choosing to live together, and in many countries, we are seeing a ‘decoupling’ of marriage and parenthood. Within the last decades the institution of marriage has changed more than in the thousands of years before.
Here, we present the data behind these rapid and widespread changes and discuss some of the main drivers behind them.
Marriages are becoming less common
In many countries, marriage rates are declining
The proportion of people who are getting married is going down in many countries across the world. The chart shows this trend for a selection of countries.
For the US we have data on marriage rates going back to the late 19th century. This lets us see when the decline started, and trace the influence of social and economic changes during the process.
- In 1920, shortly after the First World War, there were 12 marriages annually for every 1,000 people in the US. Marriages in the US then were around twice as common as today.
- In the 1930s, during the Great Depression, the rate fell sharply. In the 1930s marriages became again more common and in 1946 – the year after the Second World War ended – marriages reached a peak of 16.4 marriages per 1,000 people.
- Marriage rates fell again in the 1950s and then bounced back in the 1960s.
- The long decline started in the 1970s. Since 1972, marriage rates in the US have fallen signficantly, and are currently at the lowest point in recorded history.
The chart also shows that in comparison to other rich countries, the US has had particularly high historical marriage rates. But in recent decades, marriage rates have decreased in almost all rich countries.

Marriages across cohorts have declined
This chart looks at the change in marriages from a different angle and answers the question: How likely were people of different generations to be married by a given age?
Some countries have statistical records going back several generations, which allow us to estimate marriage rates by age and year of birth. The charts here show this data for women and men born in England and Wales as early as 1900.
For instance, you can see what share of 30-year-olds have ever been married, depending on their birth year. Of the women born in 1940, more than 90% were married by age 30, and 83% of the men. Meanwhile among those born in 1990, only about 29% of women were married by age 30, and just about 20% of the men.
The trend is stark: women and men from England and Wales born in recent decades are much less likely to have married, and that’s true at all ages.
There are two causes for this: an increasing share of people in later cohorts are not getting married, and a higher share of people in later cohorts marry later in life.


People are marrying later
In many countries, declining marriage rates have been accompanied by an increase in the age at which people get married.
This is shown in the chart here, where we plot the average age of women at first marriage for a selection of countries from around the world.
A few decades ago, the average woman got married in her early or mid-twenties across the countries shown. More recently, the average woman gets married in her later 20s or even early 30s in most countries.

The share of women who are married or in a union has decreased only slightly worldwide
In recent decades there has been a decline in global marriage rates, and at the same time, there has been an increase in partnerships outside of marriage. What’s the combined effect if we consider these changes together?
The chart below plots estimates from the United Nations.
Overall, we see a global decrease – but only a relatively small one, from 69% in 1970 to 64% in 2024. At any given point in the last five decades, around two-thirds of all women were married or in a union.
There are differences between regions: the share of women married or in a union has changed less in Asia and South America, and more in Africa, Europe, and North America.

Similarly, there are different trends across age groups: while the share of women in their teens and twenties who are married or in a union has declined significantly, older women today are about as likely to be married or in a union as they were half a century ago.
There has been a ‘decoupling’ of marriage and parenthood
Higher shares of children are born outside of marriage in most rich countries
An arrangement where two or more people are not married but live together is referred to as cohabitation. In recent decades, cohabitation has become increasingly common around the world. In the US, for example, the US Census Bureau estimates that the share of young adults between the ages of 18 and 24 living with an unmarried partner went up from 0.1% to 9.4% over the period 1968-2018; and according to a survey from Pew Research, today most Americans favor allowing unmarried cohabiting couples to have the same legal rights as married couples.
The increase in cohabitation is the result of the two changes that we discussed above: fewer people are choosing to marry, and those people who do get married tend to do so when they are older and often live with their partner before getting married. In England and Wales, for example, around 90% of people who got married in 2022 cohabited first.2
Long-run cross-national data on the share of couples cohabiting is not available, but some related data is. In particular, the proportion of births outside marriage provides a useful proxy measure, allowing comparisons across countries and time. If more unmarried people are having children, it suggests that more people are entering long-term cohabiting relationships without first getting married. It isn’t a perfect proxy – as we’ll see below, rates of single parenting have also changed, meaning that rates of births outside marriage will not match perfectly with cohabitation rates – but it provides some information regarding the direction of change.
The chart here shows the percentage of all children who were born to unmarried parents.
As we can see, the share of children born outside of marriage has increased substantially in almost all OECD countries in recent decades. The exception is Japan, where there has been only a very minor increase.
In 1970, less than 10% of children were born outside of marriage in most OECD countries. In 2020, this share had increased to more than 30% in most countries and to more than half in some.
The trend is not restricted to the richest countries. In Mexico and Costa Rica, for example, the increase has been very large, and today the majority of their children are born to unmarried parents.

Single parenting is common and has increased in many countries
The next chart shows the share of households comprised of a single parent who lives with dependent children. There are large differences between countries, but rates are increasing in many of them.

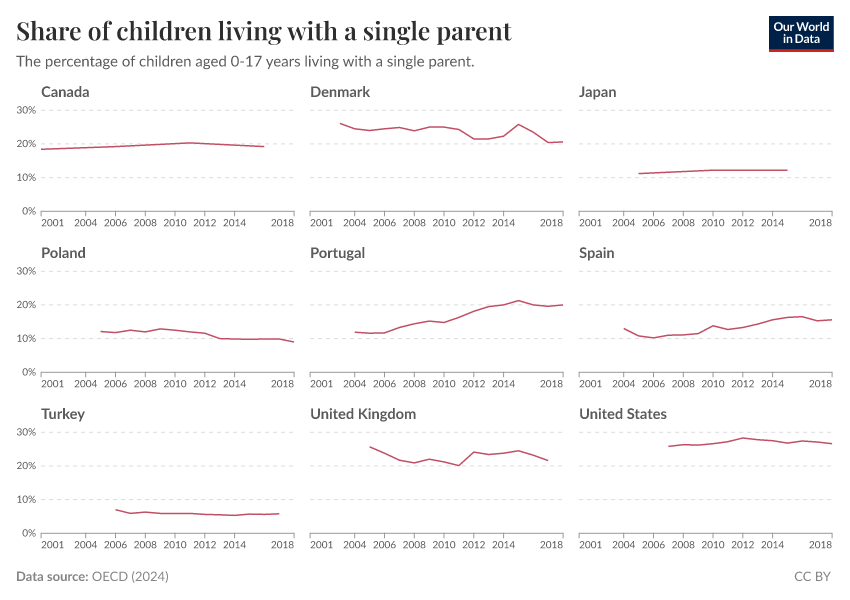
A different way to examine this question is to calculate the share of children who live with a single parent. The picture is less clear there, with the share increasing in some rich countries, but remaining unchanged or falling in others.
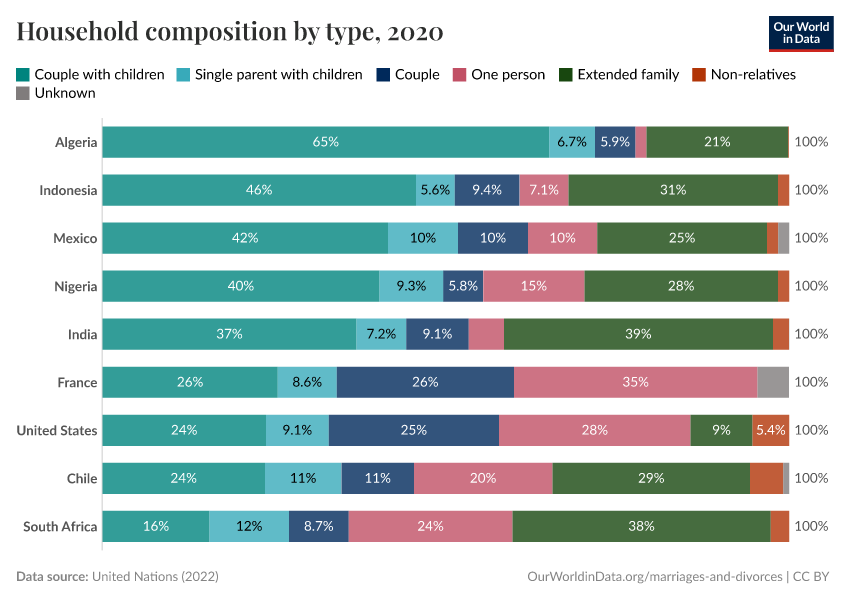
The causes and situations leading to single parenting are varied, and unsurprisingly, single-parent families are very diverse in terms of socio-economic background and living arrangements, across countries, within countries, and over time. Our related chart shows how common single-parent households are relative to other types of households in countries around the world. However, there are some common patterns:
- Women head the majority of single-parent households, and this gender gap tends to be stronger for parents of younger children. Across OECD countries, about 10% of children aged 0-5 years live with only their mother, but less than 1% live with just their father.3
- Single-parent households are among the most financially vulnerable groups. This is true even in rich countries. According to Eurostat data, across European countries, 47% of single-parent households were “at risk of poverty or social exclusion” in 2017, compared with 21% of two-parent households.4
- Single parenting was probably more common a couple of centuries ago. But single parenting back then was often caused by high maternal mortality rather than choice or relationship breakdown; it was also typically short in duration since remarriage rates were high.5
Same-sex marriage has become possible in many countries
Marriage equality is increasingly considered a human and civil right, with important political, social, and religious implications around the world.
In 1989, Denmark became the first country to recognize a legal relationship for same-sex couples, establishing ‘registered partnerships’ that granted those in same-sex relationships most of the rights given to married heterosexuals.
It took a further decade for same-sex marriage to become legal anywhere in the world. In December 2000, the Netherlands became the first country to establish same-sex marriage by law.
In the first two decades of the 21st century legislation has quickly spread across more countries.
Where are same-sex marriages legal?
This map shows all the countries where same-sex marriage is legal, or civil unions are possible.
Some of the first countries to allow same-sex marriage were in Western Europe. But same-sex marriage is also legal in other parts of the world, especially in North and South America.

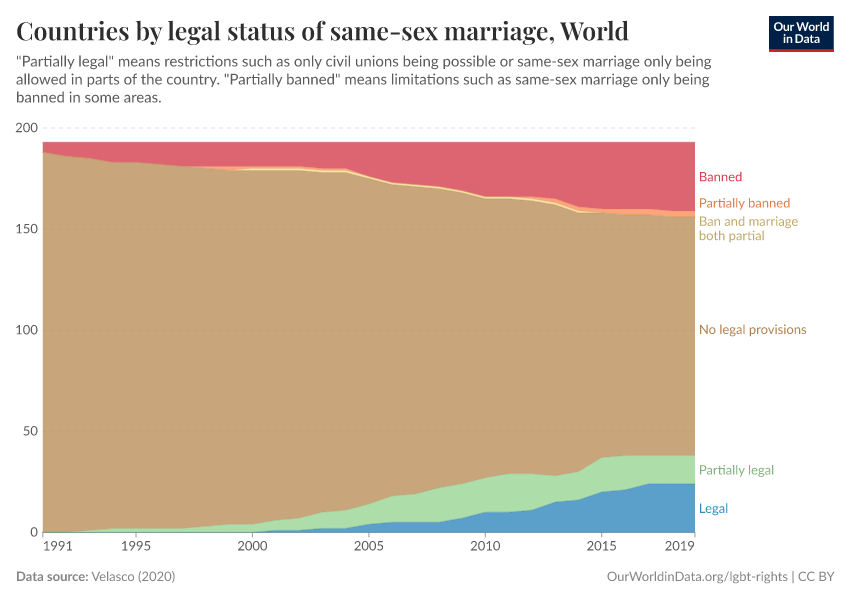
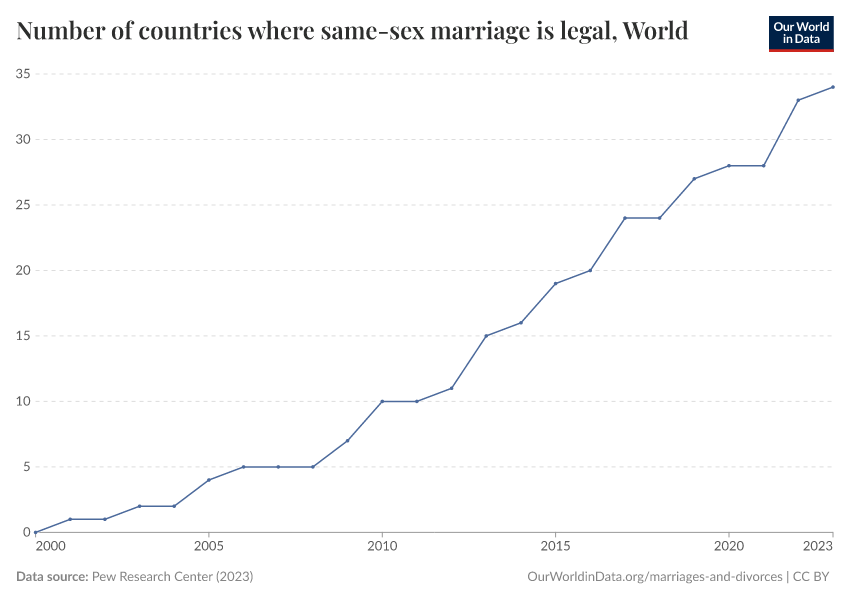
Most progress in same-sex marriage equality has happened in the last two decades
The rate of adoption of marriage equality legislation over time gives us some perspective on just how quickly things have changed. The chart shows that in the year 2000, same-sex marriage was not fully legal in any country, and partially legal (mainly through civil unions) in only a handful of countries. Two decades later, it was legal in many more.

Changes in attitudes towards homosexuality are one of the key factors that have enabled the legal transformations that are making same-sex marriage increasingly possible.6
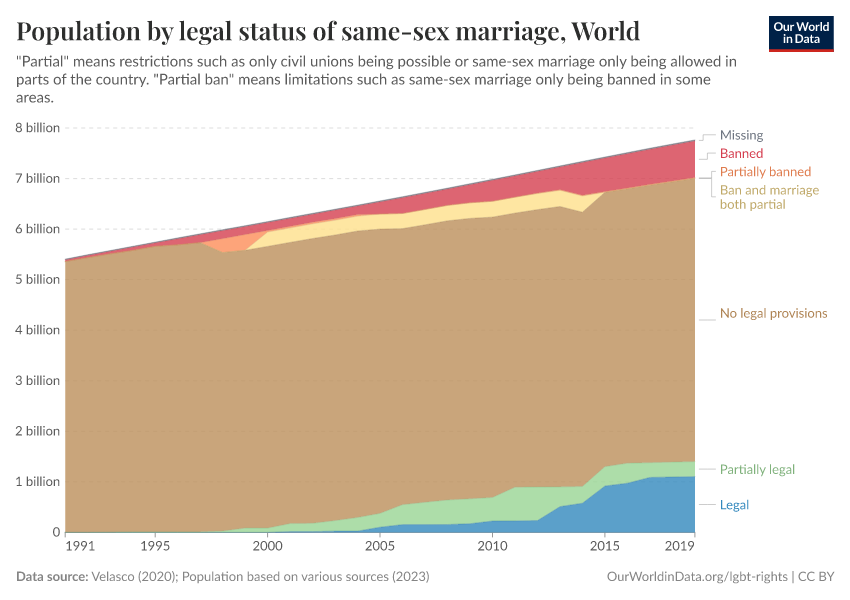
Despite this positive trend, much remains to be done to improve the rights of same-sex couples. In most countries, same-sex marriage remains illegal, and as the charts show, some countries have explicitly banned same-sex marriages in recent decades.
And even in countries where same-sex marriage is legal, same-sex couples face violence and discrimination.
Marriage trends show that social institutions can change quickly
Across the world, fewer people are choosing to marry, and those who do marry are, on average, doing so later in life. The underlying drivers of these trends include the rise of contraceptives, the increase of female participation in labor markets (as we explain on our topic page on Women’s Employment), and the transformation of institutional and legal environments, such as new legislation conferring more rights on unmarried couples.7
These changes have led to a broad transformation of family structures. In the last decades, many countries have seen an increase in unmarried partners cohabitating, and it is becoming more common for children to live with a single parent or with parents who are not married.
These changes have come together with a large and significant shift in people’s perceptions of the types of family structures that are possible, acceptable, and desirable. Perhaps the clearest example of this is the rise of same-sex marriage.
The changing role of marriage and the rise of new family models since the middle of the 20th-century show that social institutions that have been around for thousands of years can change very rapidly.
Divorces have become more common, but trends differ a lot by country
Divorce rates
How have divorce rates changed over time? Are divorces on the rise across the world?
When we zoom out and look at the large-scale picture at the global or regional level since the 1970s, we see an overall increase in divorce rates. The UN in its overview of global marriage patterns notes that there is a general upward trend: "at the world level, the proportion of adults aged 35-39 who are divorced or separated has doubled, passing from 2% in the 1970s to 4% in the 2000s."
But when we look more closely at the data we can also see that this misses two key insights: there are notable differences between countries; and it fails to capture the pattern of these changes between the 1990s and today.
In the chart here we show the crude divorce rate — the number of divorces per 1,000 people in the country.
As we see in the chart, divorce rates increased markedly in many countries between the 1970s and 1990s. In the UK, Norway, and South Korea, divorce rates more than tripled.
Since then, however, trends have varied substantially from country to country. The US stands out as a bit of an outlier, with consistently higher divorce rates than most other countries, but also an earlier 'peak'. South Korea had a much later 'peak', with divorce rates continuing to rise until the early 2000s. In other countries – such as Norway or Turkey – divorces have stayed high or continued to rise.

The pattern of rising divorce rates, followed by a plateau or fall in some countries (particularly richer countries) might be partially explained by the differences in divorce rates across cohorts, and the delay in marriage we see in younger couples today.
Economists Betsey Stevenson and Justin Wolfers looked in detail at the changes and driving forces in marriage and divorce rates in the US.8 They suggest that the changes we see in divorce rates may be partly reflective of the changes in expectations within marriages as women enter the workforce.
The share of marriages ending in divorce by year of marriage
Trends in crude divorce rates give us a general overview of how many divorces happen each year, but they need to be interpreted with caution. First, crude rates mix a large number of cohorts – both older and young couples; and second, they do not account for how the number of marriages is changing.
To understand how patterns of divorce are changing it is more helpful to look at the percentage of marriages that end in divorce, and look at these patterns by cohort.
Let's take a look at two regions where divorce rates have been declining in recent decades.
In the chart here we show the percentage of marriages that ended in divorce in England and Wales since 1963. This is broken down by the number of years after marriage – that is, the percentage of couples who had divorced five, ten, twenty, thirty, and forty years after they got married.
Here we see that for all three lines, the overall pattern is similar:
- The share of marriages that end in divorce increased from the 1960s to the 1990s.
- In 1963, only 1.5% of couples had divorced before their fifth anniversary, 7.8% had divorced before their tenth, and 19% before their twentieth anniversary. By the mid-1990s this had increased to 11%, 24%, and 38%, respectively.
- Since then, divorces have been on the decline. The percentage of couples divorcing in the first five years has approximately halved since its 1990s peak. And the percentage who got divorced within the first 10 years of their marriage has also fallen significantly.

The share of marriages ending in divorce by anniversary year
What might explain the recent reduction in overall divorce rates in some countries?
The overall trend can be broken down into two key drivers: more recent cohorts being less likely to get a divorce, and having been married for longer before divorcing.
We see both of these factors in data on divorce rates from England and Wales. The chart maps out the percentage of marriages ending in divorce by cohort: each line represents the year the couple got married (those married in 1965, in 1970, etc.), and the horizontal axis is the number of years since the wedding.
A useful way to compare different age cohorts is by the steepness of the line: steeper lines indicate a faster accumulation of divorces year-on-year, particularly in the earlier stages of marriages.
We see that the share of marriages ending in divorce increased significantly for couples married in the 1980s and 1990s compared to those who got married in the 1960s and 1970s. The probability of divorce within 10 years was more than twice as high for couples married in 1995 versus those who got married in 1965.
But since then, the likelihood of divorce has fallen, and marriages have tended to last longer. It fell for couples married in the 2000s and again for those in the 2010s. Both the likelihood of divorce has been falling, and the length of marriage has been increasing.
Still, we don't know yet how long the marriages of these younger couples today will last. It will take several decades before we have the full picture of more recent marriages and their eventual outcomes.

Key Charts on Marriages & Divorces
See all charts on this topic


Featured Data on Marriages & Divorces
Endnotes
Recorded evidence of marriage ceremonies (and divorce) dates back to the third millennium BCE in ancient Mesopotamia and Babylonia. Bertman, S. (2005). Handbook to Life in Ancient Mesopotamia. Oxford University Press.
Office for National Statistics (2024). Marriages in England and Wales. Available online.
This is based on estimates from 2016 published in the OECD Family Database (Table SF1.3 Further information on living arrangements of children).
The concept of “risk of poverty or social exclusion” corresponds to the intersection of several vulnerability dimensions. It covers persons who are either at risk of poverty, severely materially deprived, or living in a household with a very low work intensity. You find more details about this in Eurostat here.
For a discussion of historical remarriage patterns see for example Van Poppel, F. (1998). Nineteenth-century remarriage patterns in the Netherlands. The Journal of Interdisciplinary History, 28(3), 343-383. Available online.
For details see Adamczyk, A., & Liao, Y. C. (2019). Examining public opinion about LGBTQ-related issues in the United States and across multiple nations. Annual Review of Sociology, 45, 401-423.
You can read more about the driving forces of family change in Stevenson, B., & Wolfers, J. (2007). Marriage and divorce: Changes and their driving forces. Journal of Economic Perspectives, 21(2), 27-52. Available online.
Stevenson, B., & Wolfers, J. (2007). Marriage and divorce: Changes and their driving forces. Journal of Economic Perspectives, 21(2), 27-52. Available online
Cite this work
Our articles and data visualizations rely on work from many different people and organizations. When citing this topic page, please also cite the underlying data sources. This topic page can be cited as:
Bastian Herre, Veronika Samborska, Esteban Ortiz-Ospina, and Max Roser (2020) - “Marriages and Divorces” Published online at OurWorldinData.org. Retrieved from: 'https://ourworldindata.org/marriages-and-divorces' [Online Resource]BibTeX citation
@article{owid-marriages-and-divorces,
    author = {Bastian Herre and Veronika Samborska and Esteban Ortiz-Ospina and Max Roser},
    title = {Marriages and Divorces},
    journal = {Our World in Data},
    year = {2020},
    note = {https://ourworldindata.org/marriages-and-divorces}
}
Reuse this work freely
All visualizations, data, and articles produced by Our World in Data are completely open access under the Creative Commons BY license. You have the permission to use, distribute, and reproduce these in any medium, provided the source and authors are credited.
The data produced by third parties and made available by Our World in Data is subject to the license terms from the original third-party authors. We will always indicate the original source of the data in our documentation, so you should always check the license of any such third-party data before use and redistribution.
All of our charts can be embedded in any site.