Air Pollution
Our overview of indoor and outdoor air pollution.
This article was first published in October 2017. We made minor changes to the text in February 2024.
Air pollution is one of the world's largest health and environmental problems. It develops in two contexts: indoor (household) air pollution and outdoor air pollution.
In this topic page, we look at the aggregate picture of air pollution – both indoor and outdoor. We also have dedicated topic pages that look in more depth at these subjects:
See all interactive charts on Air Pollution ↓
Other research and writing on air pollution on Our World in Data:
- Air pollution: does it get worse before it gets better?
- Data Review: How many people die from air pollution?
- Energy poverty and indoor air pollution: a problem as old as humanity that we can end within our lifetime
- How many people do not have access to clean fuels for cooking?
- What are the safest and cleanest sources of energy?
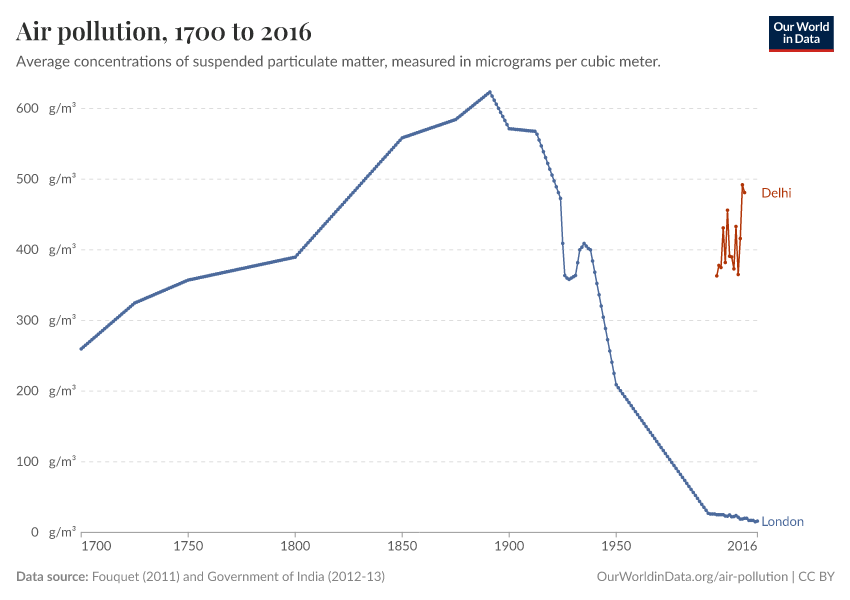
- What the history of London’s air pollution can tell us about the future of today’s growing megacities
- When will countries phase out coal power?
Air pollution is one of the world's leading risk factors for death
Air pollution is responsible for millions of deaths each year
Air pollution – the combination of outdoor and indoor particulate matter and ozone – is a risk factor for many of the leading causes of death, including heart disease, stroke, lower respiratory infections, lung cancer, diabetes, and chronic obstructive pulmonary disease (COPD).
The Institute for Health Metrics and Evaluation (IHME), in its Global Burden of Disease study, provides estimates of the number of deaths attributed to the range of risk factors for disease.1
In the visualization, we see the number of deaths per year attributed to each risk factor. This chart shows the global total but can be explored for any country or region using the "change country" toggle.
Air pollution is one of the leading risk factors for death. In low-income countries, it is often very near the top of the list (or is the leading risk factor).

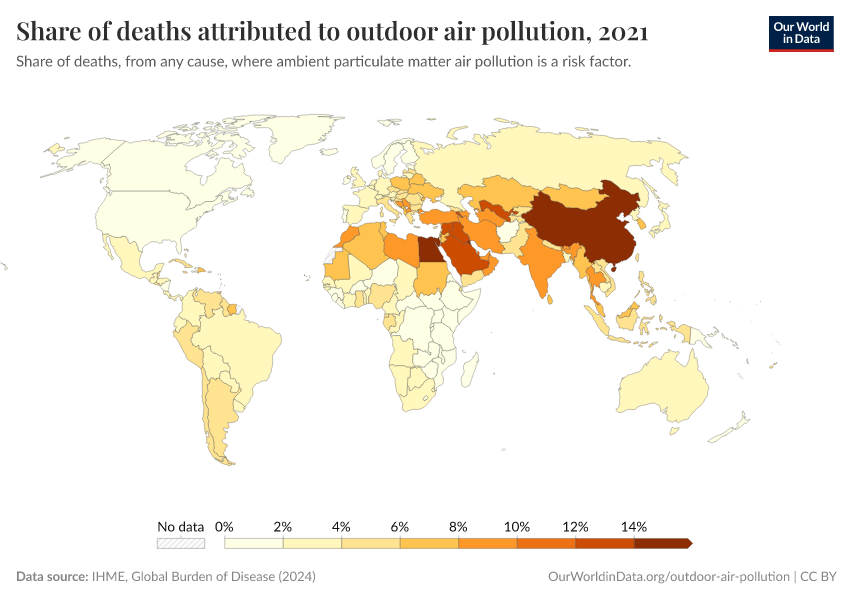
Air pollution contributes to one in ten deaths globally
In recent years, air pollution has contributed to one in ten deaths globally.2
In the map shown here, we see the share of deaths attributed to air pollution across the world.

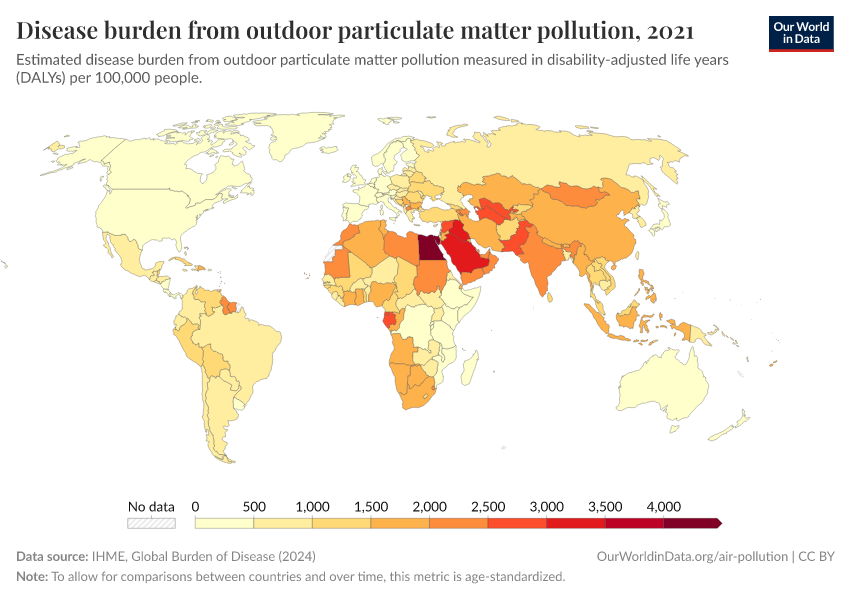
Air pollution is one of the leading risk factors for disease burden
Air pollution is one of the leading risk factors for death. But its impacts go even further; it is also one of the main contributors to the global disease burden.
Global disease burden takes into account not only years of life lost to early death but also the number of years lived in poor health.
In the visualization, we see risk factors ranked in order of DALYs – disability-adjusted life years – the metric used to assess disease burden. Again, air pollution is near the top of the list, making it one of the leading risk factors for poor health across the world.
Air pollution not only takes years from people's lives but also has a large effect on the quality of life while they're still living.

Who is most affected by air pollution?
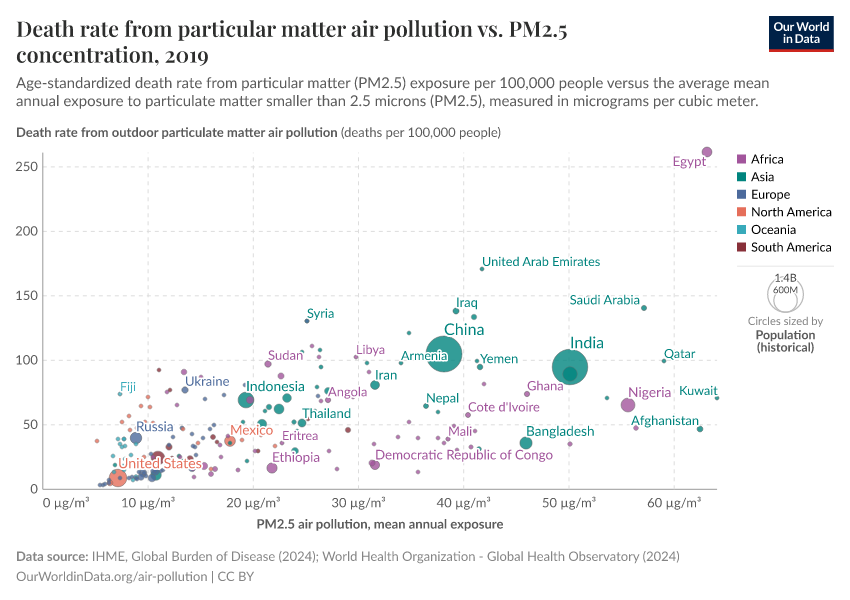
Death rates from air pollution are highest in low-to-middle-income countries
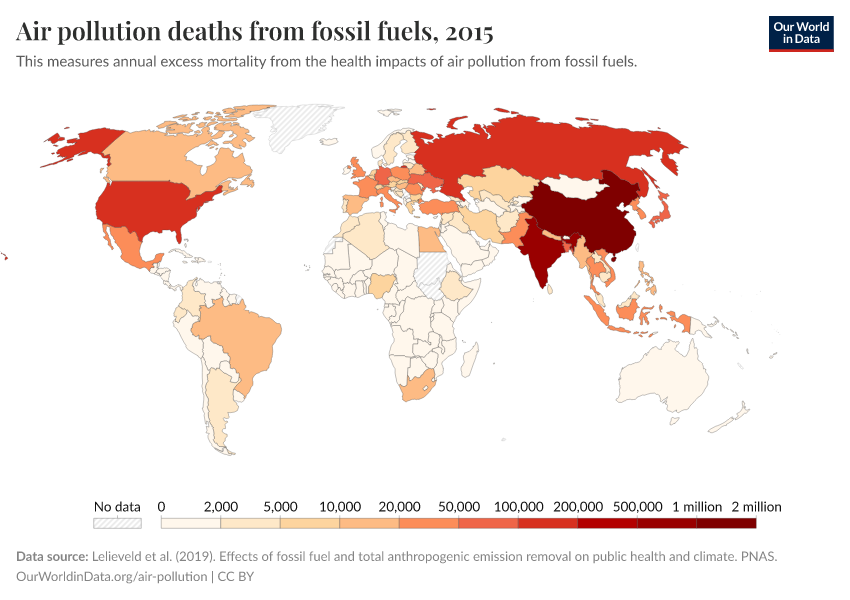
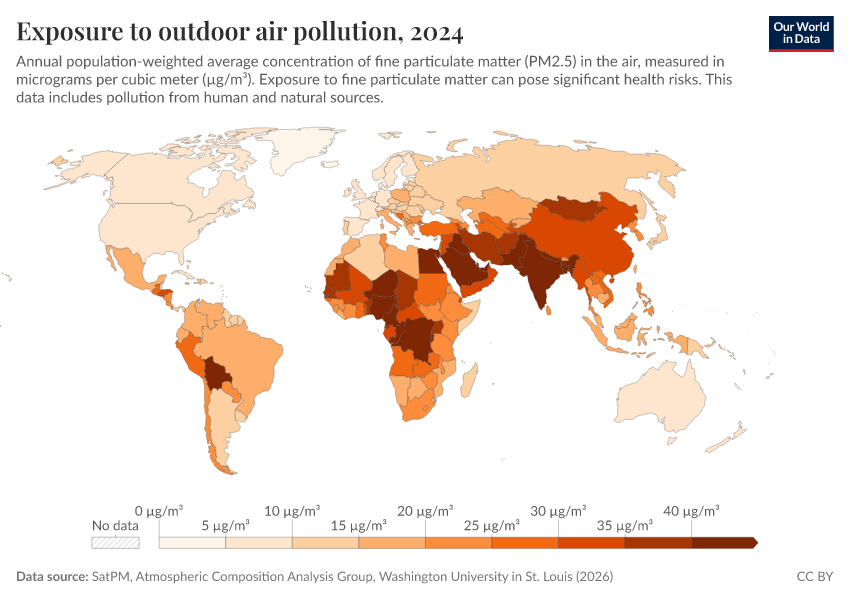
Air pollution is a health and environmental issue across all countries of the world but with large differences in severity.
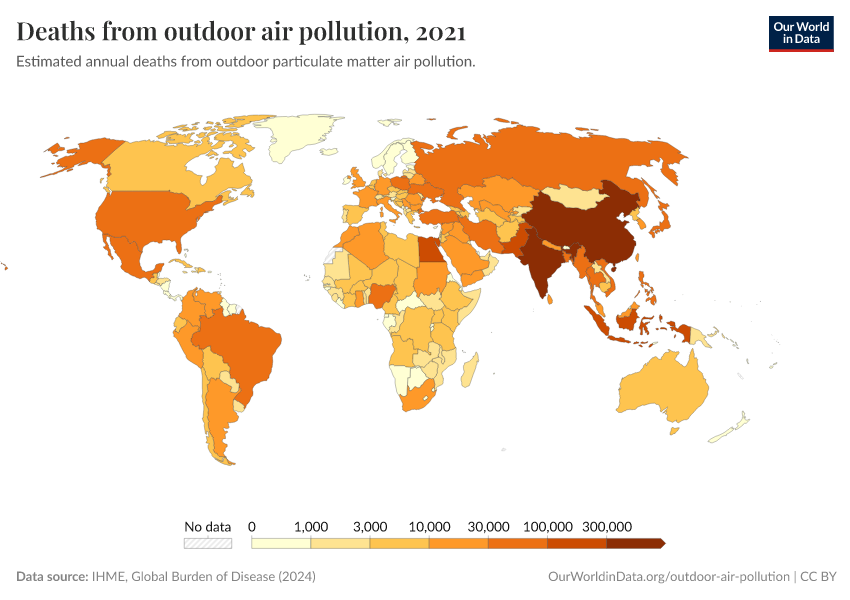
In the interactive map, we show death rates from air pollution across the world, measured as the number of deaths per 100,000 people in a given country or region.
The burden of air pollution tends to be greater across both low and middle-income countries for two reasons: indoor pollution rates tend to be high in low-income countries due to a reliance on solid fuels for cooking, and outdoor air pollution tends to increase as countries industrialize and shift from low to middle incomes.
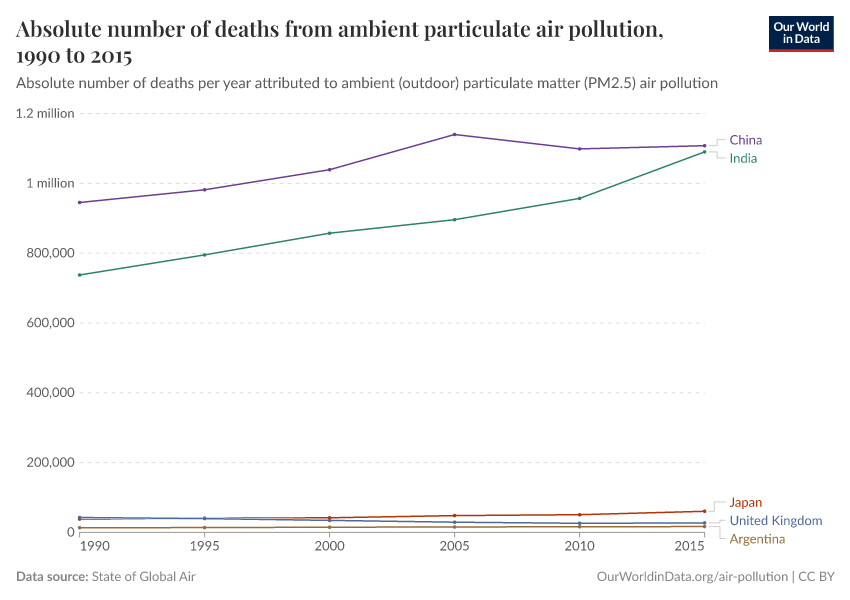
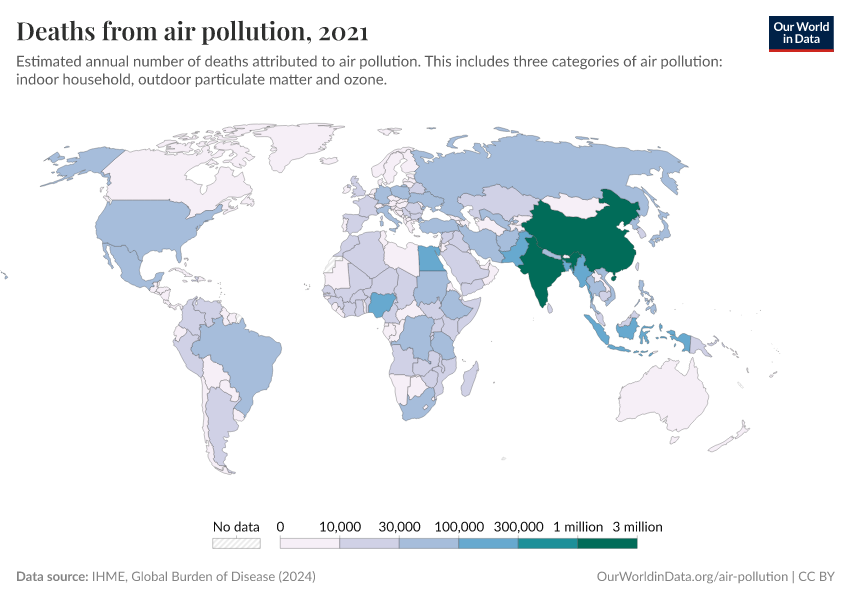
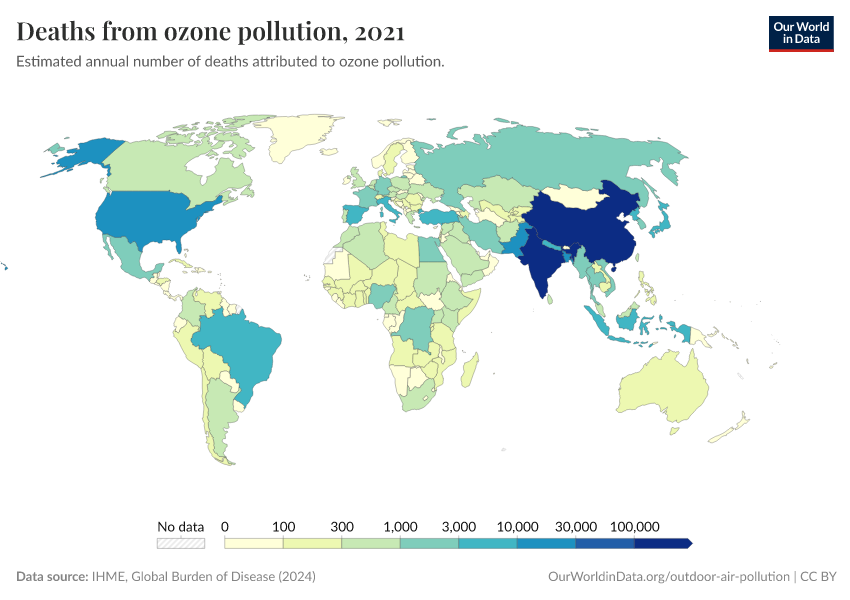
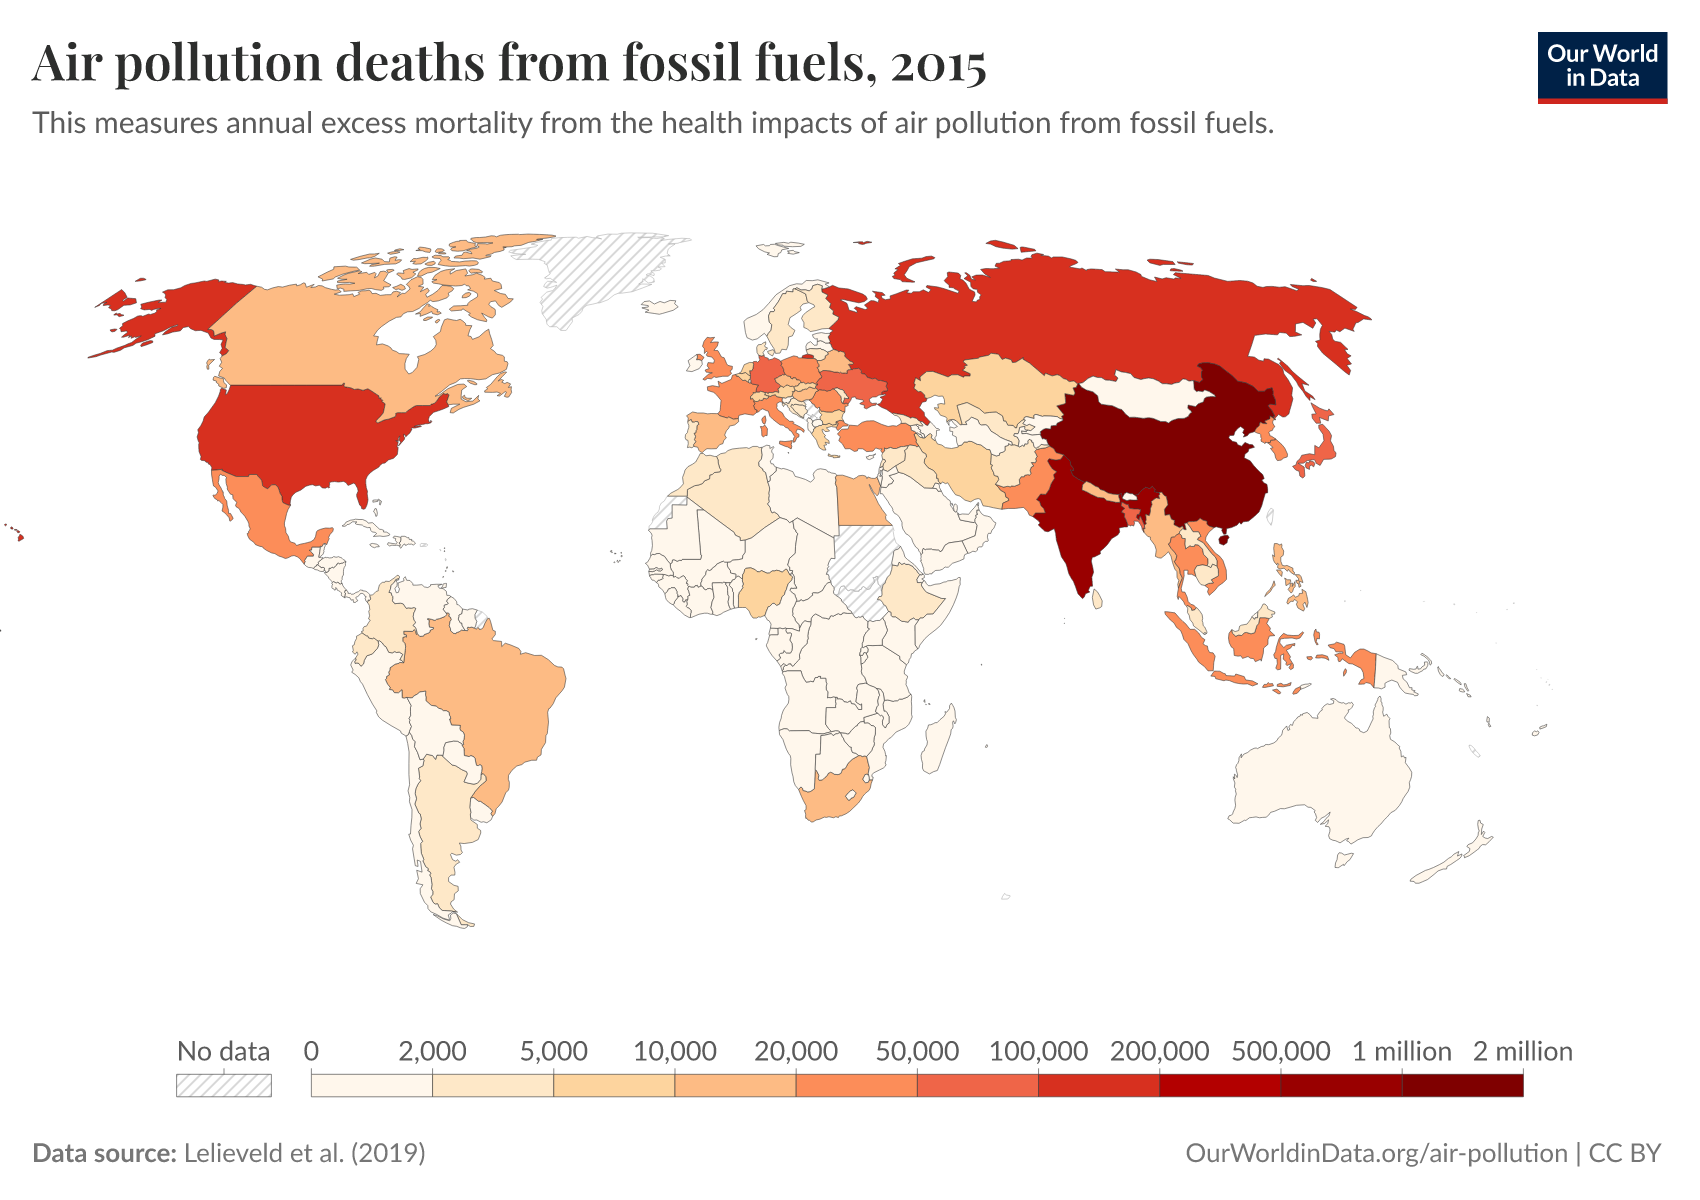
A map of the number of deaths from air pollution by country can be found here.

How are death rates from air pollution changing?
Death rates from air pollution are falling – mainly due to improvements in indoor pollution
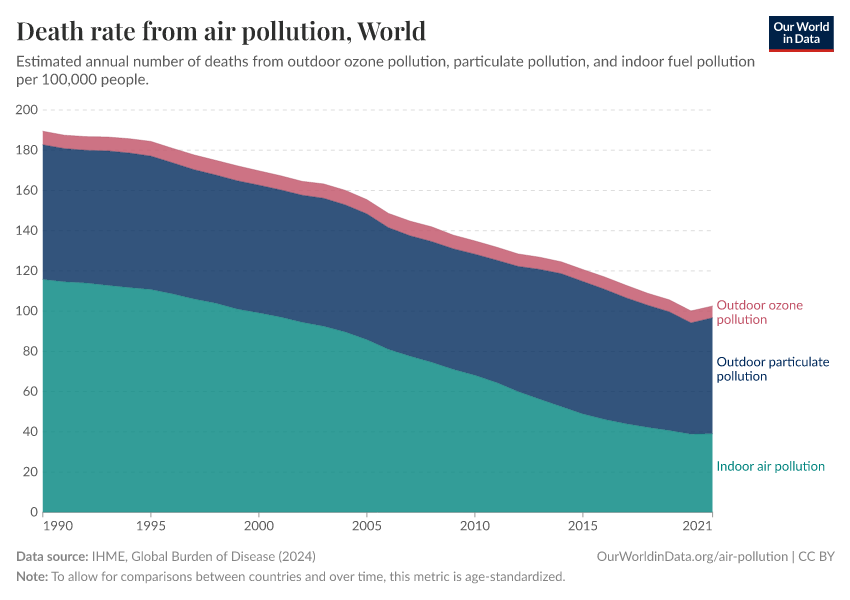
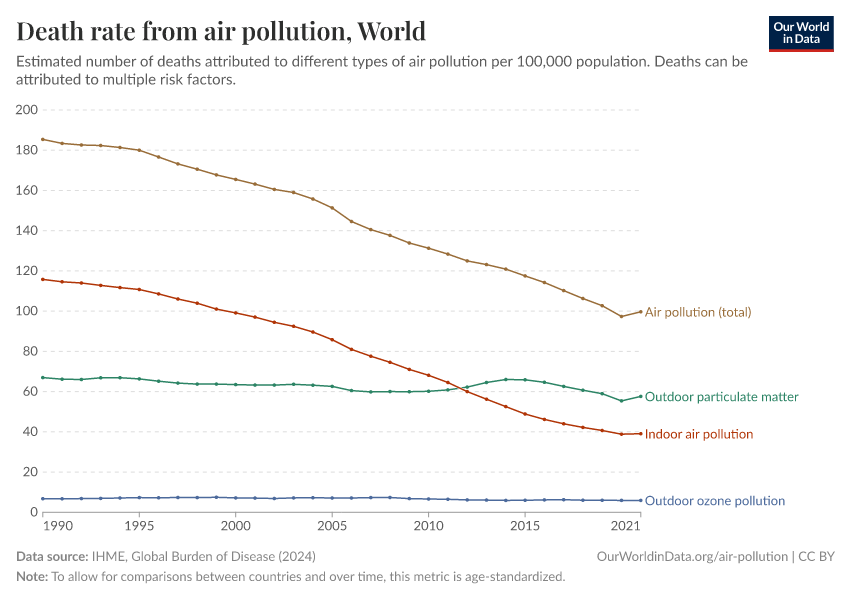
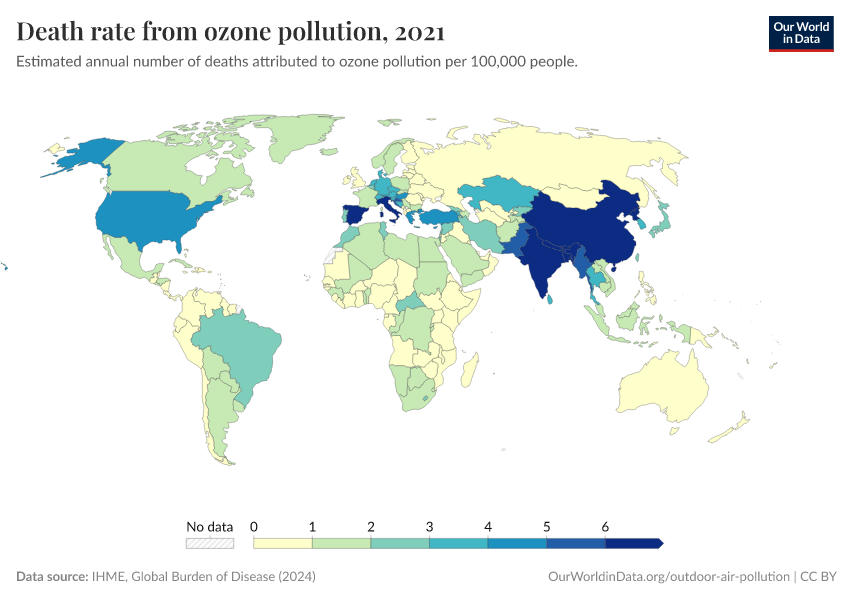
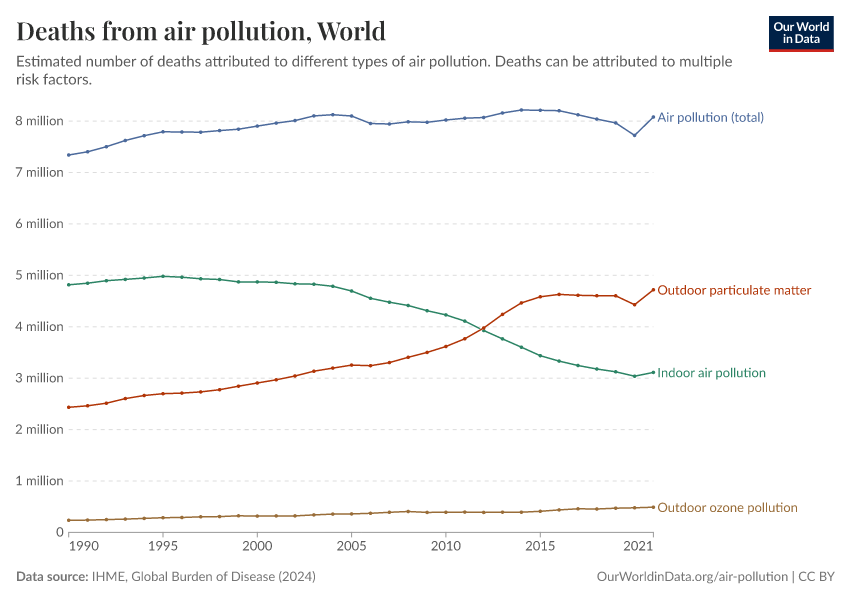
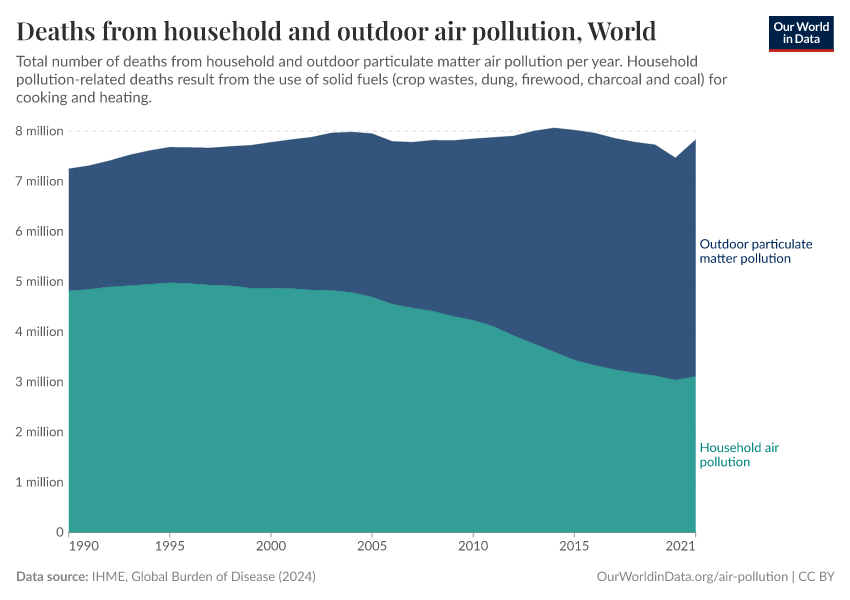
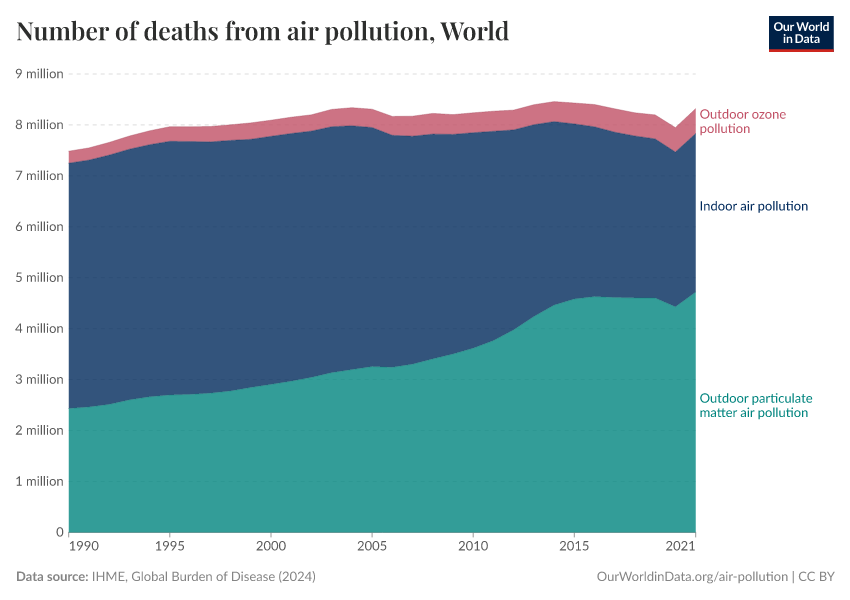
In the visualization, we show global death rates from air pollution over time – shown as the total air pollution – in addition to the individual contributions from outdoor and indoor pollution.
Globally, we see that in recent decades, the death rates from total air pollution have declined: since 1990, death rates have nearly halved. But, as we see from the breakdown, this decline has been primarily driven by improvements in indoor air pollution.
Death rates from indoor air pollution have seen an impressive decline, while improvements in outdoor pollution have been much more modest.
You can explore this data for any country or region using the "change country" toggle on the interactive chart.

Key Charts on Air Pollution
See all charts on this topic


Featured Data on Air Pollution
Endnotes
Murray, C. J., Aravkin, A. Y., Zheng, P., Abbafati, C., Abbas, K. M., Abbasi-Kangevari, M., ... & Borzouei, S. (2020). Global burden of 87 risk factors in 204 countries and territories, 1990–2019: a systematic analysis for the Global Burden of Disease Study 2019. The Lancet, 396(10258), 1223-1249.
Here, we use the term 'contributes,' meaning it was one of the attributed risk factors for a given disease or cause of death. There can be multiple risk factors for a given disease that can amplify one another. This means that in some cases, air pollution was not the only risk factor but one of several.
Cite this work
Our articles and data visualizations rely on work from many different people and organizations. When citing this topic page, please also cite the underlying data sources. This topic page can be cited as:
Hannah Ritchie and Max Roser (2021) - “Air Pollution” Published online at OurWorldinData.org. Retrieved from: 'https://ourworldindata.org/air-pollution' [Online Resource]BibTeX citation
@article{owid-air-pollution,
    author = {Hannah Ritchie and Max Roser},
    title = {Air Pollution},
    journal = {Our World in Data},
    year = {2021},
    note = {https://ourworldindata.org/air-pollution}
}
Reuse this work freely
All visualizations, data, and articles produced by Our World in Data are completely open access under the Creative Commons BY license. You have the permission to use, distribute, and reproduce these in any medium, provided the source and authors are credited.
The data produced by third parties and made available by Our World in Data is subject to the license terms from the original third-party authors. We will always indicate the original source of the data in our documentation, so you should always check the license of any such third-party data before use and redistribution.
All of our charts can be embedded in any site.