Ozone Layer
International action on ozone-deplying substances has led to a 99% reduction in emissions.
The ozone layer plays a vital role in making the planet habitable for us and other species. High in the atmosphere – between 10 to 50 kilometers above the earth's surface – the ozone layer absorbs most of the sun’s ultraviolet radiation.
But, during the 1970s, ‘80s, and ‘90s, humans were emitting large quantities of substances that depleted the ozone layer. This led to the creation of ozone holes at the earth’s poles, exposing life to higher levels of ultraviolet radiation and increasing the risks of skin cancer in humans.
During the 1980s, the world came together to form an international agreement to reduce – and eventually eliminate – emissions of these depleting substances. The political agreements were very effective. Since then, global emissions have fallen by more than 99%.
The ozone holes have stopped growing and are now starting to close.
This page includes all of our data, visualizations, and writing on the ozone layer, its depletion, and its path to recovery.
Key insights on the Ozone Layer
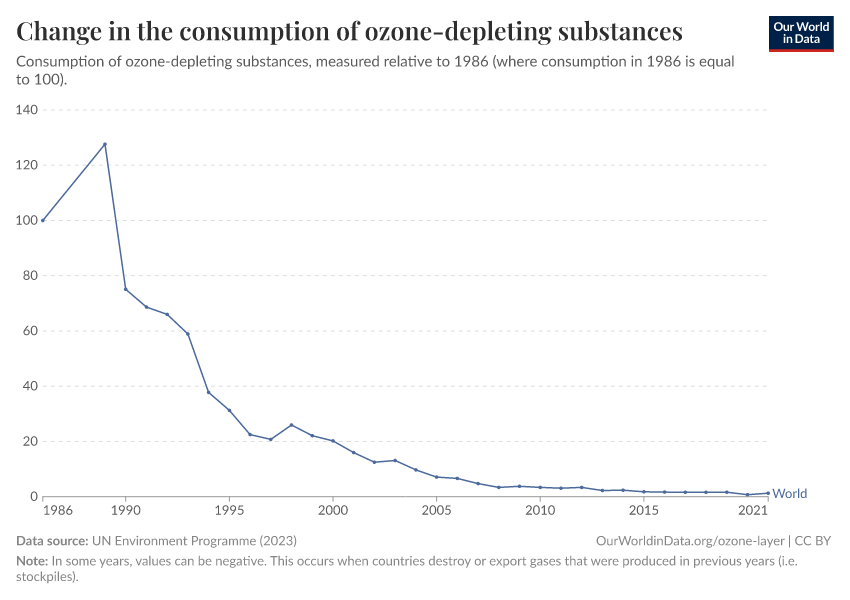
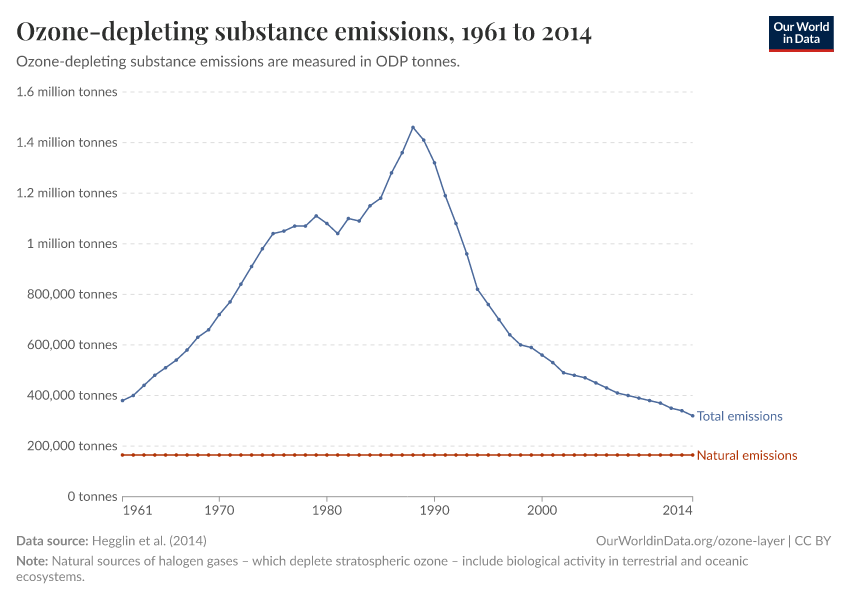
Emissions of substances that deplete the ozone layer have fallen by more than 99%
In 1987, the world signed the Montreal Protocol: the first global agreement to reduce the use of substances that deplete the ozone layer, known as ‘ozone-depleting substances.’
These are substances such as chlorofluorocarbons (CFCs); hydrochlorofluorocarbons (HFCs); and halon gases used in refrigerators, deodorants, and other industrial processes.
Since this agreement entered into force in 1989, global emissions of ozone-depleting substances have fallen by more than 99% as manufacturers have substituted them for less harmful alternatives.
This vast decline is shown in the chart.
What you should know about this data
- In some years, gasses can have negative consumption values. This occurs when gasses that were produced in previous years get destroyed. If the amount of gas that is destroyed in a given year is larger than the amount that is produced, then the consumption levels will be negative. National statistics can also show negative emissions when gasses are exported.

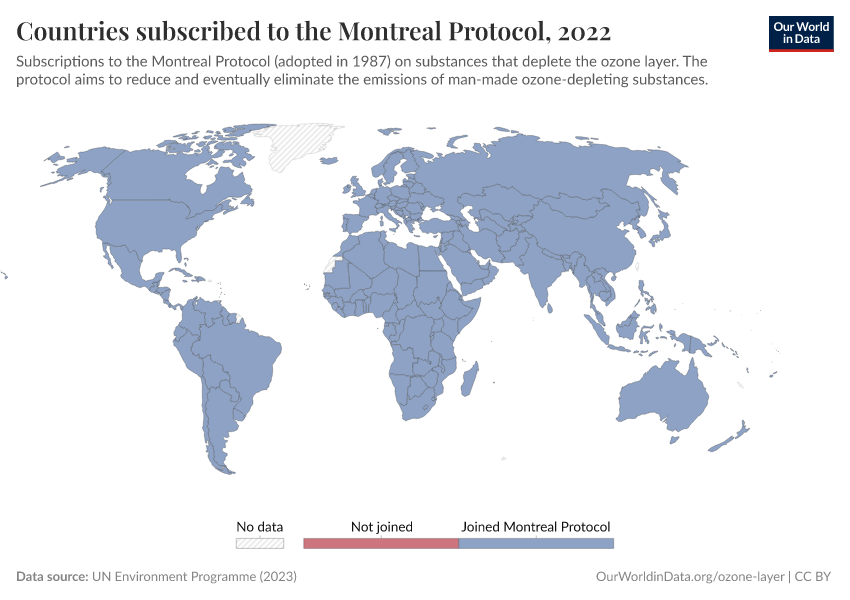
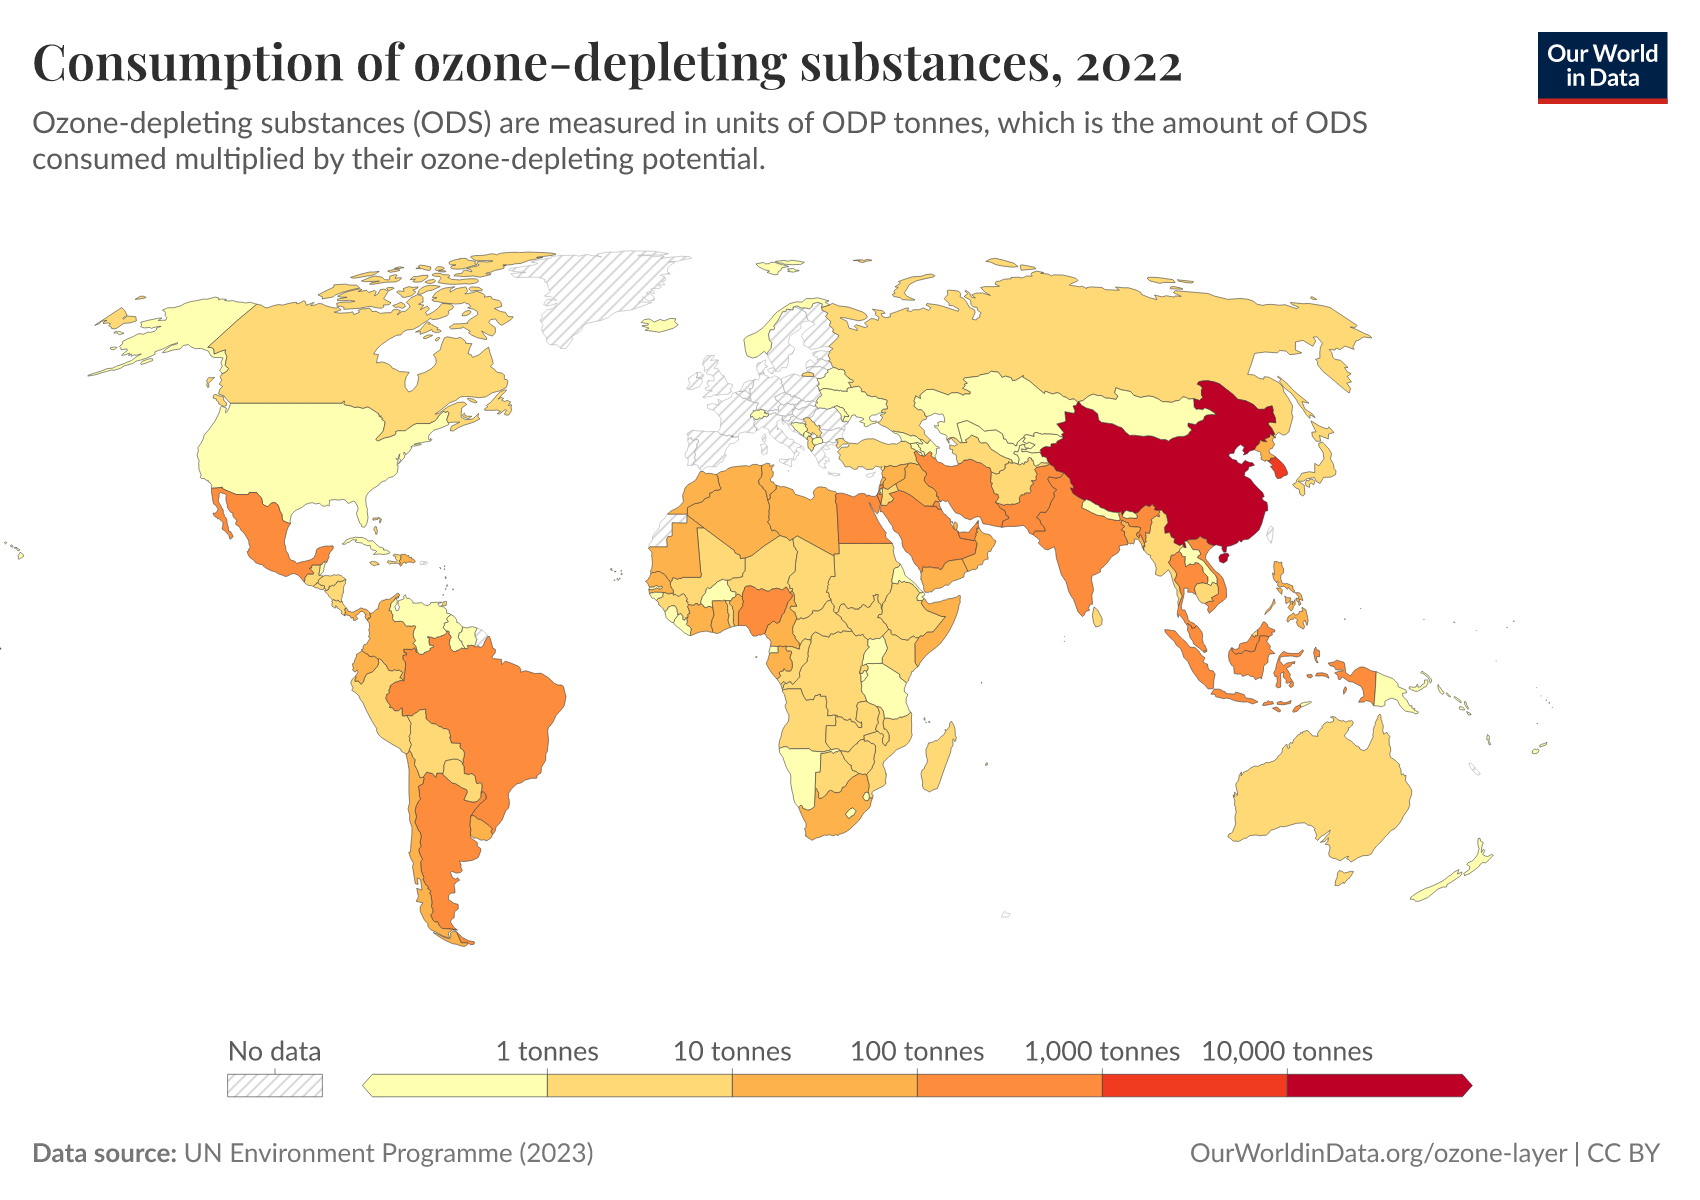
The Montreal Protocol is one of the most successful international agreements to date
The dramatic reduction in the emissions of ozone-depleting substances was only possible through international collaboration and agreements.
The Montreal Protocol on Substances that Deplete the Ozone Layer was first agreed upon in 1987 to reduce – and eventually eliminate – the use of man-made ozone-depleting substances to protect the ozone layer.
The timeline below the interactive map shows when countries signed the protocol to join this international agreement.
The Montreal Protocol was not an instant success in reducing emissions. It has undergone various amendments to increase ambition and reduction targets.
But these adjustments have come close to eliminating ozone-depleting substances, making it one of the most successful international agreements of any kind.

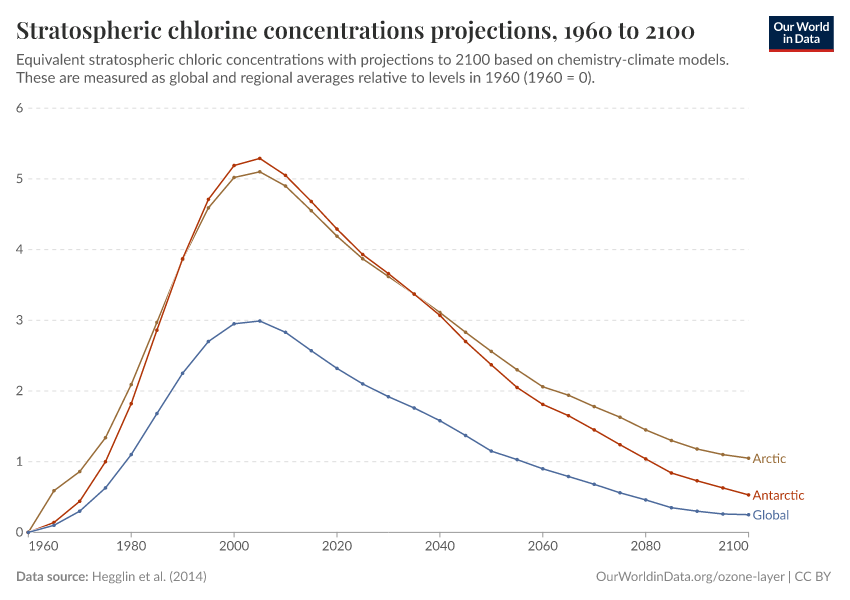
Increasing the ambition of the Montreal Protocol has been essential in protecting the ozone layer
International agreements been very successful in reducing emissions of ozone-depleting substances. But the initial targets of the Montreal Protocol from 1987 would have been insufficient to tackle the problem.
As we see in the visualization, the Montreal Protocol would have slowed emissions of depleting substances compared to a world with no protocol, but it wouldn’t have reduced the amount used.
The success came from subsequent revisions, which increased in ambition and reduction targets each time.
These projections based on the various revisions are shown in the chart. You can see that the 1992 amendment in Copenhagen was the first not only to slow the increase of emissions but to reduce them.
What you should know about this data
- This graphic and data is sourced from the 2018 update report from the Scientific Assessment of Ozone Depletion.1 The report is prepared and updated every four years by the Scientific Assessment Panel (SAP) of the Montreal Protocol on Substances that Deplete the Ozone Layer, formed by the UN Environment Programme in collaboration with the World Meteorological Organization and National Oceanic and Atmospheric Administration (NOAA).
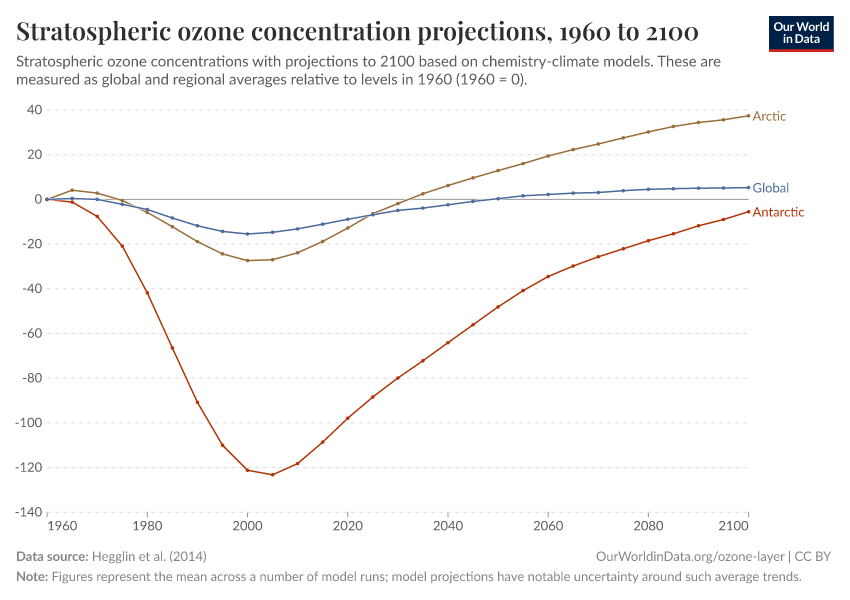
The amount of ozone in the stratosphere was disappearing rapidly but has stabilized since the late 1990s
As a result of human emissions of ozone-depleting substances, concentrations of ozone in the stratosphere – between 10 to 50 kilometers above the earth's surface – fell rapidly throughout the 1970s, ‘80s, and early ‘90s.
This is shown in the chart, where stratospheric ozone concentrations are measured in 'Dobson units.'
Concentrations in the South Hemisphere more than halved from 1979 to 1995.
However, as the world reduced its emissions of these depleting gasses, ozone concentrations stabilized from the 1990s. And in recent years, this has slowly started to rebuild again.
What you should know about this data
- This data comes from measurements in the Southern Hemisphere, at a latitude of 40°.
- This data is measured from satellite measurements, which are taken daily. The mean trend shows the average of these daily measurements for any given year. The minimum daily concentration is the lowest concentration recorded on any day across the year.
- Ozone concentrations are measured in ‘Dobson units’. If you were to take all the ozone in a column of air stretching from the earth's surface to space, and bring all that ozone to a temperature of 0°C and pressure of one atmosphere, the column would be about 0.3 centimeters thick. Thus, the total ozone would be 0.3 atm-cm. To make the units easier to work with, the “Dobson Unit” is defined to be 0.001 atm-cm. So, our 0.3 atm-cm would be 300 DU.
- Ozone concentrations, and the ozone hole's size, are affected by sunlight, temperature, and emissions of depleting substances. This means the size of the hole can vary from year-to-year and vary across the year.

The ozone hole over the Antarctic grew rapidly until it stopped growing around the year 2000
As ozone concentrations in the stratosphere declined throughout the 1970s, ‘80s, and ‘90s, a hole over Antarctica opened up.
You can see the first photograph taken of the Antarctic ozone hole in 1985 on the NASA website.
We can see the growth of the ozone hole in the chart. By the 1990s, it had expanded to 25 million square kilometers (km2). That’s an area larger than Russia, which has an area of 16 million km2.
The ozone hole stopped expanding around the year 2000. This happened because emissions of ozone-depleting substances fell dramatically, and ozone concentrations stopped declining.
The ozone hole is now starting to close. But it will take many more decades for it to recover fully.2
What you should know about this data
- Ozone concentrations, and the ozone hole's size, are affected by sunlight, temperature, and emissions of depleting substances. This means the size of the hole can vary from year-to-year and vary across the year.
- The ozone hole tends to be largest in the Southern Hemisphere Spring – around October.
- This data is measured from satellite measurements, which are taken daily. The mean trend shows the average of these daily measurements for any given year. The maximum trend is the highest ozone hole area recorded on any day across the year.

Research & Writing
Key Charts on Ozone Layer
See all charts on this topic


Featured Data on Ozone Layer
Endnotes
Ross J. Salawitch (Lead Author), David W. Fahey, Michaela I. Hegglin, Laura A. McBride, Walter R. Tribett, Sarah J. Doherty, Twenty Questions and Answers About the Ozone Layer: 2018 Update, Scientific Assessment of Ozone Depletion: 2018, 84 pp., World Meteorological Organization, Geneva, Switzerland, 2019.
Strahan, S. E., & Douglass, A. R. (2018). Decline in Antarctic ozone depletion and lower stratospheric chlorine determined from Aura Microwave Limb Sounder observations. Geophysical Research Letters, 45(1), 382-390.
Hegglin, M. I. et al. (2015). Twenty Questions and Answers about the Ozone Layer 2014 Update: Scientific Assessment of Ozone Depletion 2014. World Meteorological Organisation.
Cite this work
Our articles and data visualizations rely on work from many different people and organizations. When citing this topic page, please also cite the underlying data sources. This topic page can be cited as:
Hannah Ritchie, Lucas Rodés-Guirao, and Max Roser (2023) - “Ozone Layer” Published online at OurWorldinData.org. Retrieved from: 'https://ourworldindata.org/ozone-layer' [Online Resource]BibTeX citation
@article{owid-ozone-layer,
    author = {Hannah Ritchie and Lucas Rodés-Guirao and Max Roser},
    title = {Ozone Layer},
    journal = {Our World in Data},
    year = {2023},
    note = {https://ourworldindata.org/ozone-layer}
}
Reuse this work freely
All visualizations, data, and articles produced by Our World in Data are completely open access under the Creative Commons BY license. You have the permission to use, distribute, and reproduce these in any medium, provided the source and authors are credited.
The data produced by third parties and made available by Our World in Data is subject to the license terms from the original third-party authors. We will always indicate the original source of the data in our documentation, so you should always check the license of any such third-party data before use and redistribution.
All of our charts can be embedded in any site.