HIV / AIDS
A global epidemic and the leading cause of death in some countries.
This page was first published in November 2014. We made minor changes to the text in December 2023.
Infection with HIV (human immunodeficiency virus) can lead to AIDS (acquired immunodeficiency syndrome). AIDS results in a gradual and persistent decline and failure of the immune system, resulting in a heightened risk of life-threatening infection and cancers.
In the majority of cases, HIV is a sexually transmitted infection. However, HIV can also be transmitted from mother to child, during pregnancy or childbirth, or through breastfeeding. Non-sexual transmission can also occur by sharing injection equipment such as needles.
Other research and writing on HIV/AIDS on Our World in Data:
See all interactive charts on HIV/AIDS ↓
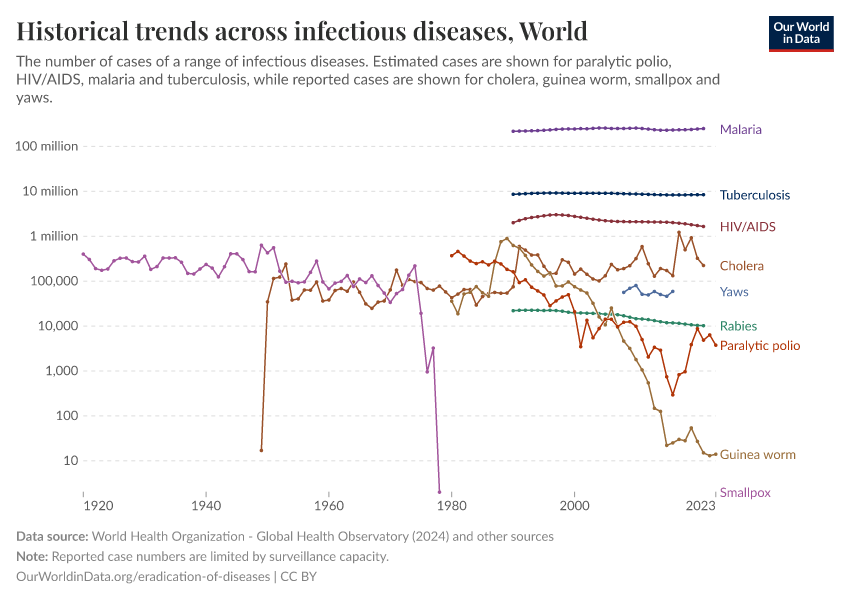
HIV/AIDS is one of the world's most fatal infectious disease
More than three-quarters of a million people die from HIV/AIDS each year; in some countries, it's the leading cause of death
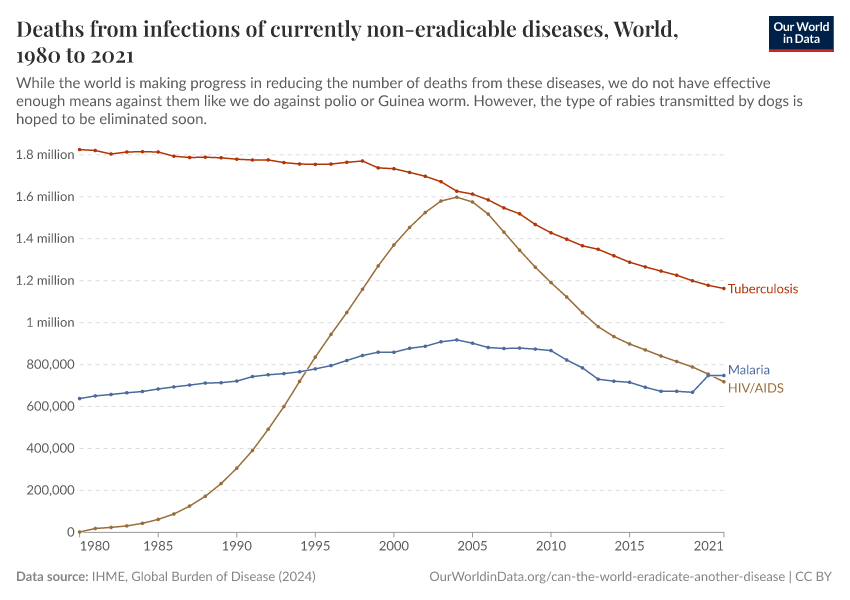
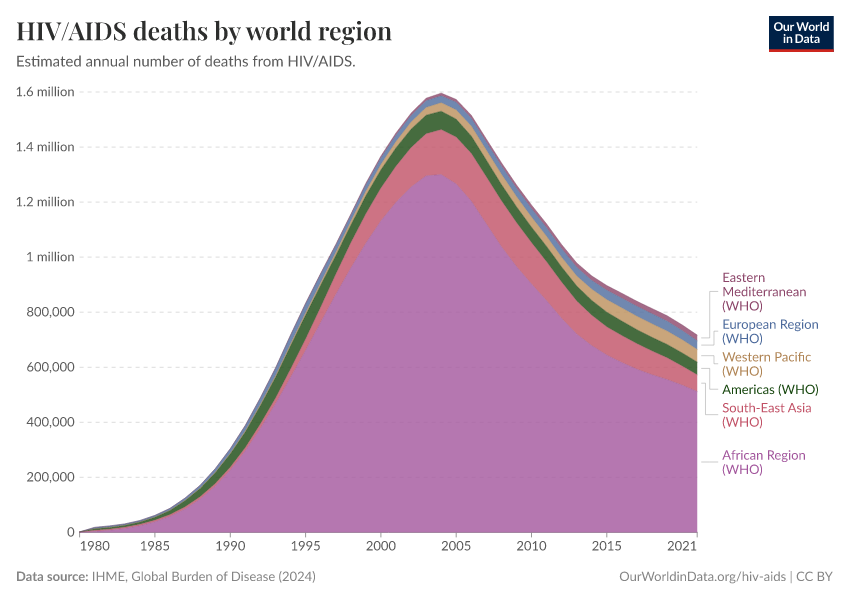
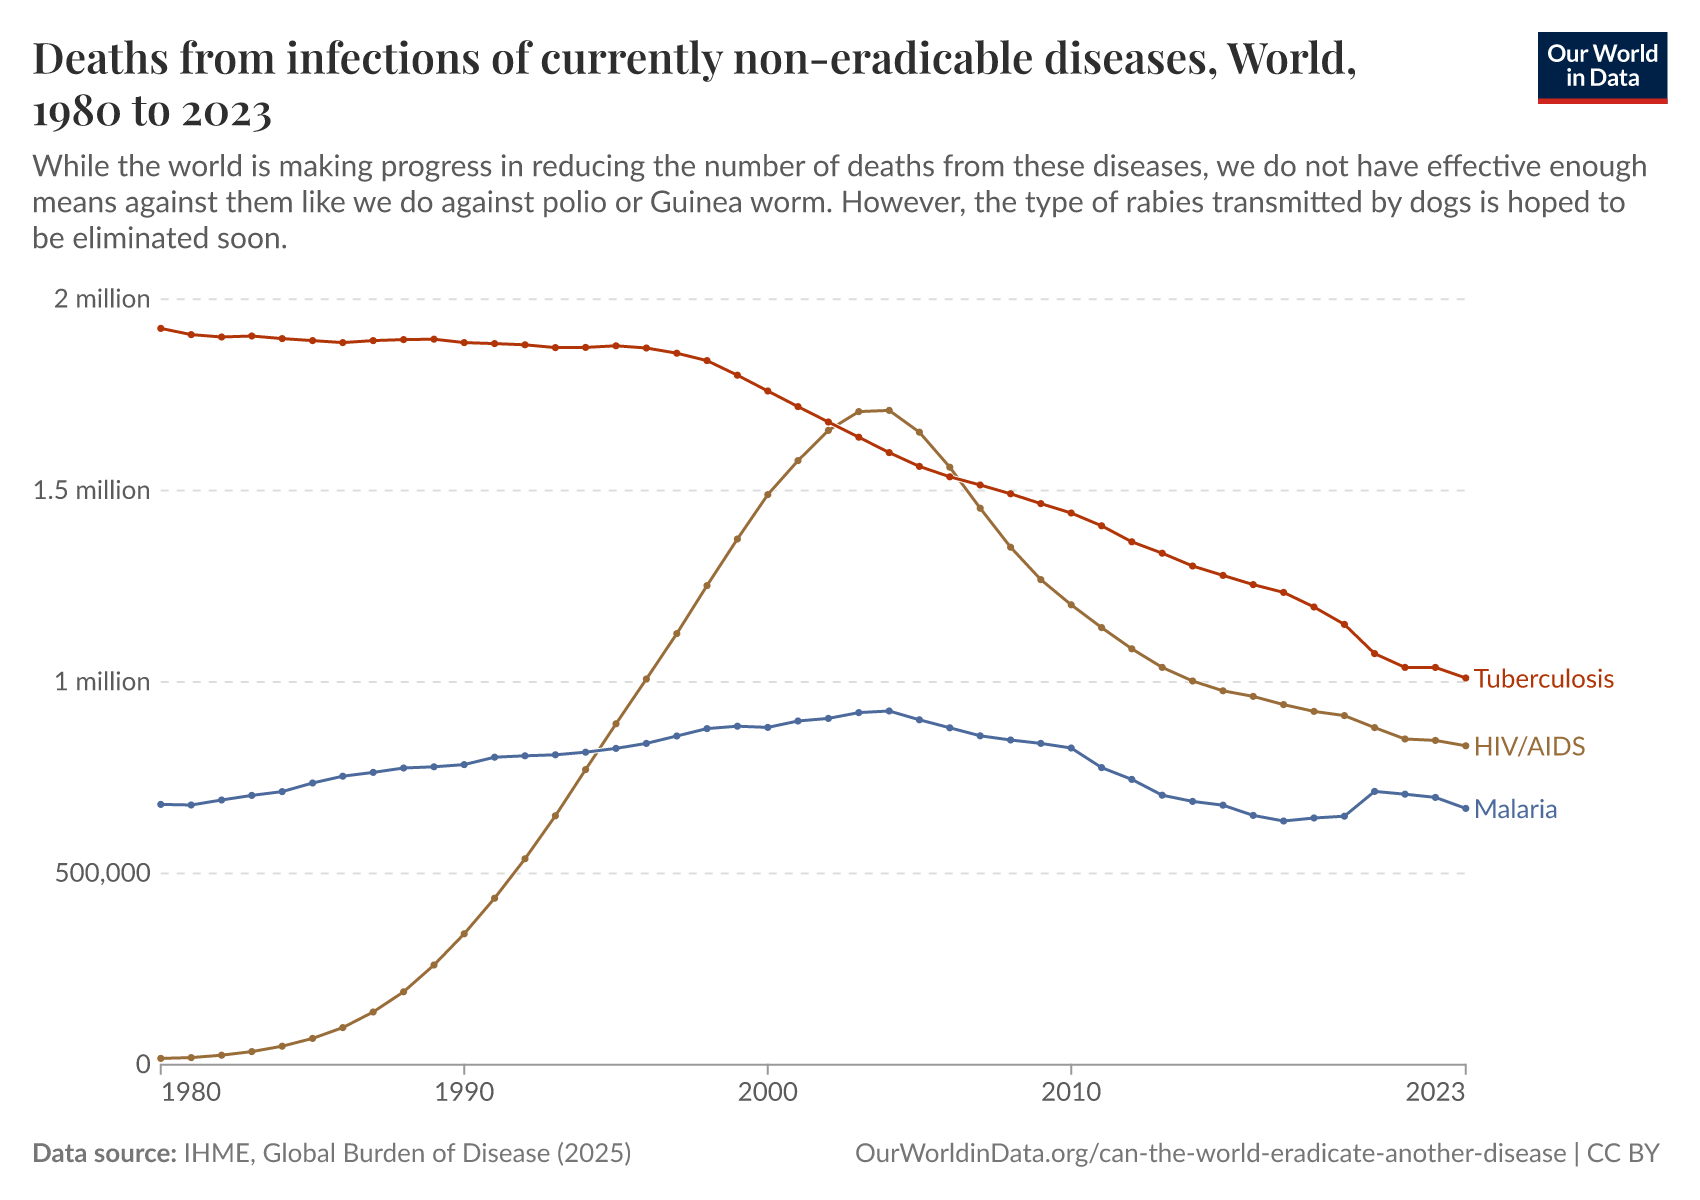
HIV/AIDS is one of the world's most fatal infectious diseases – particularly across Sub-Saharan Africa, where the disease has had a massive impact on health outcomes and life expectancy in recent decades.
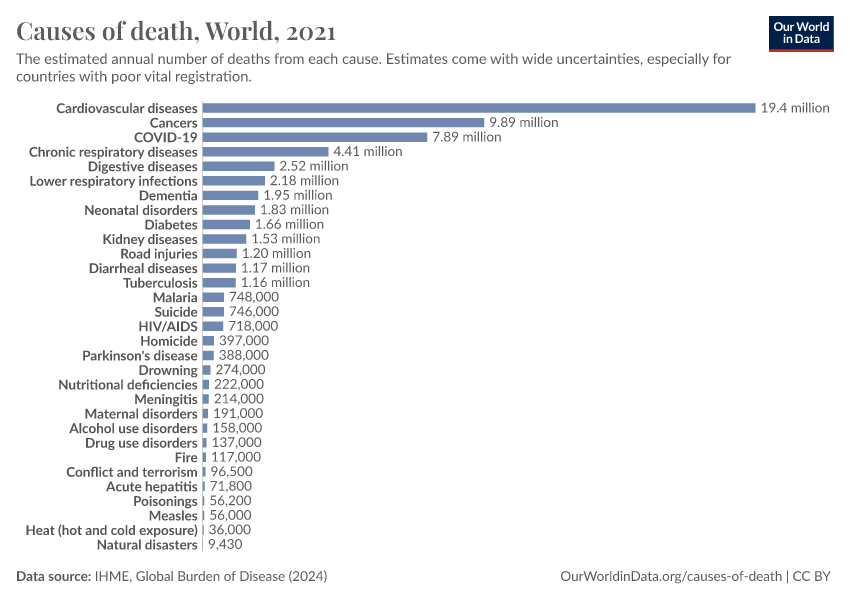
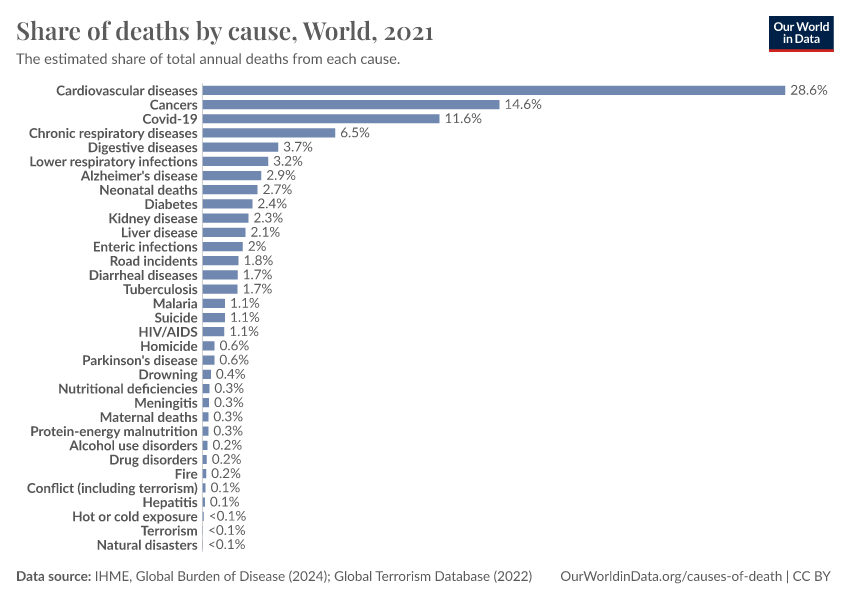
The Global Burden of Disease is a major global study on the causes of death and disease published in the medical journal The Lancet.1 These estimates of the annual number of deaths by cause are shown here. This chart shows the global total but can be explored for any country or region using the "Change country" button.

According to the Global Burden of Disease study, nearly a million people die yearly from HIV/AIDS. To put this into context: this is just over 50% higher than the number of deaths from malaria. It's one of the largest killers globally, but for some countries – particularly across Sub-Saharan Africa, it's the leading cause of death.
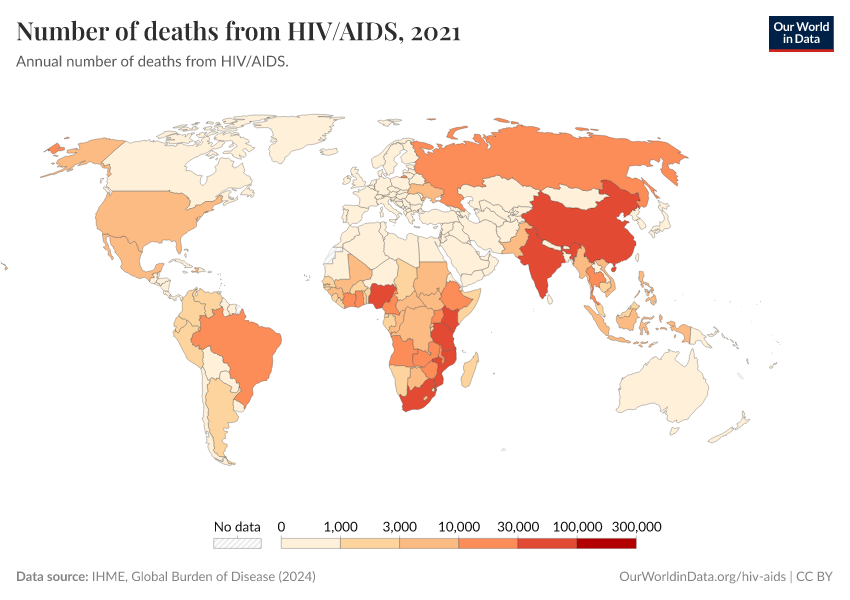
The global distribution of deaths from HIV/AIDS
In some countries, HIV/AIDS is the cause of a quarter of all deaths
Globally, around 1.5% of deaths are caused by HIV/AIDS.
This share is high but masks the wide variations in the toll of HIV/AIDS worldwide. In some countries, this share was much higher.
On this interactive map, we see the share of deaths that resulted from HIV/AIDS across the world. Across most regions, the share was low: across Europe, for example, it accounted for less than 0.1% of deaths.
However, the share is very high across some countries – focused primarily in Southern Sub-Saharan Africa.

Death rates are high across Sub-Saharan Africa
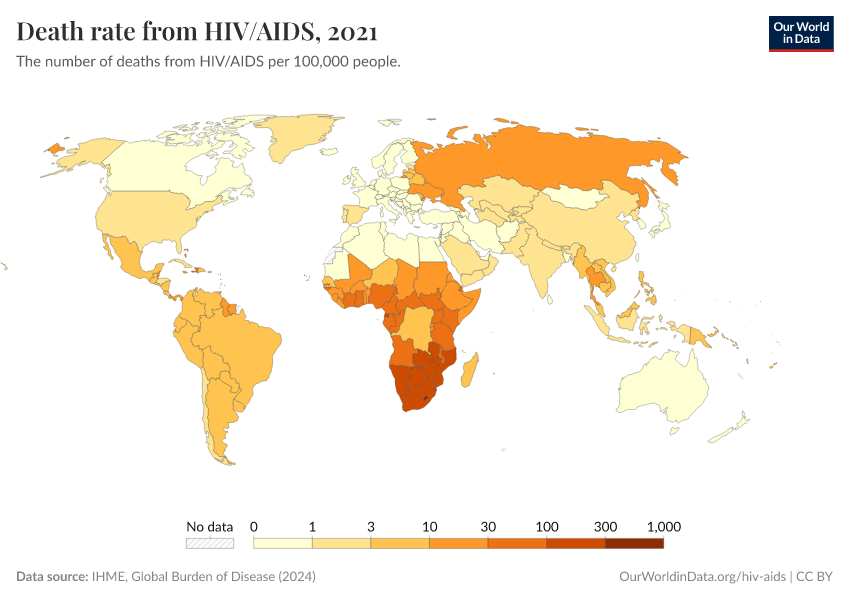
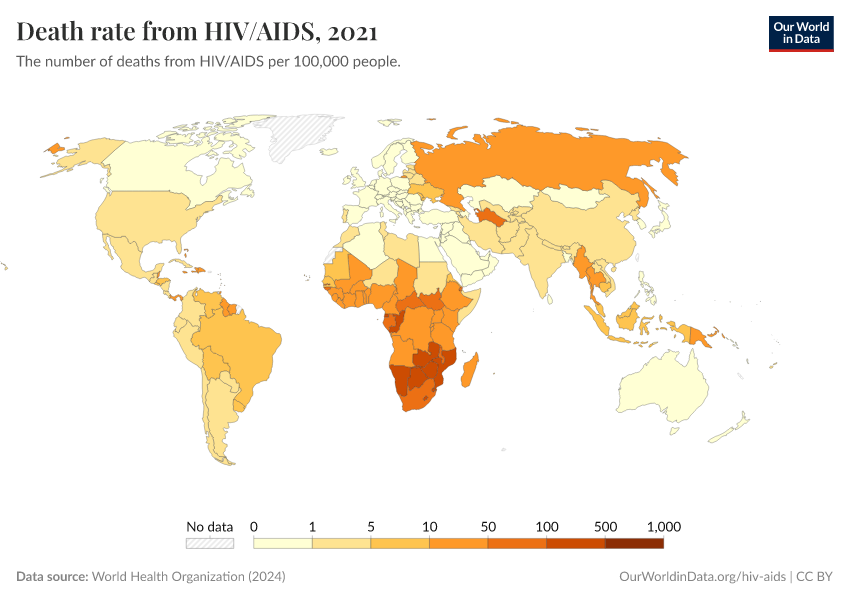
The significant health burden of HIV/AIDS across Sub-Saharan Africa is also reflected in death rates. Death rates measure the number of deaths from HIV/AIDS per 100,000 individuals in a country or region.
In the interactive map, we see the distribution of death rates worldwide. Most countries have a rate of less than 10 deaths per 100,000 – often much lower, below 5 per 100,000. Across Europe, the death rate is less than one per 100,000.
Across Sub-Saharan Africa, the rates are much higher. Some countries in the South of the region have rates greater than 100 per 100,000.

Death rates are highest for younger adults and children under five years old
Which population groups are most at risk from HIV/AIDS?
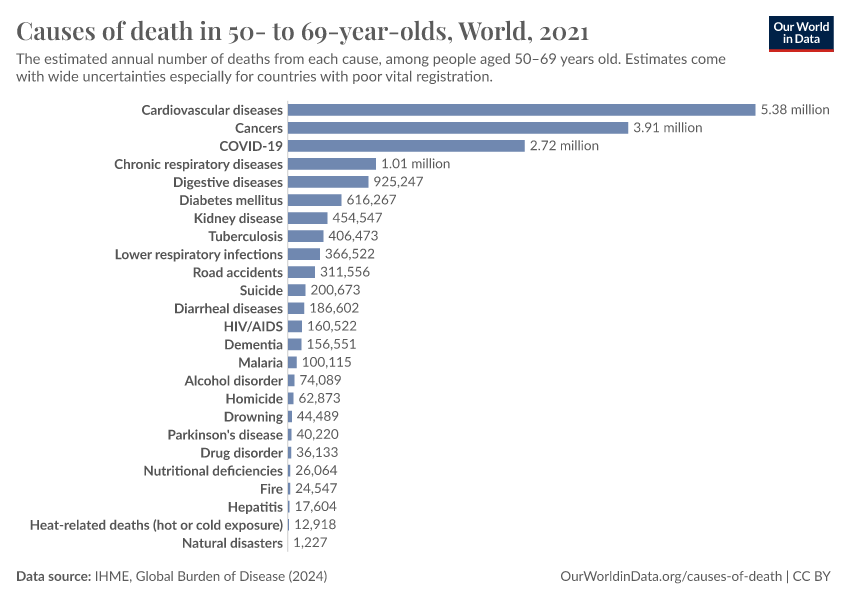
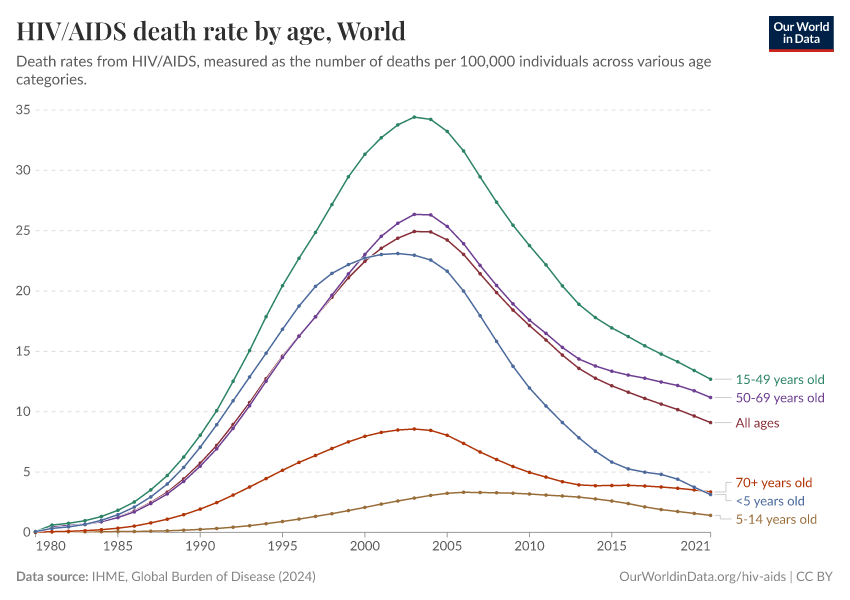
In the chart, we show death rates by age group. Here we see that the most at-risk group is younger adults (15 to 49-year-olds). Since HIV is primarily a sexually transmitted infection, where unsafe sex is a primary risk factor, this is what we would expect.
But we also see that death rates are higher for children under five; that’s because HIV can be transmitted from mother to child if the mother is infected.

Is the world making progress in its fight against HIV/AIDS?
How have cases and deaths changed over time?
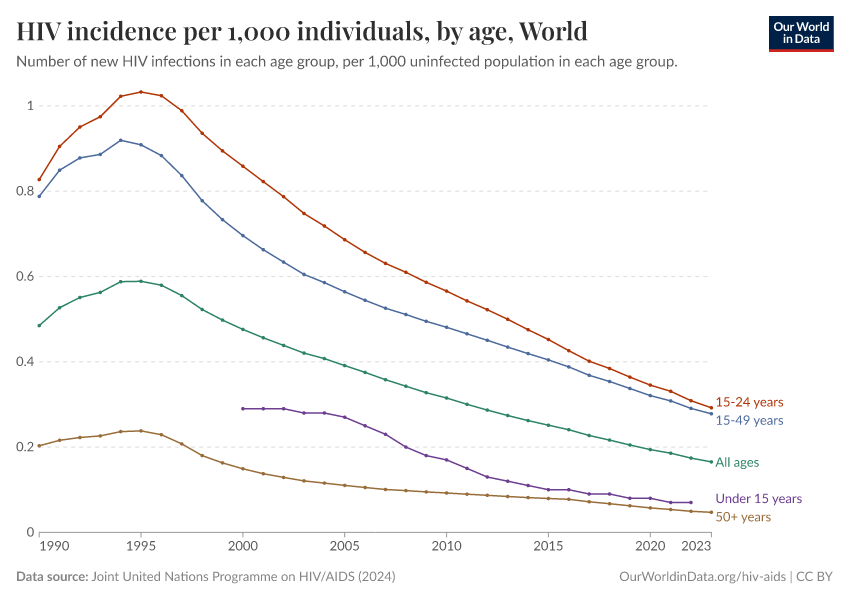
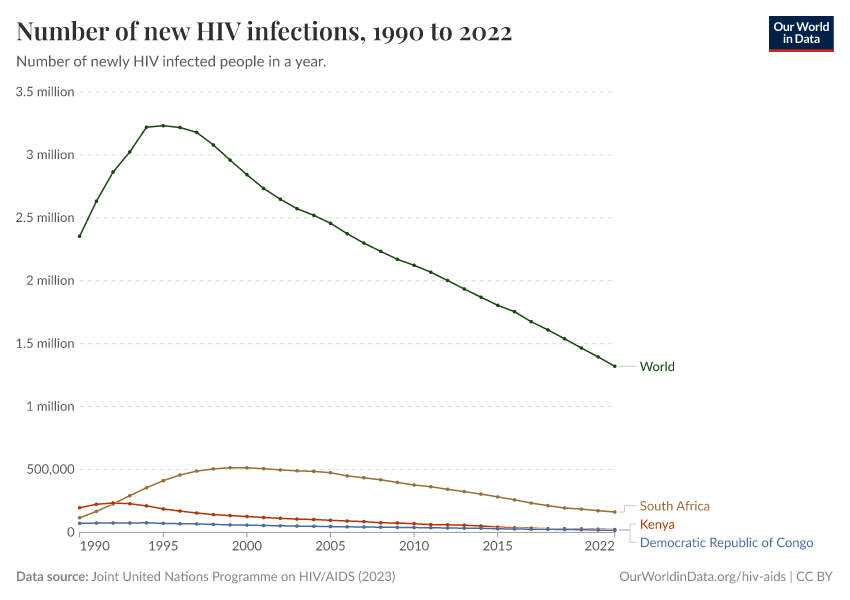
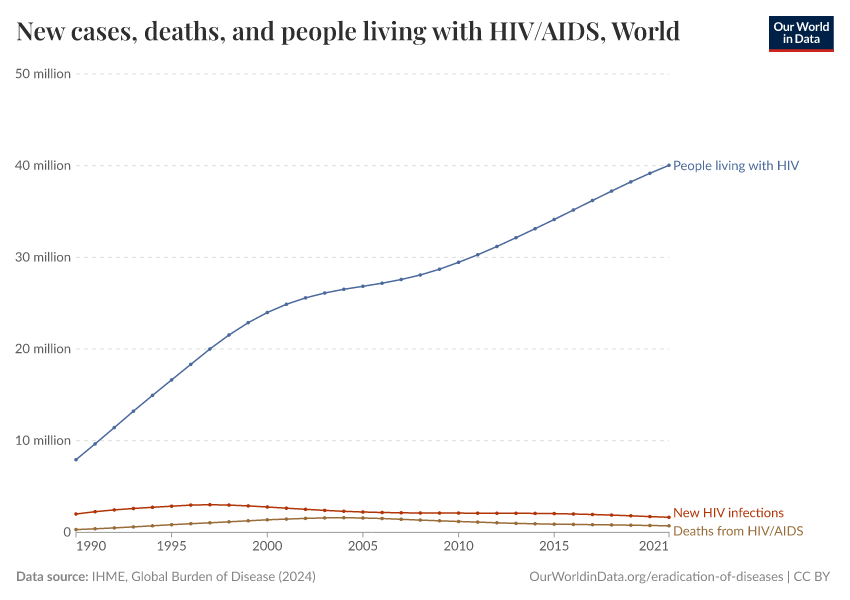
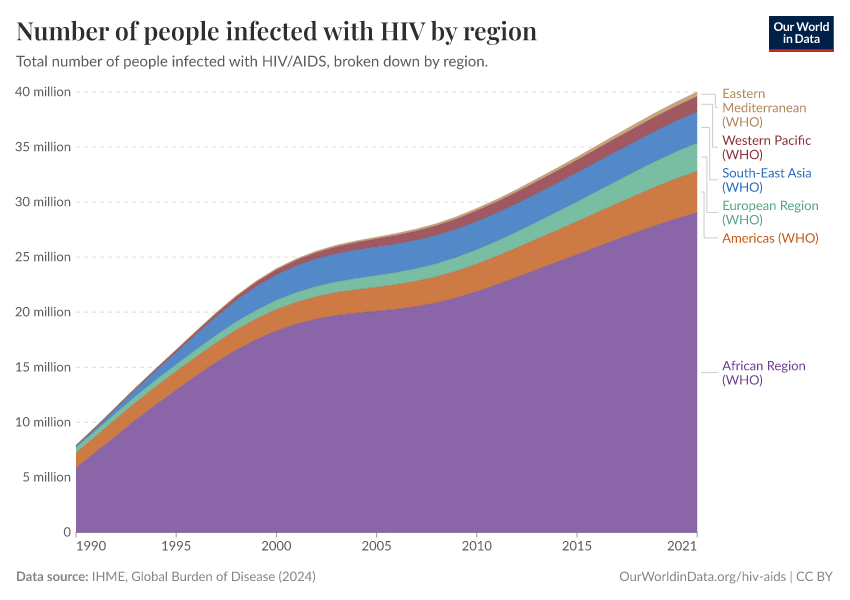
The 1990s saw a substantial increase in people infected with HIV and dying of AIDS.
In the second half of that decade, over 3 million people were infected with HIV yearly. Since then, the number of new infections began to decline, and it's now below 2 million, the lowest number of new infections since 1990.
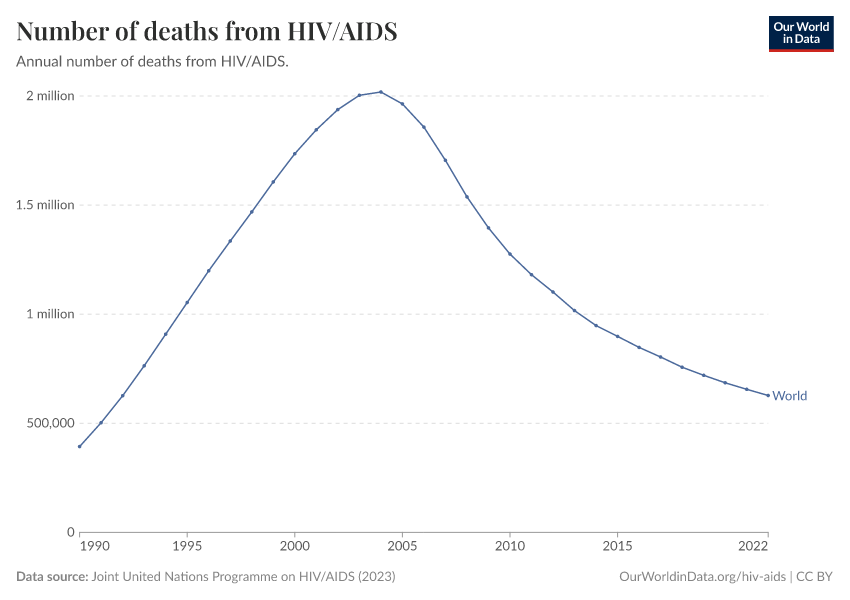
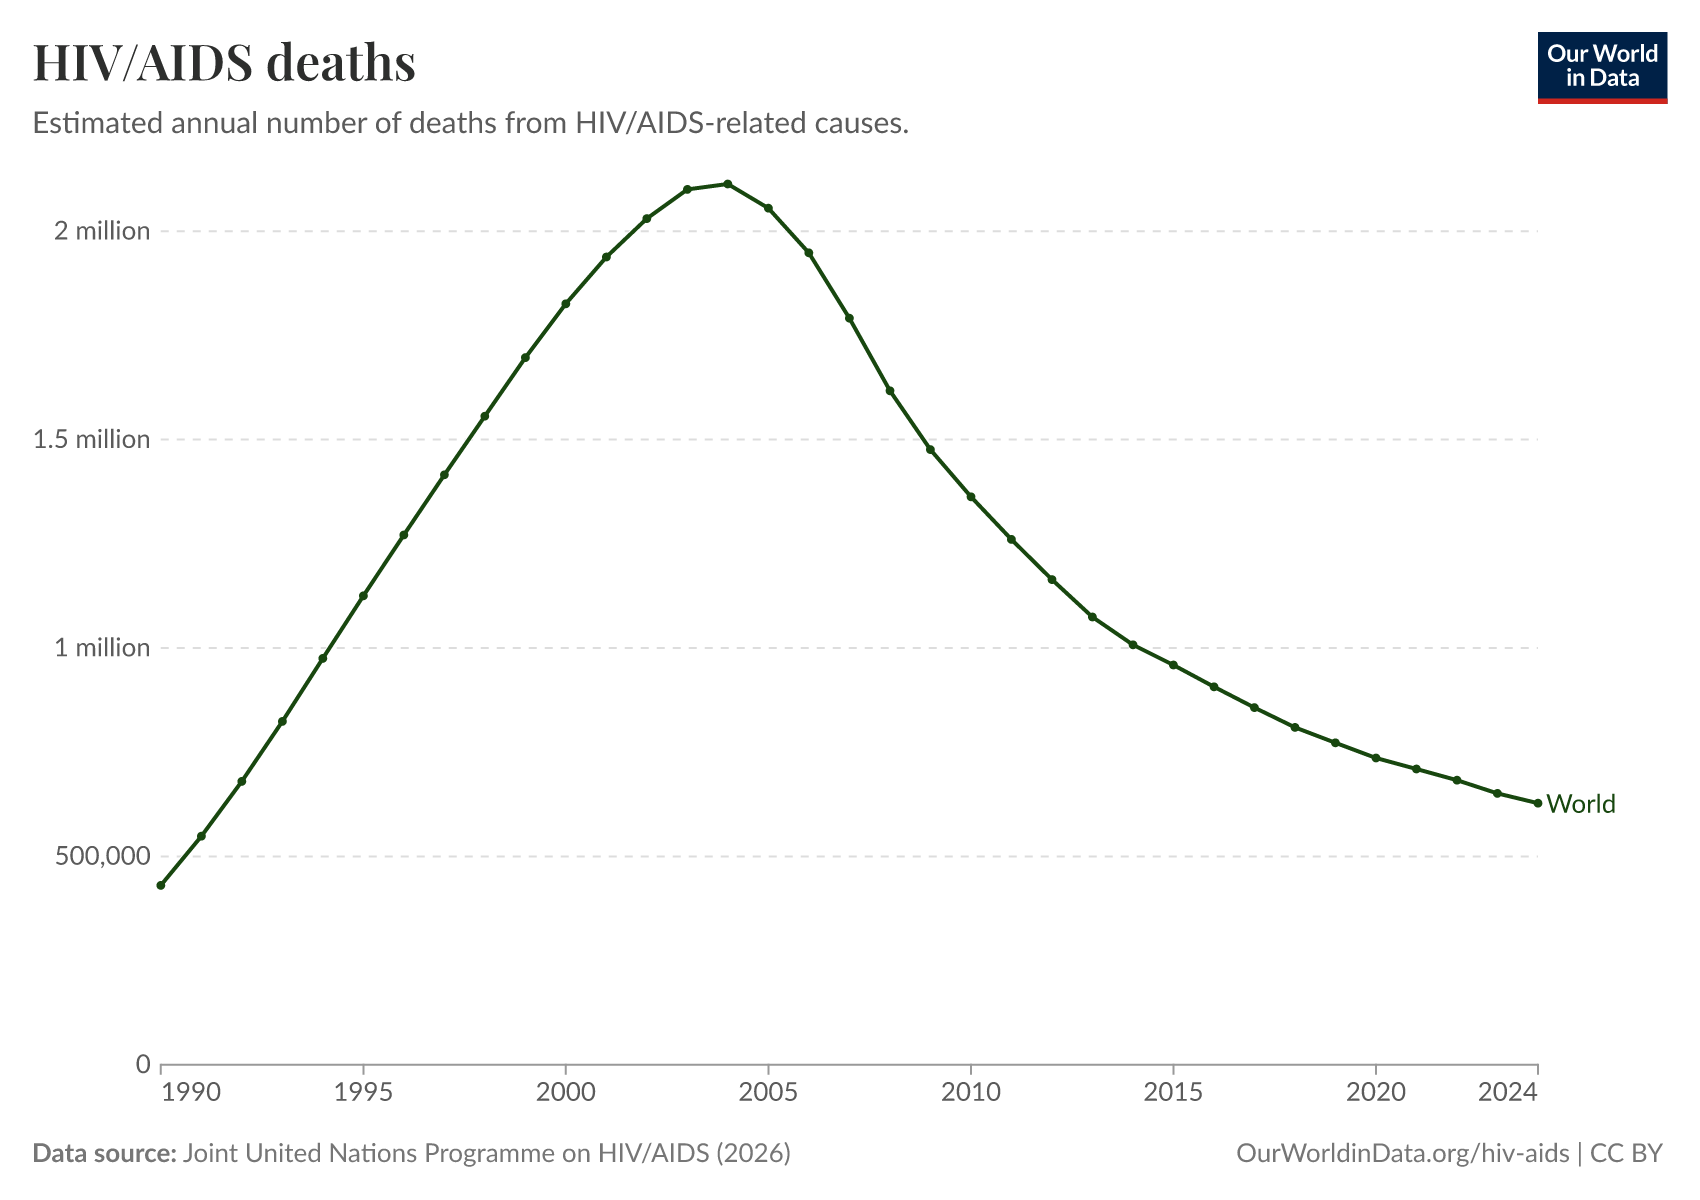
As for mortality, AIDS-related deaths increased throughout the 1990s and peaked in the mid-2000s, with nearly 2 million annual deaths. Since then, the annual number of deaths from AIDS has declined and since halved. 2016 was the first year since the peak in which fewer than 1 million people died from AIDS.
The chart also shows the continuing increase in the number of people living with HIV. The growth rate has slowed compared to the 1990s, but the absolute number is at the highest ever.

Global deaths from HIV/AIDS halved within a decade
The world has made significant progress against HIV/AIDS. Global deaths from AIDS have halved over the past decade.
In the visualization, we see the global number of deaths from HIV/AIDS in recent decades – this is shown by age group. In the mid-2000s, global deaths peaked at almost 2 million per year.
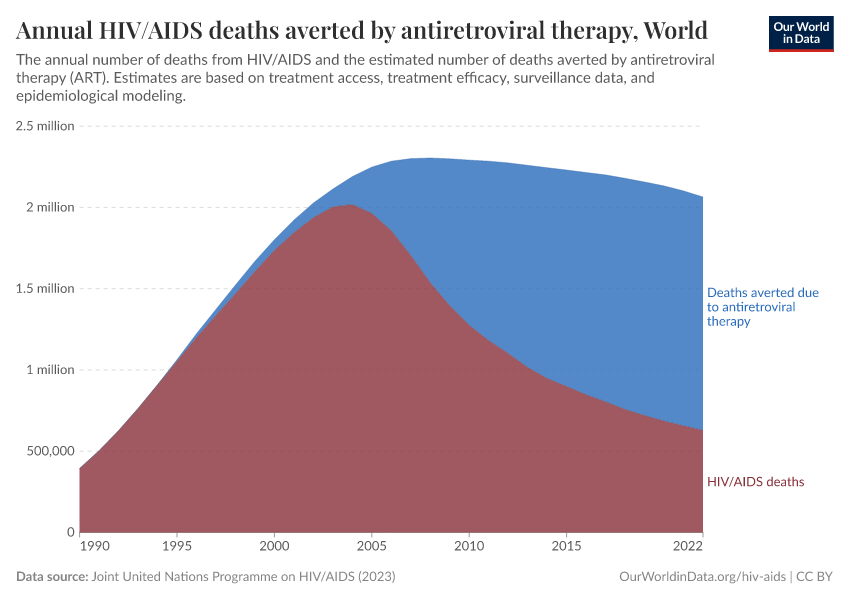
Driven mainly by the development and availability of antiretroviral therapy (ART), global deaths have more than halved since then.
You can explore this change for any country or region using the "Edit countries" button on the interactive chart.

HIV/AIDS once accounted for a large share of deaths in some countries, but rates are now falling
Global progress on HIV/AIDS has been driven by significant improvements in the countries most affected by the epidemic.
Today, the share of deaths remains high: more than 1 in 5 deaths in some countries are caused by HIV/AIDS. But in the past, this share was even higher.
In the visualization, we see the change in the share of deaths from HIV/AIDS over time. From the 1990s through to the early 2000s, it was the cause of more than 1 in 3 deaths in several countries and even more than half of annual deaths in the late 1990s in Zimbabwe.
Over the past decade, this share has fallen as antiretroviral treatment has become more widely available.

HIV/AIDS has had a significant impact on life expectancy across Sub-Saharan Africa
The health and mortality burden of HIV/AIDS across Sub-Saharan Africa has been considerable. We see this impact on health reflected in trends in life expectancy. In the visualization, we show changes in life expectancy across select countries in Sub-Saharan Africa for which HIV/AIDS has had the most significant toll.
We see a dramatic drop in life expectancy starting around 1990, coinciding with the rise of HIV. In Botswana, life expectancy fell by a decade; in Eswatini, it fell by two decades. Since the early 2000s — as progress has been made in tackling HIV — we see that life expectancy has been rising again.
In some countries, life expectancy is higher than before the epidemic began.

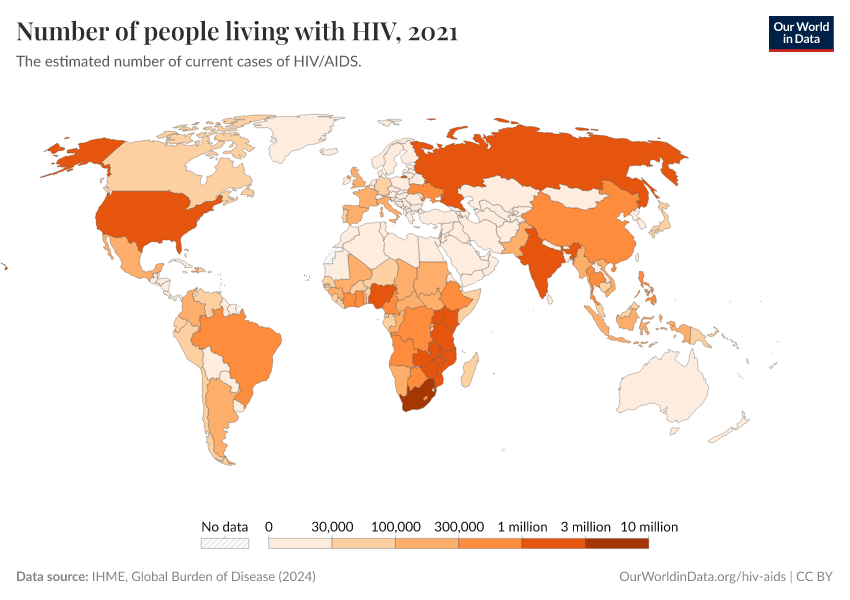
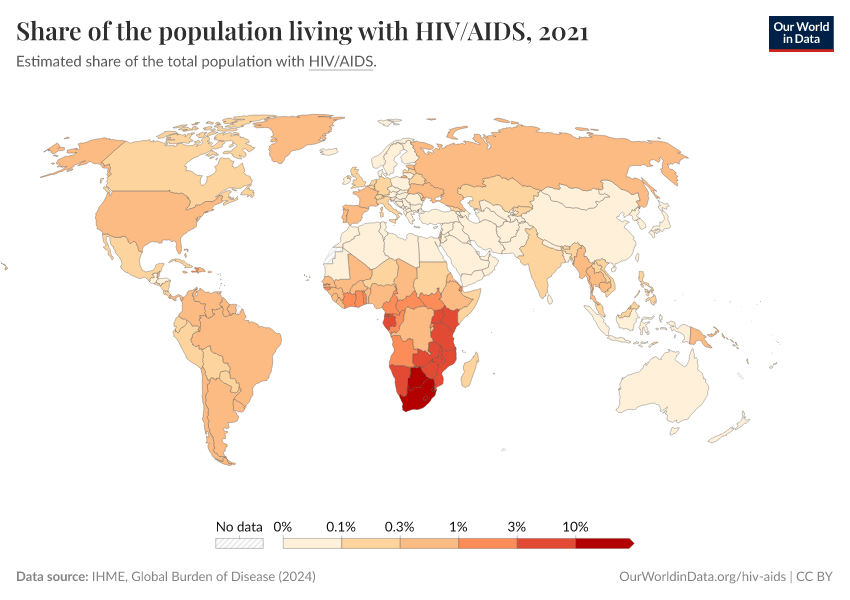
The prevalence of HIV/AIDS
Prevalence in the total population
Share of the population with HIV
You can explore the total number of people living with HIV/AIDS worldwide here.

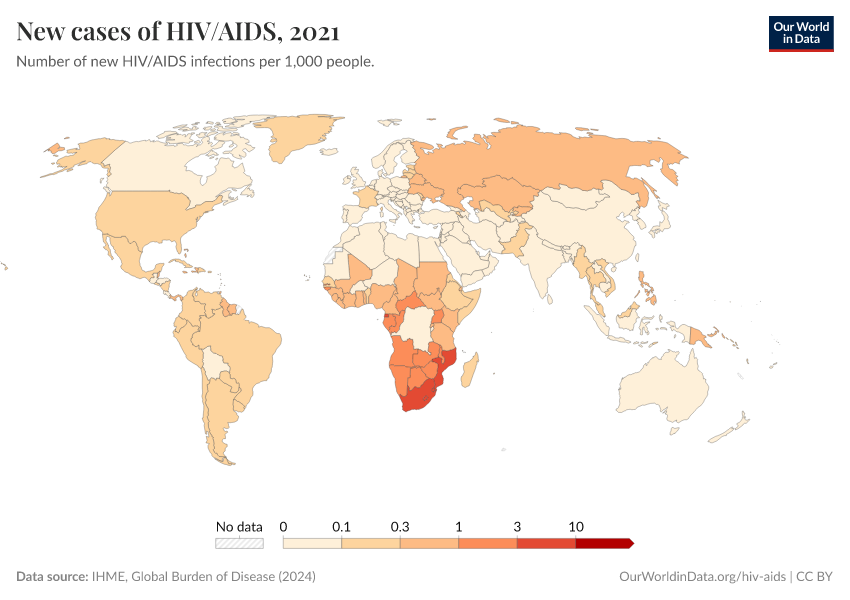
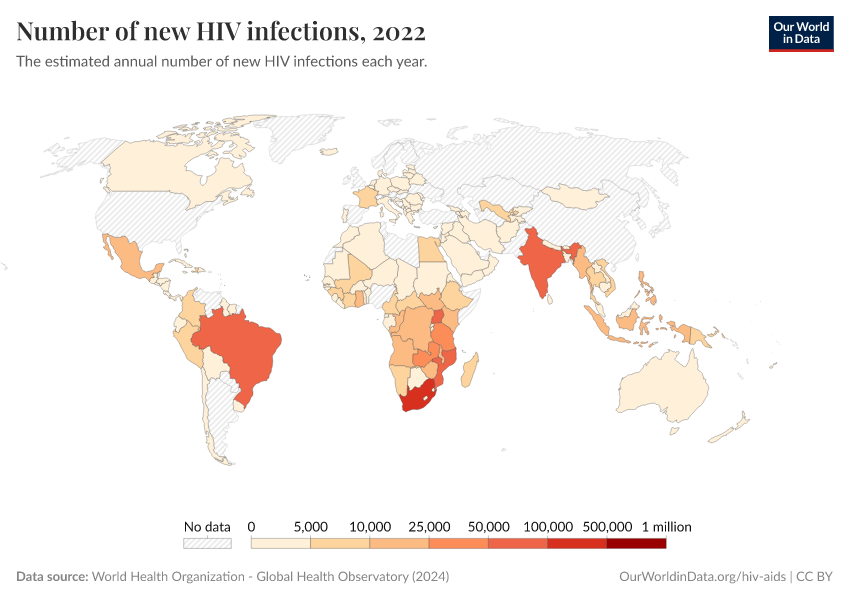
Number of new infections each year

Prevalence by gender
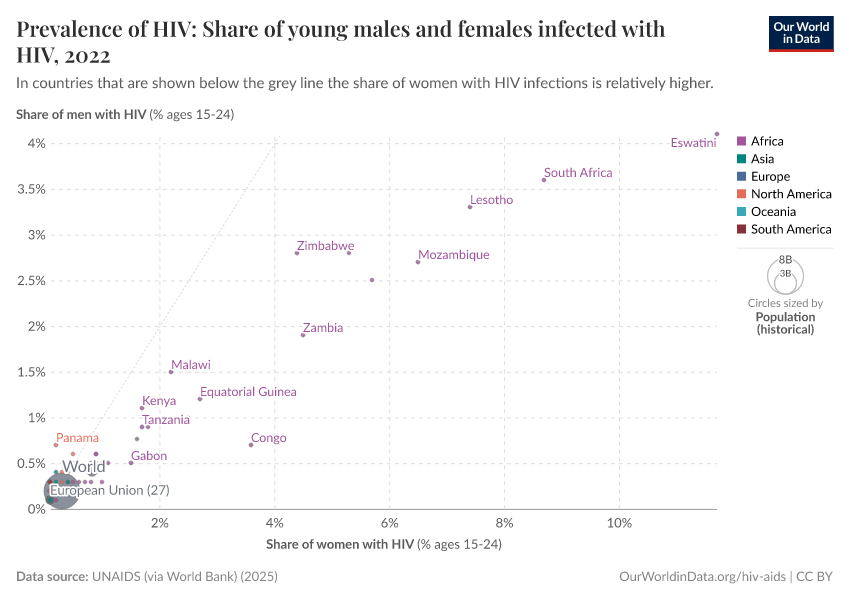
Is HIV/AIDS more common in men or women?
There are differences in the prevalence of HIV and death rates from AIDS between men and women. The chart shows the share of women in populations living with HIV.
As we see, HIV prevalence tends to be higher in women across Sub-Saharan Africa, although higher in males across most other regions. The trend in AIDS-related deaths shows the opposite: more men tend to die from AIDS every year than women. The reasons for differences in prevalence and death rates are complex; however, across Sub-Saharan Africa, women tend to be infected with HIV earlier than men and survive longer (explaining both the higher prevalence and lower annual AIDS deaths in women). Several gender inequality and social norm issues result in a higher prevalence of HIV in females across many countries; women are at greater risk when they have a limited role in sexual decision-making and protection, lower rates of sexual education, and higher rates of transactional sex2.

Prevalence in children
Children living with HIV
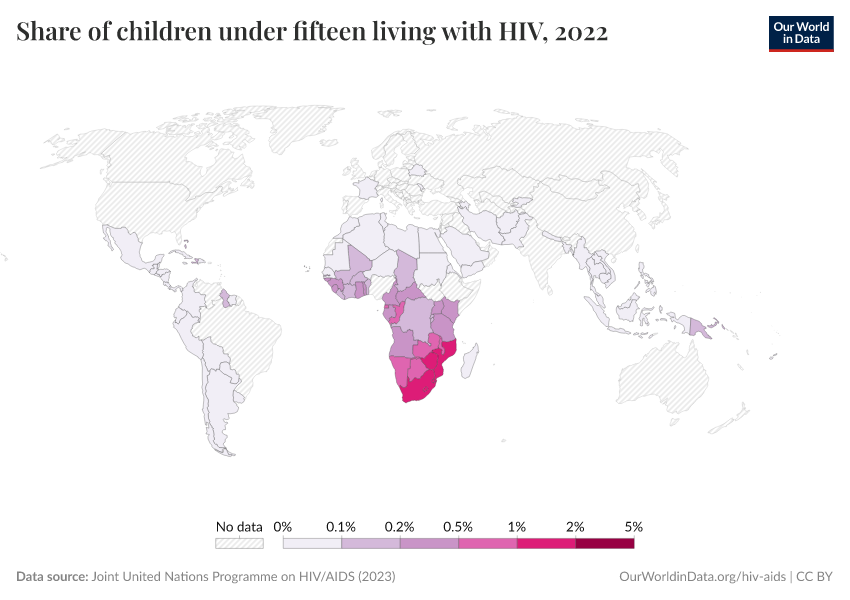
When children are infected with HIV, transmission has typically occurred from the mother either during pregnancy or childbirth or through breastfeeding. This is called mother-to-child-transmission, or MTCT. This map shows the total number of children aged 14 and under living with HIV. Globally the number of children living with HIV peaked in 2005 at approximately 2.6 million.

New HIV infections in children
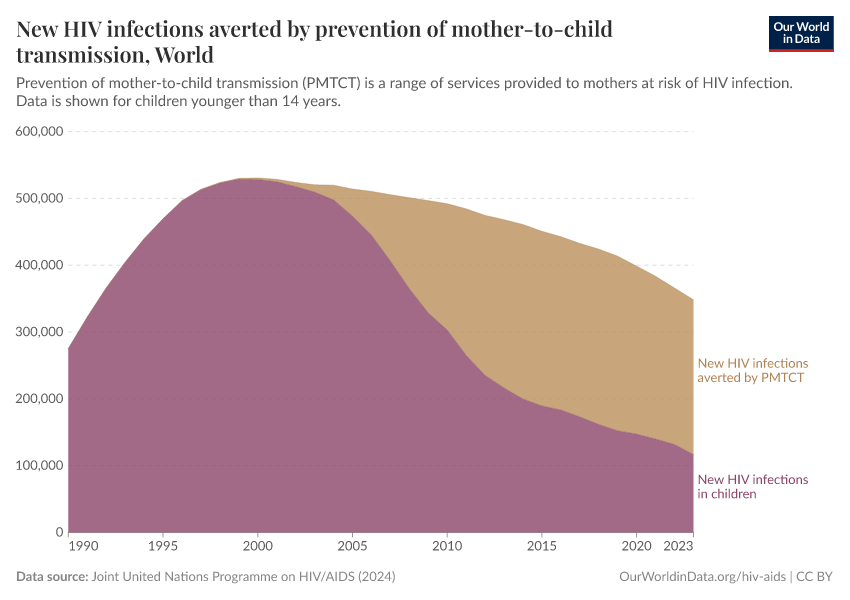
The map shows the total number of children newly infected with HIV yearly. Globally — with similar trends at national levels — the number of new infections in children peaked around the early 2000s (with over 500,000 new infections per year globally), followed by a rapid decline over the last decade.

Children orphaned from AIDS
Some children have lost either one or both parents to AIDS. This does not necessarily imply that children orphaned by AIDS have HIV themselves (although, in some cases, HIV has been transmitted from mother to child). The chart shows the number of children (aged 17 and under) orphaned from AIDS deaths.

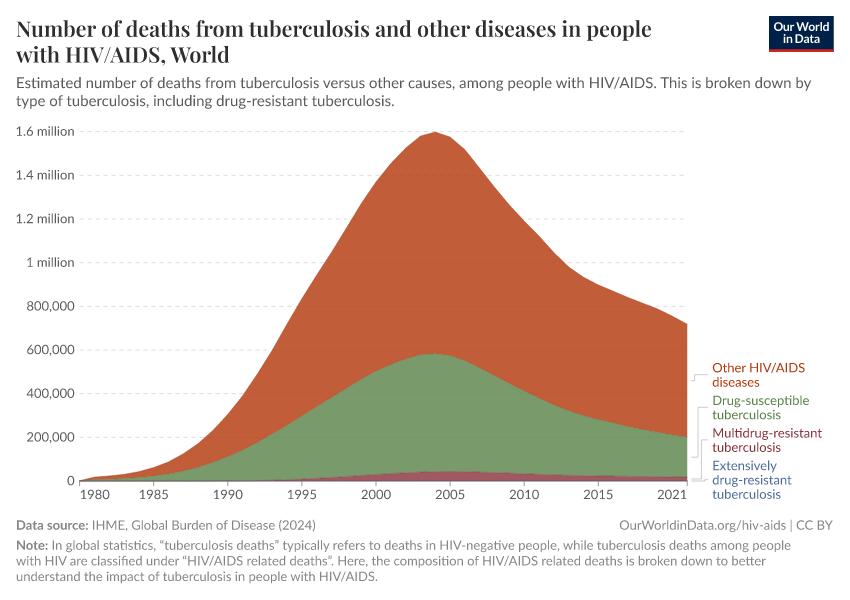
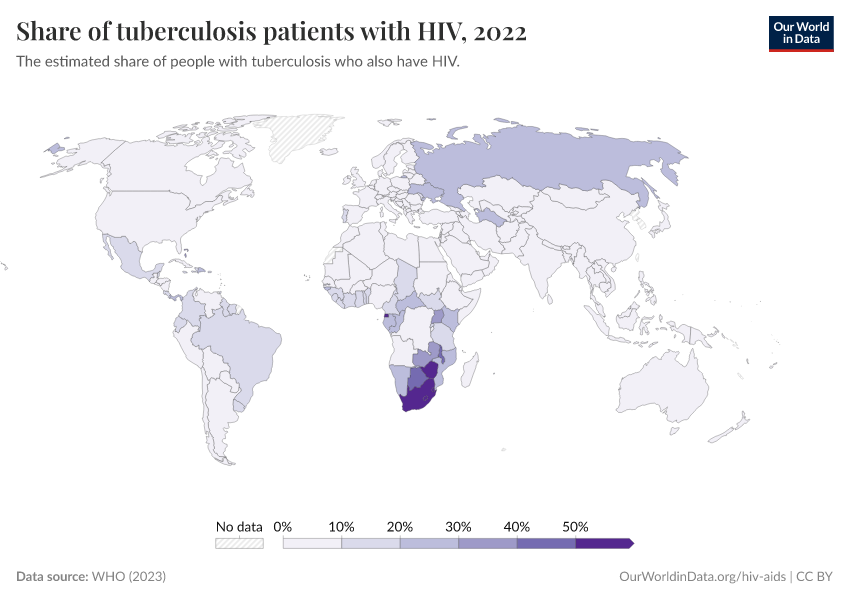
Tuberculosis among people living with HIV
Tuberculosis (TB) is the leading HIV-associated opportunistic infection in low- and middle-income countries, and it is a leading cause of death globally among people living with HIV. Death due to tuberculosis remains high among people living with HIV. However, the number of deaths is decreasing. Most of the global mortality due to TB among those with HIV is from cases in Sub-Saharan Africa.
The charts here show the number of TB patients who tested positive for HIV, the number receiving antiretroviral therapy, and the number of TB-related deaths among those living with HIV.


What can be done to prevent HIV/AIDS?
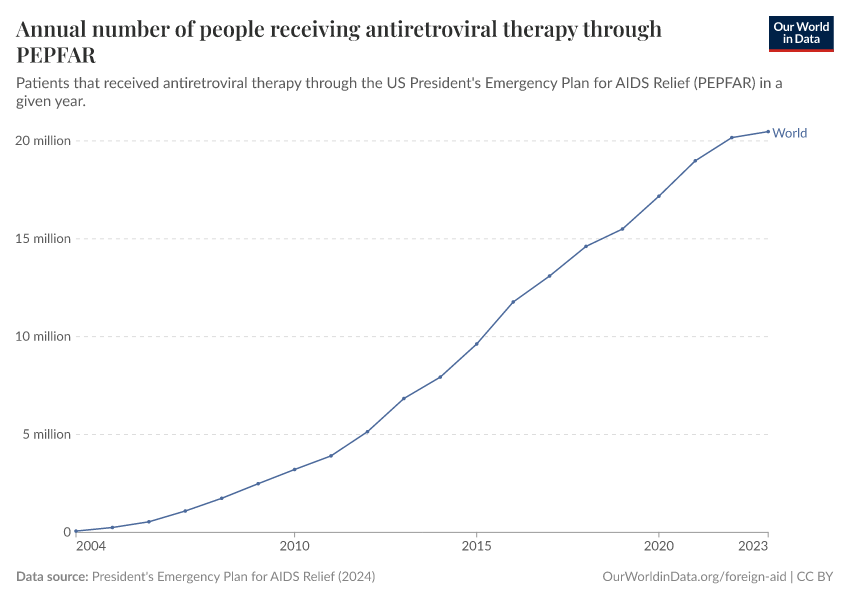
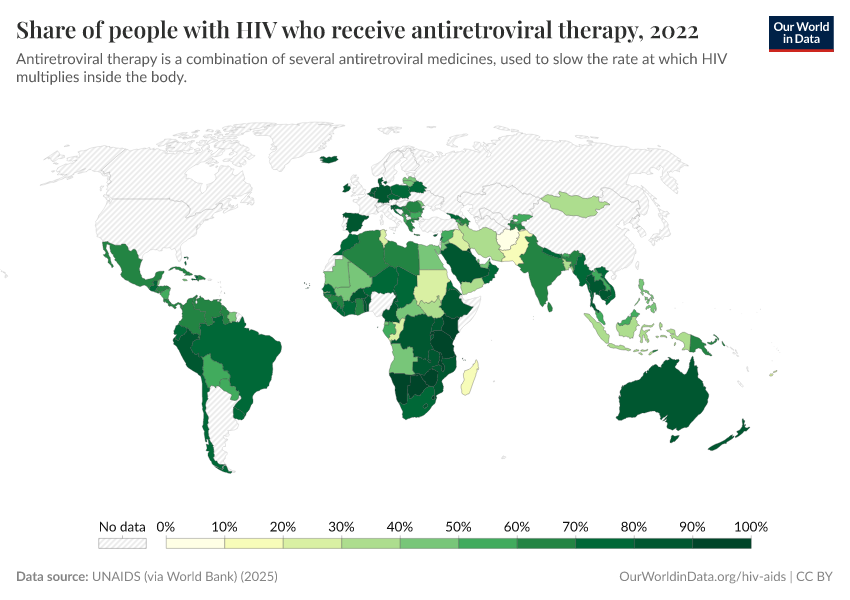
Antiretroviral therapy
A couple of decades ago, the chances of surviving more than ten years with HIV were slim. Today, thanks to antiretroviral therapy (ART), people with HIV/AIDS can expect to live long lives.
ART is a long-term medical treatment for HIV/AIDS. It works by suppressing the virus from multiplying in the body. This keeps the infection under control and helps to prevent the disease from progressing. ART is essential in progressing against HIV/AIDS because it saves lives, allows people with HIV to live longer, and prevents new HIV infections. Read more in our article:
Prevention of mother-to-child transmission (PMTCT)
Given that most AIDS cases in children are due to the virus transmission from mother to child during pregnancy, stopping mother-to-child transmission is critical to preventing children from getting infected with HIV.
The chances of an HIV-positive mother transmitting the virus to a child are between 15% and 45%. Effective prevention of mother-to-child transmission (PMTCT) services can reduce the chances of transmission to newborns down to 5%.3
PMTCT services include preventative measures such as antiviral therapy for mothers and newborns, correct breastfeeding practices, and early child testing for HIV infection.
This visualization shows the number of child infections averted by ART coverage in mothers.

Coverage of ART in pregnant women
This map shows the share of pregnant women infected with HIV who receive antiretroviral therapy – a vital intervention to prevent the transmission from mother to child.

Safe sex
Unsafe sex is a leading risk factor for death in Sub-Saharan Africa

Share of people practicing safe sex
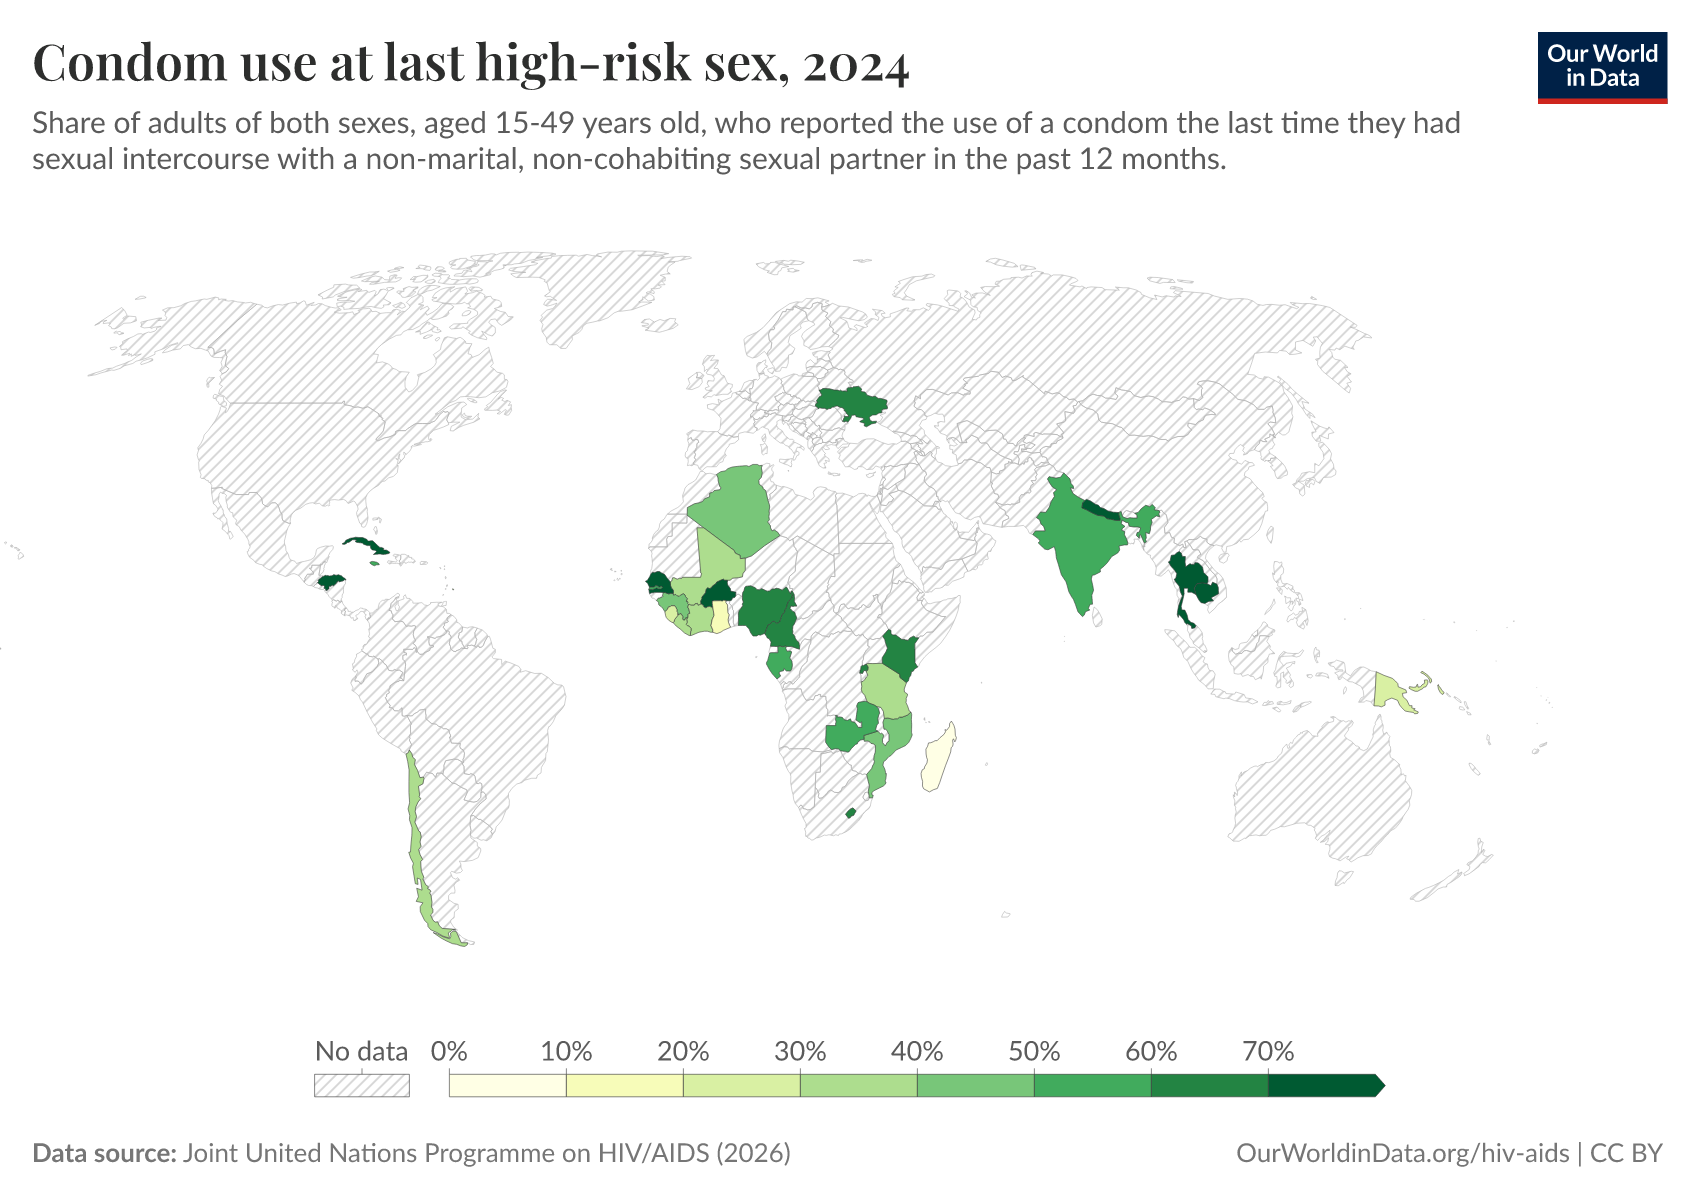
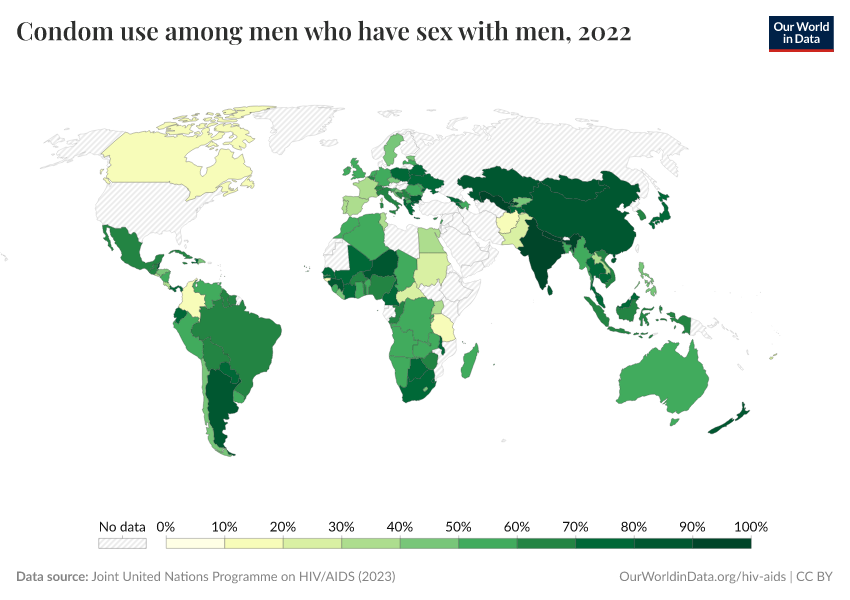
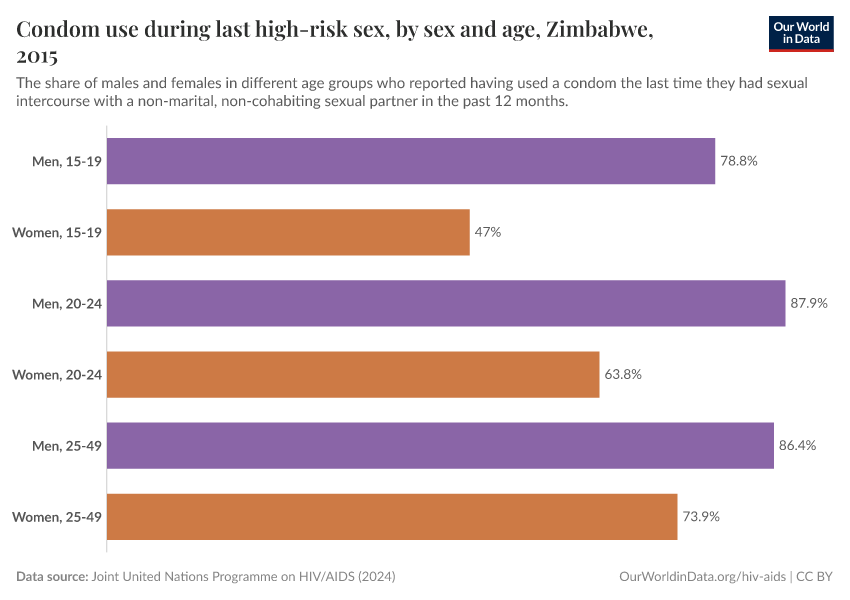
The majority of HIV infections are transmitted through sexual activity.
Sexual transmission can be prevented through condom use (both in heterosexual and homosexual relationships). In the charts here, we see the prevalence of condom use, particularly in cases of “high-risk sex”, which is defined by this data’s source as non-marital, non-cohabiting sexual partner.

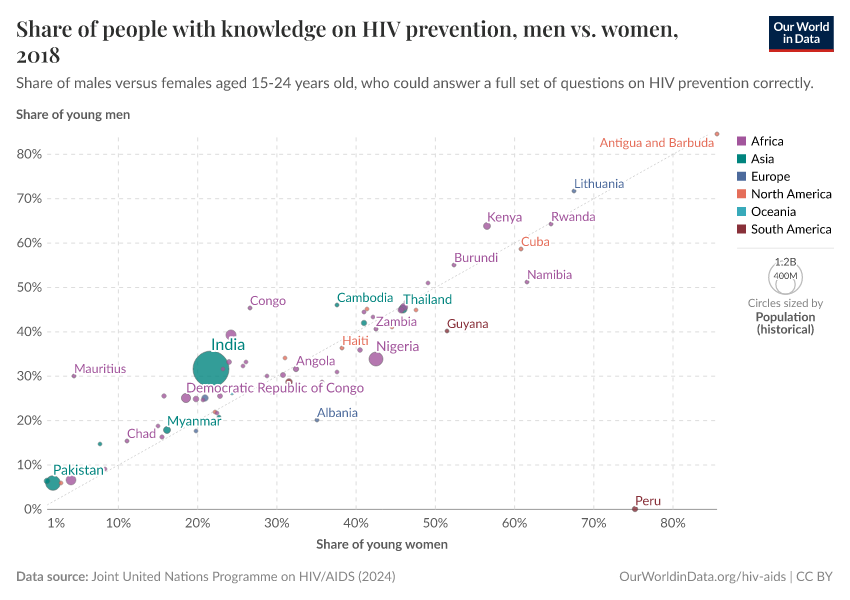
Education on HIV/AIDS


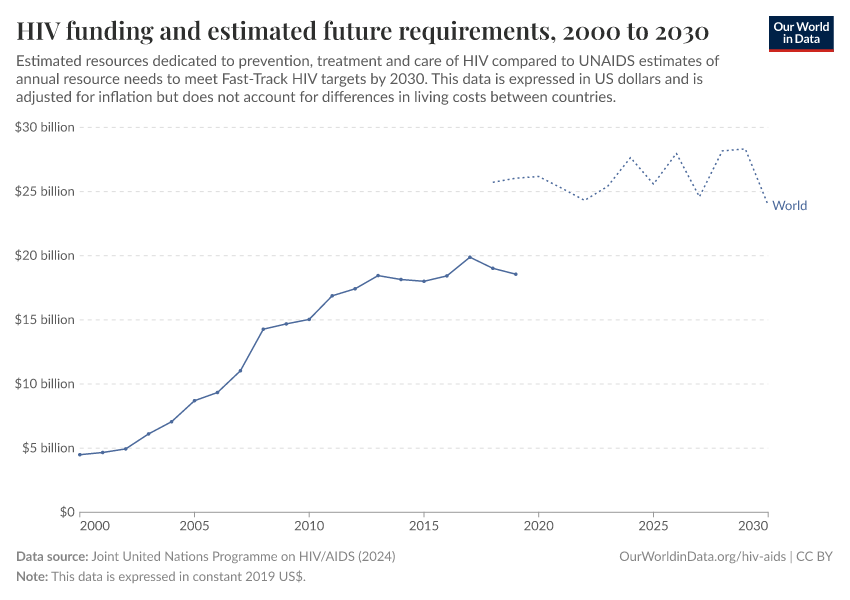
Funding to support efforts against HIV/AIDS


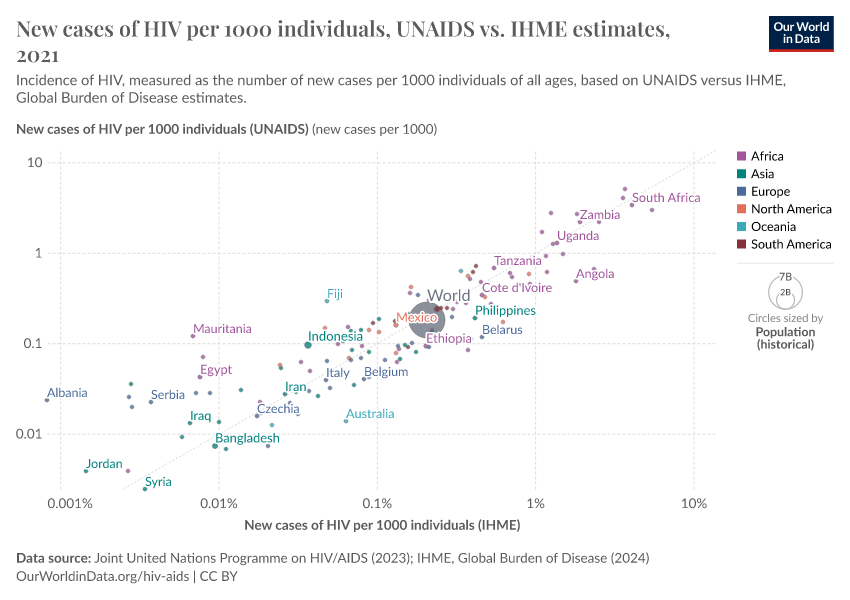
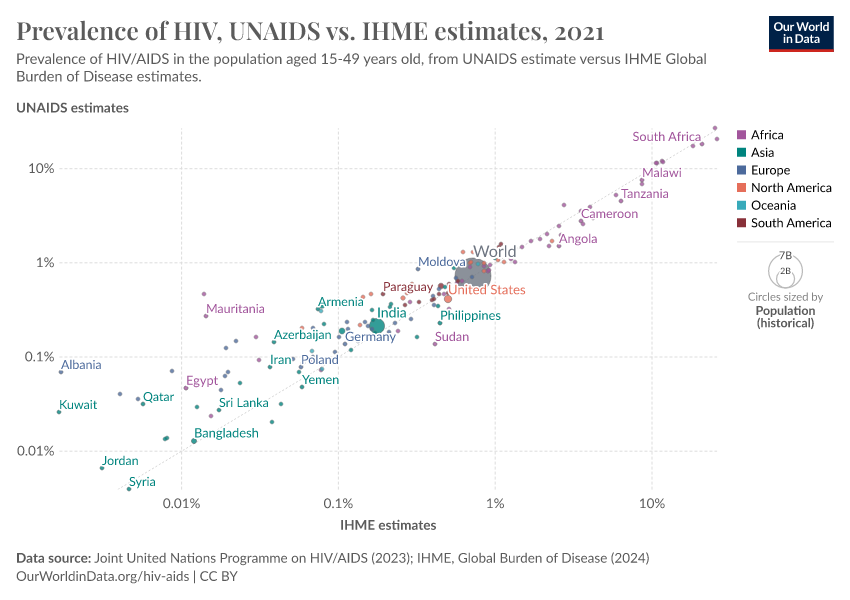
Comparisons of UNAIDS and IHME estimates
Several sources publish estimates on HIV and AIDS. Two of the most established sources, presented on this page, are UNAIDS and the Institute of Health Metrics and Evaluation (IHME). The charts below show a comparison of these two sources' estimates.
Prevalence of HIV

Incidence/new cases of HIV

Key Charts on HIV/AIDS
See all charts on this topic


Featured Data on HIV/AIDS
Endnotes
The latest study can be found at the website of the Lancet here: TheLancet.com/GBD
Greig, A., Peacock, D., Jewkes, R., & Msimang, S. (2008). Gender and AIDS: time to act. AIDS (London, England), 22(Suppl 2), S35. Available online.
World Health Organization (WHO) 'Mother-to-child transmission of HIV' [accessed November 2019]
Cite this work
Our articles and data visualizations rely on work from many different people and organizations. When citing this topic page, please also cite the underlying data sources. This topic page can be cited as:
Max Roser and Hannah Ritchie (2023) - “HIV / AIDS” Published online at OurWorldinData.org. Retrieved from: 'https://ourworldindata.org/hiv-aids' [Online Resource]BibTeX citation
@article{owid-hiv-aids,
    author = {Max Roser and Hannah Ritchie},
    title = {HIV / AIDS},
    journal = {Our World in Data},
    year = {2023},
    note = {https://ourworldindata.org/hiv-aids}
}
Reuse this work freely
All visualizations, data, and articles produced by Our World in Data are completely open access under the Creative Commons BY license. You have the permission to use, distribute, and reproduce these in any medium, provided the source and authors are credited.
The data produced by third parties and made available by Our World in Data is subject to the license terms from the original third-party authors. We will always indicate the original source of the data in our documentation, so you should always check the license of any such third-party data before use and redistribution.
All of our charts can be embedded in any site.