Fertility Rate
How many children people have, and how this changes over time, are important drivers of population growth and the age structure of populations. People’s decisions about when and how many children to have, in turn, reflect broader trends in societies and economies.
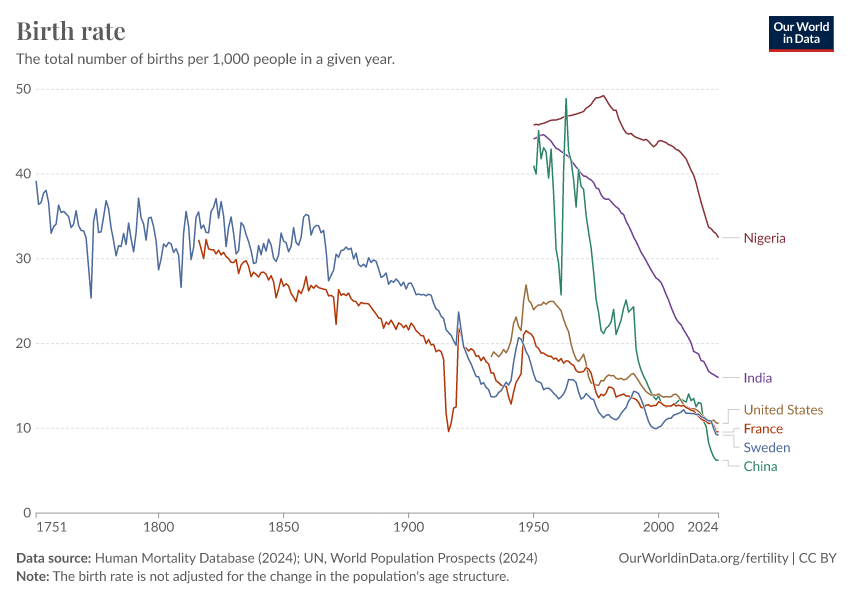
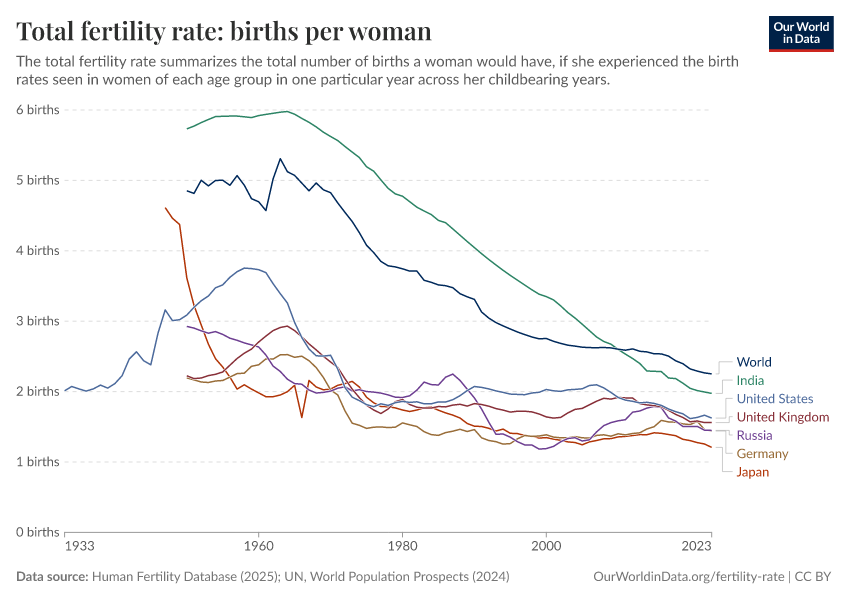
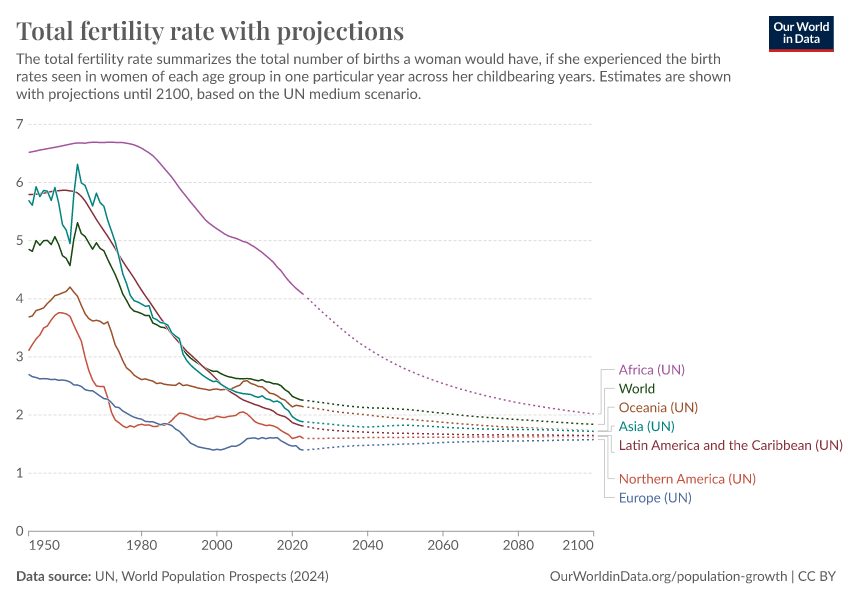
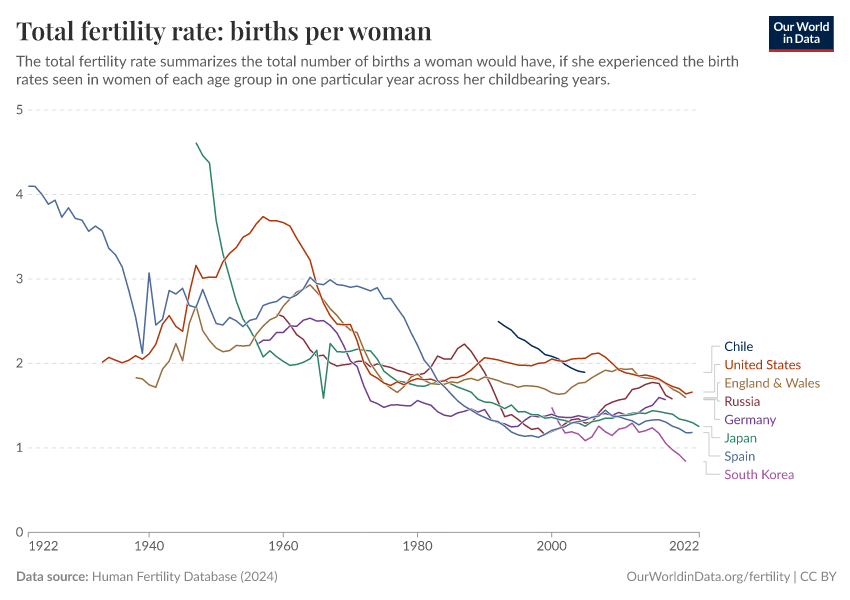
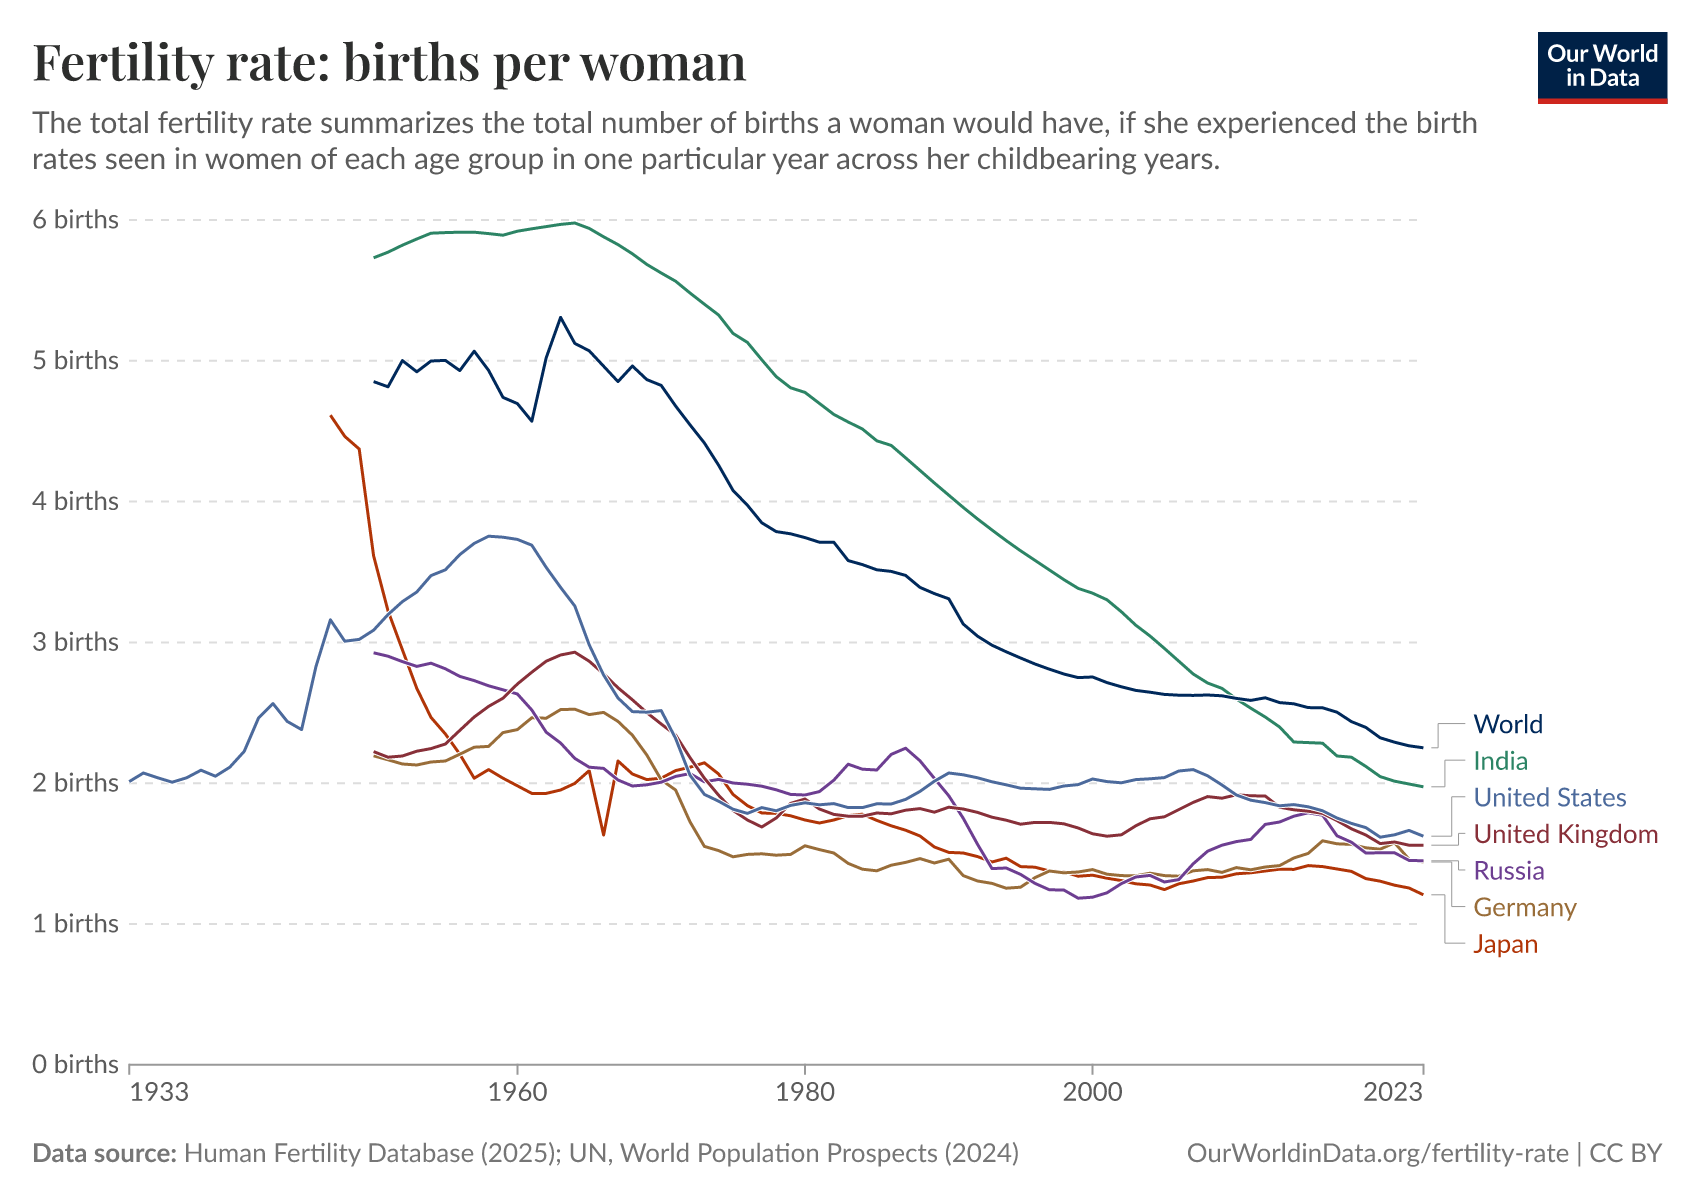
Globally, the total fertility rate was 2.3 children per woman in 2023. This is much lower than in the past; in the 1950s, it was more than twice as high: 4.9.
The total fertility rate is the most commonly used metric to assess birth patterns: it captures the average number of births per woman, assuming she experiences the same age-specific fertility rates over her lifetime as the age-specific fertility rates in one particular year. It’s important to note that this does not predict how many children women will eventually have.
On this page, we present a wide range of different measures related to fertility. We cover parental ages at birth, teenage birth rates, twin birth rates, the use of reproductive technologies, and more.
By looking at these additional metrics, we can better understand when, why, and how parents have children — and what this means for individuals and societies. The following section highlights the key insights on this topic. Below are links to our in-depth articles, which explore several topics in more detail.
Key Insights on Fertility
The fertility rate has declined over history
Fertility rates have fallen around the world.
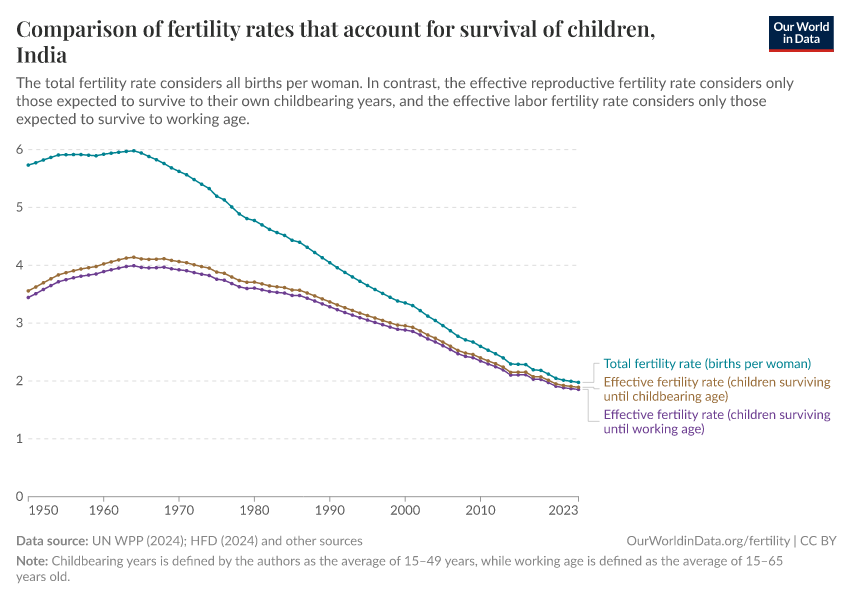
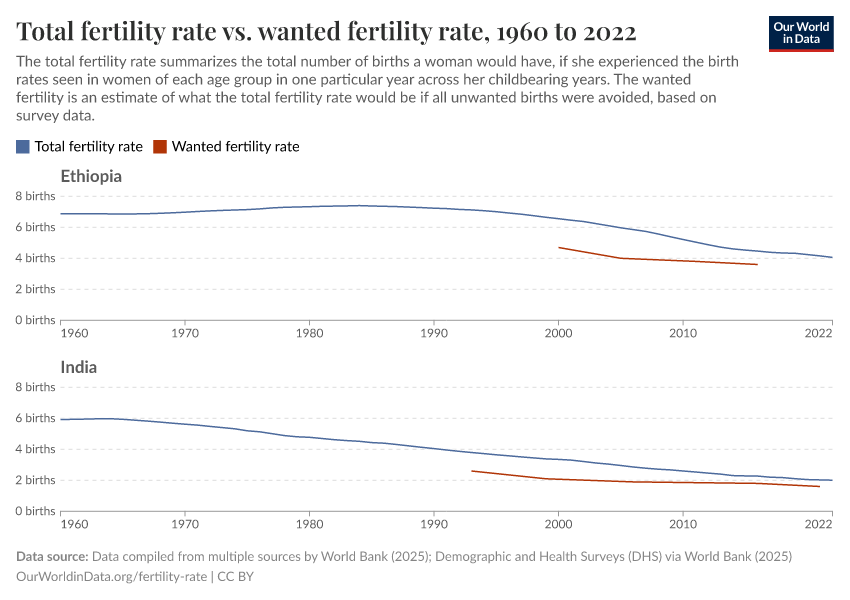
For example, total fertility rates in India have fallen from 5 to 2 births per woman since the 1970s.
South Korea has seen a particularly rapid decline: from a total fertility rate of around 6 births per woman in the 1950s to less than 1 in 2023.
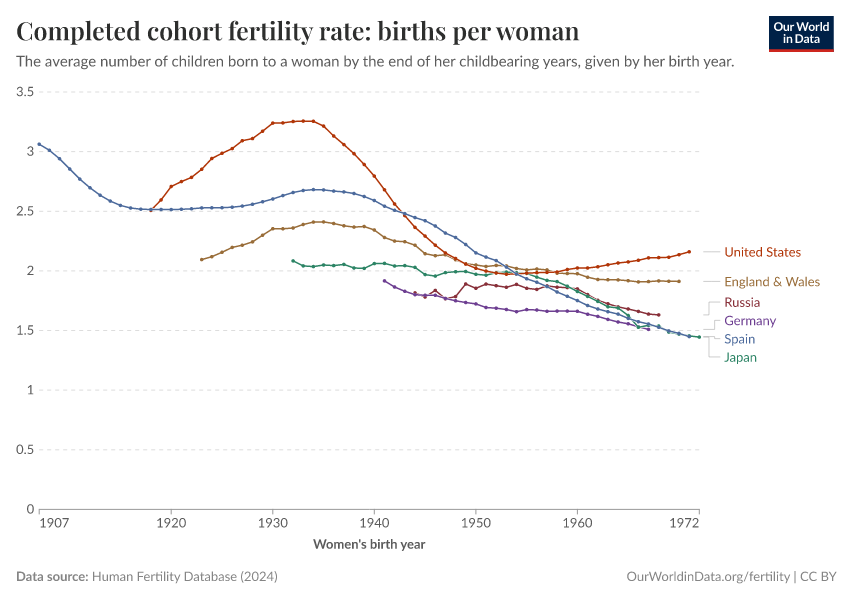
As you can see, this decline in fertility rates is not linear in many countries. The United States is an example of a visible rise between the 1940s and 1960s, referred to as the “baby boom”.
In this article, we cover this in more detail:
What you should know about this data
- The total fertility rate is a metric that summarizes fertility rates across all age groups of women in one particular year.
- It captures the average number of births per woman, assuming she experiences the same age-specific fertility rates over her lifetime as the fertility rates seen in each age group in one particular year.
- It’s important to note that this is not a prediction of how many children women will eventually have. It includes all live births, not just children who survive early life.
- This data is compiled from two sources: the Human Fertility Database and the United Nations’ World Population Prospects (UN WPP). For data points before 1950, we use Human Fertility Database data. From 1950 onwards, we use UN WPP data.
- The HFD prioritizes uniformity in methods and is limited to specific countries and periods where high-quality fertility data is available nationally.
- The UN WPP estimates ages at childbirth in various countries through various methods. In countries where birth registration data with mothers’ ages is often lacking, the underlying data frequently comes from national household surveys, which are then used to estimate fertility rates and ages at childbirth.

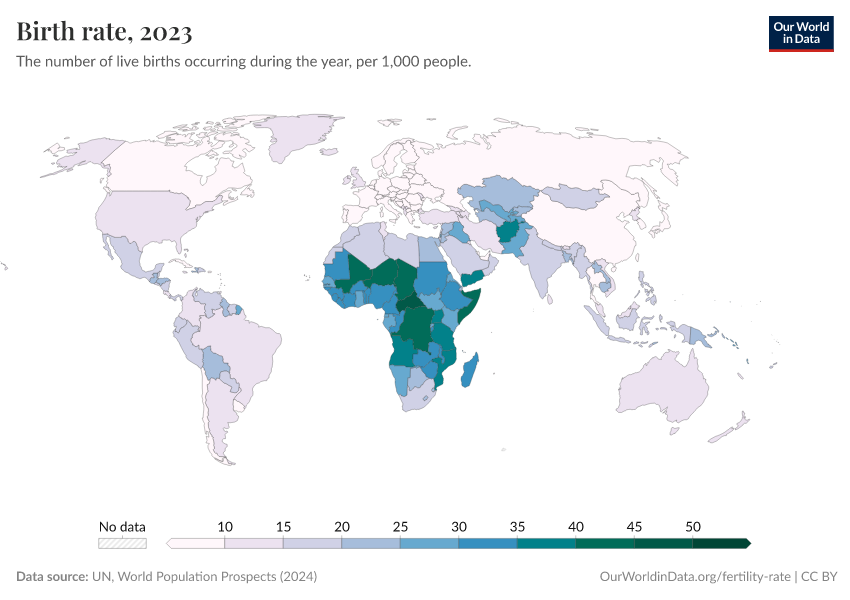
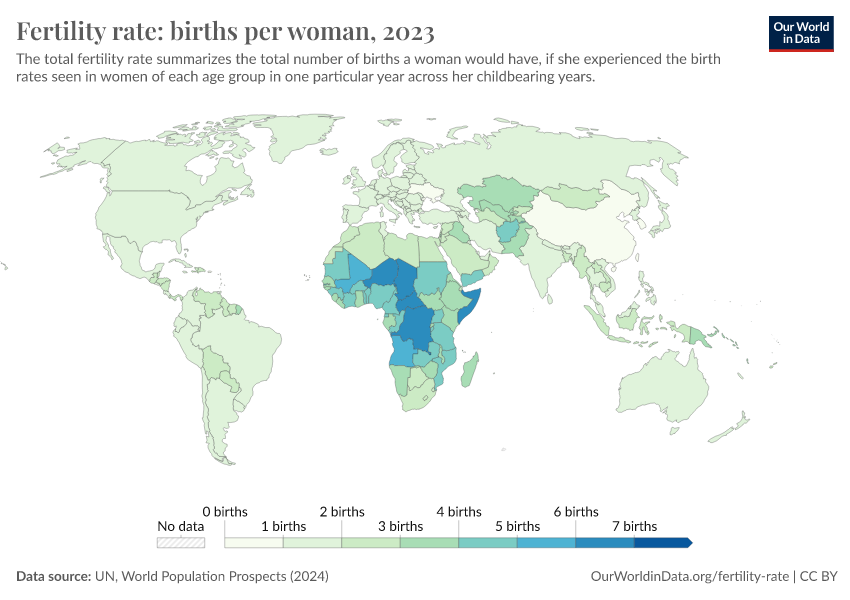
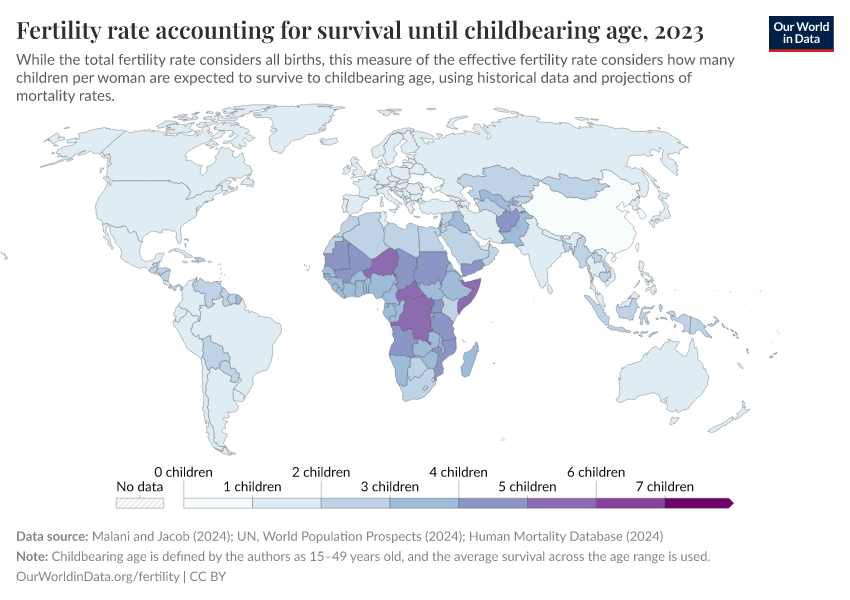
The fertility rate varies greatly around the world
Fertility rates vary greatly around the world.
In 2023, the total fertility rate was highest in countries in Africa and central Asia, where most countries had a total fertility rate between 3 to 7 births per woman, and lowest in countries in East Asia, where most countries had a total fertility rate below 1.
However, a share of children die in infancy or early life, which means that the total fertility rate is higher than the number of surviving children per woman.
The map, therefore, shows the “effective fertility rate”, which considers how many newborns are expected to survive until their childbearing age. This data comes from estimates by economists Anup Malani and Ari Jacob.
For example, Niger had a total fertility rate of 6 in 2023, but because of high child mortality rates, 1 in 6 children in the country aren’t expected to survive until adulthood, and the effective fertility rate therefore is 5 children per woman.
The effective fertility rate also shows large differences around the world, but less so than the total fertility rate because high fertility is correlated with high child mortality.
In 2023, the effective fertility rate was between 1.5 and 2 children per woman in most regions. Sub-Saharan Africa, where it was substantially higher, had a rate of 2 to 6 children.
What you should know about this data
- The total fertility rate is a metric that summarizes fertility rates across all age groups of women in one particular year. It captures the average number of births per woman, assuming she experiences the same age-specific fertility rates over her lifetime as the fertility rates seen in each age group in one particular year when she reaches the same age. It’s important to note that this is not a prediction of how many children women will eventually have.
- The effective fertility rate estimates what the total fertility rate would be if it only considered children who survived until their own childbearing age. It estimates the children per woman who would survive until their own childbearing years. It is calculated using historical estimates and projections of child survival rates. Here, we use calculations from economists Anup Malani and Ari Jacob.
- The underlying data is compiled from the Human Fertility Database (HFD), Human Mortality Database (HMD), and the United Nations’ World Population Prospects (UN WPP). For data points before 1950, we use data from the HFD and HMD. From 1950 onwards, we use UN WPP data.
- The HFD prioritizes uniformity in methods and is limited to specific countries and periods where high-quality fertility data is available nationally.
- The UN WPP estimates ages at childbirth in various countries through various methods. In countries where birth registration data with mothers’ ages is often lacking, the underlying data frequently comes from national household surveys, which are then used to estimate fertility rates and ages at childbirth.

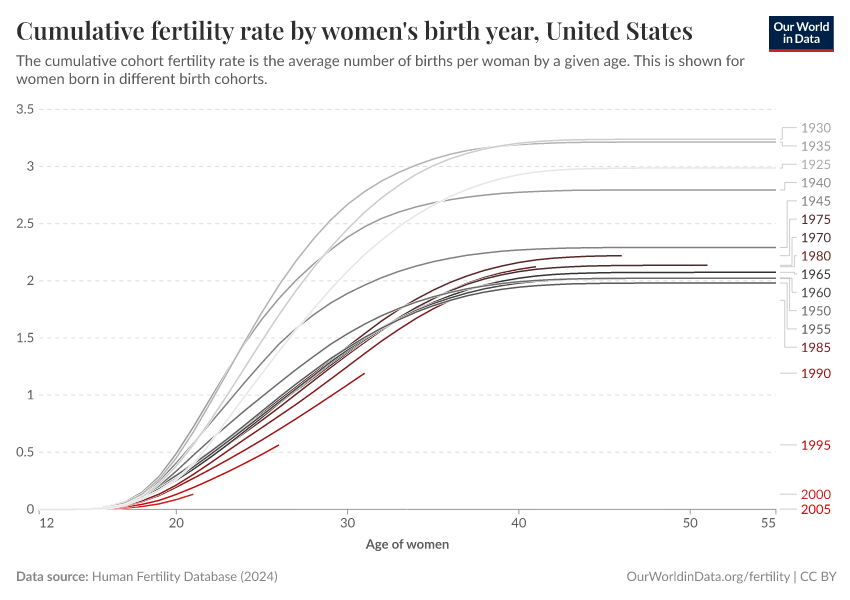
Two is the typical number of children among women in many high-income countries
What share of women have one or two children? What share have none?
To better understand these questions, we can explore data on the total number of births per woman by the end of their childbearing years. The data is given by women’s birth year. Unfortunately, this data is only available for some countries.
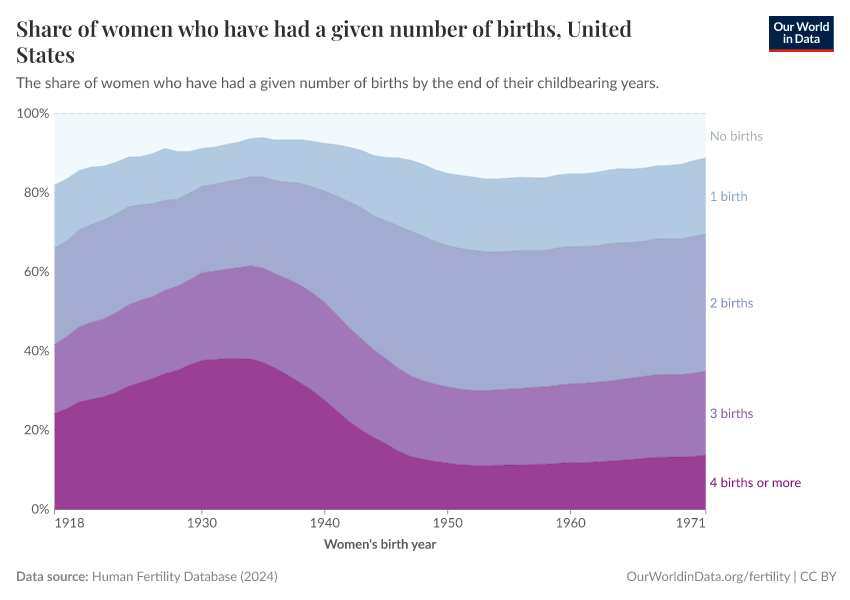
We’ll explore data from the United States. As you can see, having exactly two children is the most common family size. This is the case in many high-income countries, as you can see by clicking the “Change country” button.
In the US, for women born in 1971, around one in three have two children. One in five have one child, and another one in five have three children.
What you should know about this data
- This data is compiled from the Human Fertility Database (HFD).
- The HFD prioritizes uniformity in methods and is limited to specific countries and periods where high-quality fertility data is available nationally.

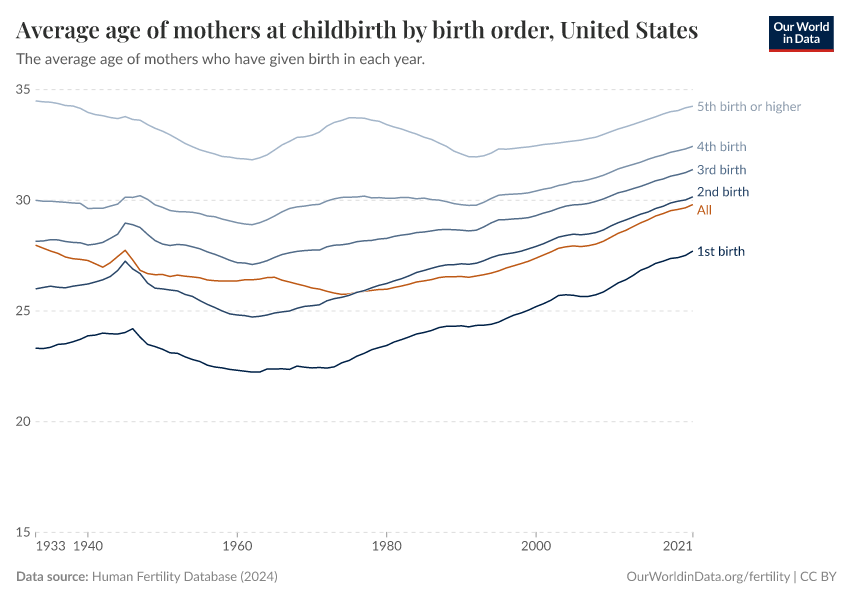
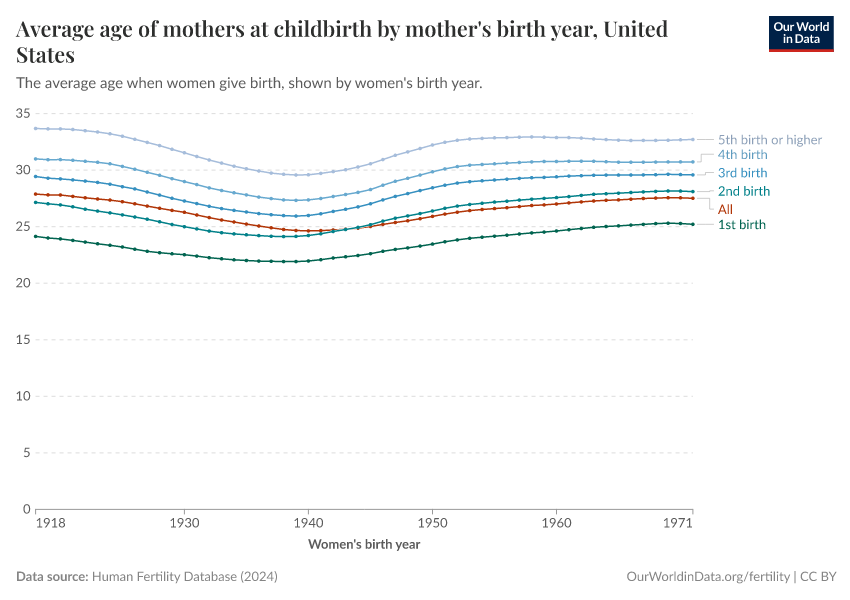
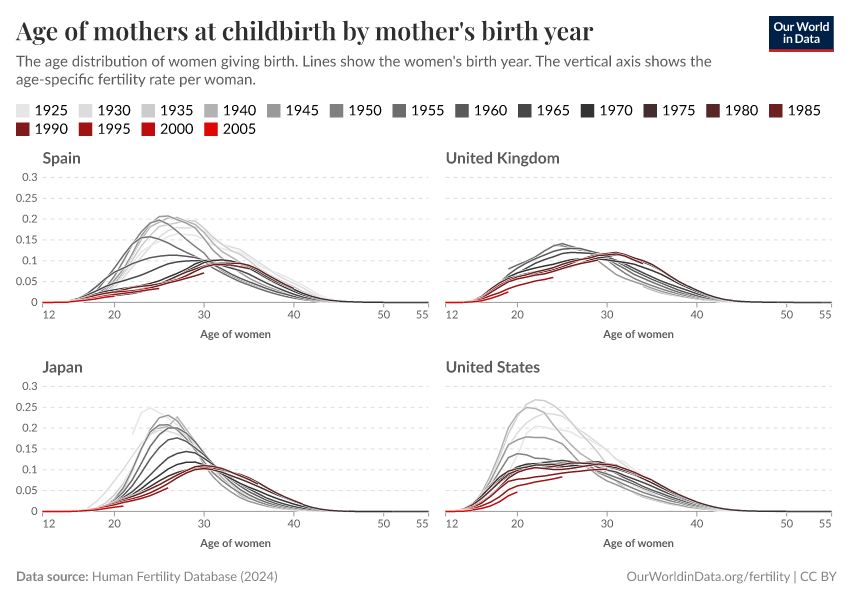
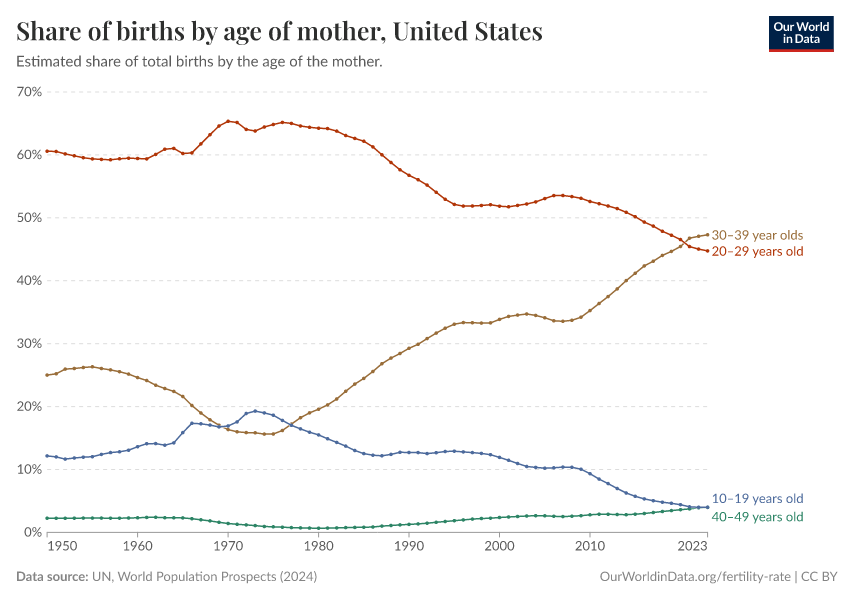
In many countries, the average age of mothers at childbirth declined before rising again
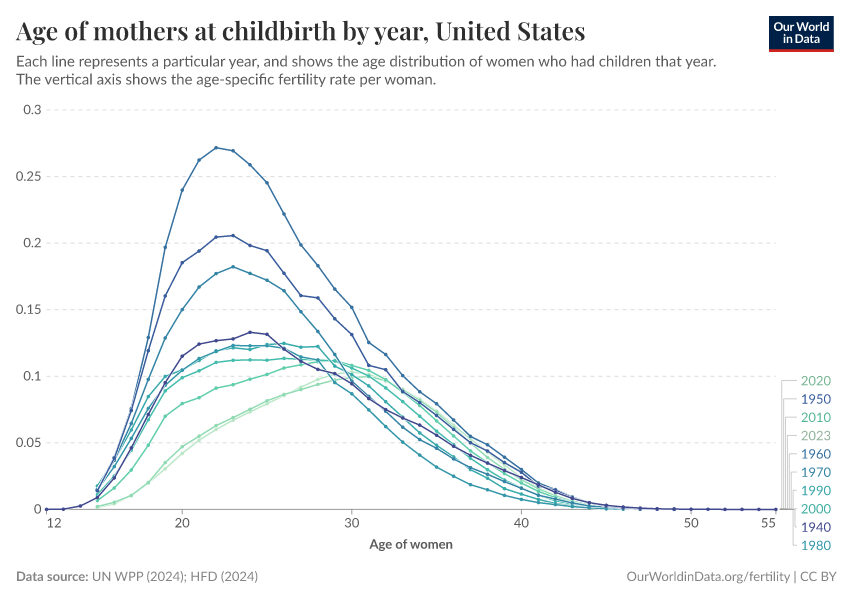
The chart here shows the average age of women who have children in a given year by the number of births they’ve had.
In many countries, women's average age at childbirth declined slightly in the early twentieth century but has risen since then.
This pattern is visible in many countries worldwide. By clicking the “Edit countries” button, you explore this data for other countries with available data.
For countries without data broken down by birth order, you can explore the average age across all births in this related chart.
What you should know about this data
- This data is compiled from the Human Fertility Database (HFD).
- The HFD prioritizes uniformity in methods and is limited to specific countries and periods where high-quality fertility data is available nationally.

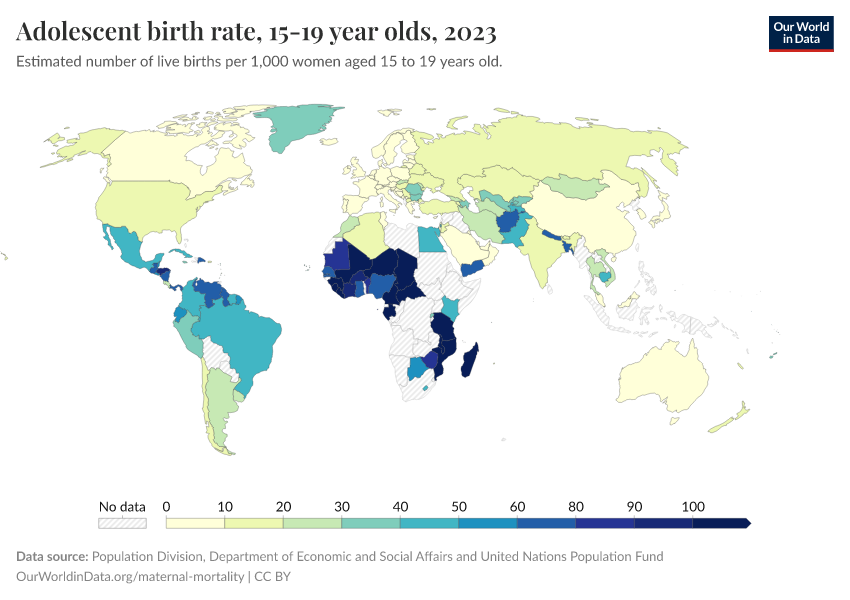
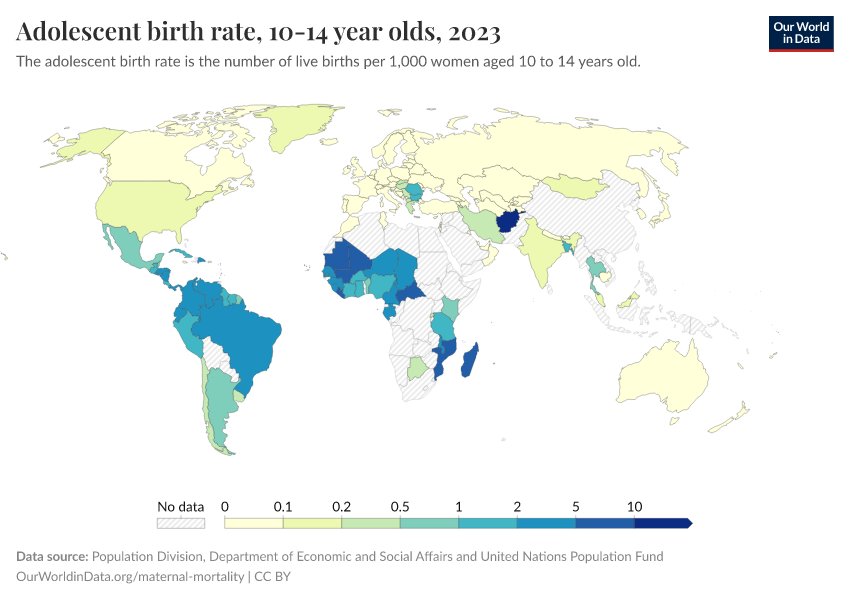
Teenage motherhood is still common in many parts of the world
Teenage motherhood can be a health risk to both mothers and babies. It means a greater risk of complications during pregnancy and childbirth and challenges for the baby’s health and development.1
These are especially concerning in regions with limited healthcare.
In many parts of the world, teenage motherhood remains common. This is shown in the map.
In sub-Saharan Africa, around 100 in 1000 girls aged 15 to 19 give birth yearly. In Europe and East Asia, adolescent birth rates are much lower, with fewer than 20 in 1000 giving birth annually.
Over time, teenage motherhood has declined gradually around the world.
This progress reflects better opportunities in education, reproductive healthcare, and contraception.
What you should know about this data
- This data comes from the United Nations World Population Prospects Database (UN WPP).
- The UN WPP estimates ages at childbirth in various countries through various methods. In poorer countries, where birth registration data with mothers’ ages is often lacking, the underlying data frequently comes from national household surveys, which are then used to estimate fertility rates and ages at childbirth.

Research & Writing
February 20, 2014
The global decline of the fertility rate
The total fertility rate has halved in sixty years — what are the causes of the decline?
February 24, 2025
The baby boom in seven charts
The baby boom reshaped family life and drove population growth in many countries. In this article, we explore the key patterns in seven charts.
More Articles on Fertility
February 24, 2025
Why the total fertility rate doesn’t necessarily tell us the number of births women eventually have
November 27, 2023
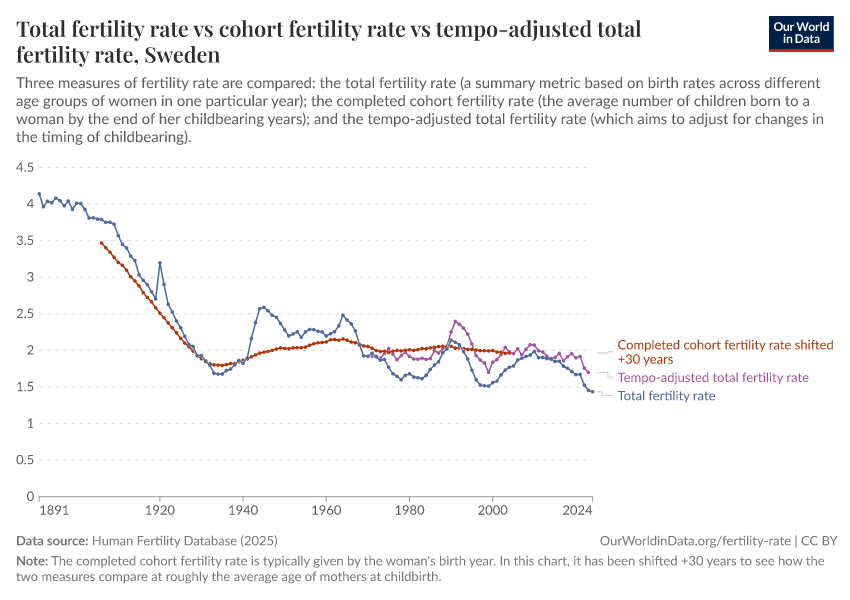
Period versus cohort measures: what’s the difference?
June 2, 2023
Population momentum: if the number of children per woman is falling, why is the population still increasing?
January 5, 2023
How many people die and how many are born each year?
July 11, 2022
Five key findings from the 2022 UN Population Prospects
September 3, 2019
Until the late 1960s, the total fertility rate was five — since then, it has halved
Key Charts on Fertility Rate
See all charts on this topic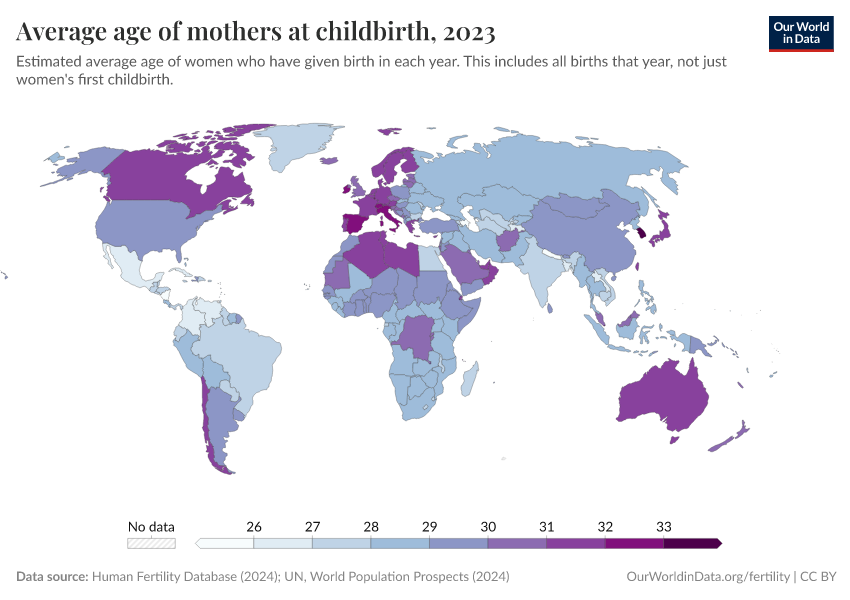


Featured Data on Fertility Rate
Endnotes
Leftwich, H. K., & Alves, M. V. O. (2017). Adolescent Pregnancy. Pediatric Clinics of North America, 64(2), 381–388. https://doi.org/10.1016/j.pcl.2016.11.007
Cite this work
Our articles and data visualizations rely on work from many different people and organizations. When citing this topic page, please also cite the underlying data sources. This topic page can be cited as:
Saloni Dattani, Lucas Rodés-Guirao, and Max Roser (2025) - “Fertility Rate” Published online at OurWorldinData.org. Retrieved from: 'https://ourworldindata.org/fertility-rate' [Online Resource]BibTeX citation
@article{owid-fertility-rate,
    author = {Saloni Dattani and Lucas Rodés-Guirao and Max Roser},
    title = {Fertility Rate},
    journal = {Our World in Data},
    year = {2025},
    note = {https://ourworldindata.org/fertility-rate}
}
Reuse this work freely
All visualizations, data, and articles produced by Our World in Data are completely open access under the Creative Commons BY license. You have the permission to use, distribute, and reproduce these in any medium, provided the source and authors are credited.
The data produced by third parties and made available by Our World in Data is subject to the license terms from the original third-party authors. We will always indicate the original source of the data in our documentation, so you should always check the license of any such third-party data before use and redistribution.
All of our charts can be embedded in any site.