Nuclear Weapons
How many states have nuclear weapons, and how many warheads do they have? How is this changing over time? Explore research and data on nuclear weapons.
This page was first published in August 2013 and last revised in February 2024.
The world’s nuclear powers have more than 12,000 nuclear warheads. These weapons can kill millions directly and, through their impact on agriculture, likely have the potential to kill billions.
Nuclear weapons killed between 110,000 and 210,000 people when the United States used them against the Japanese cities of Hiroshima and Nagasaki in August 1945.1 They have come close to being used again more than a dozen times since.
This is why countries have worked to limit the proliferation and number of nuclear weapons.
On this page, you can find writing, visualizations, and data on how many states have nuclear weapons, how many warheads they possess, how many oppose them, and how this has changed over time.
For an overview of the risks of nuclear weapons – and how they can be reduced – you can read the following essay:
Related topics
See all interactive charts on nuclear weapons ↓
Few countries possess nuclear weapons, but some have large arsenals
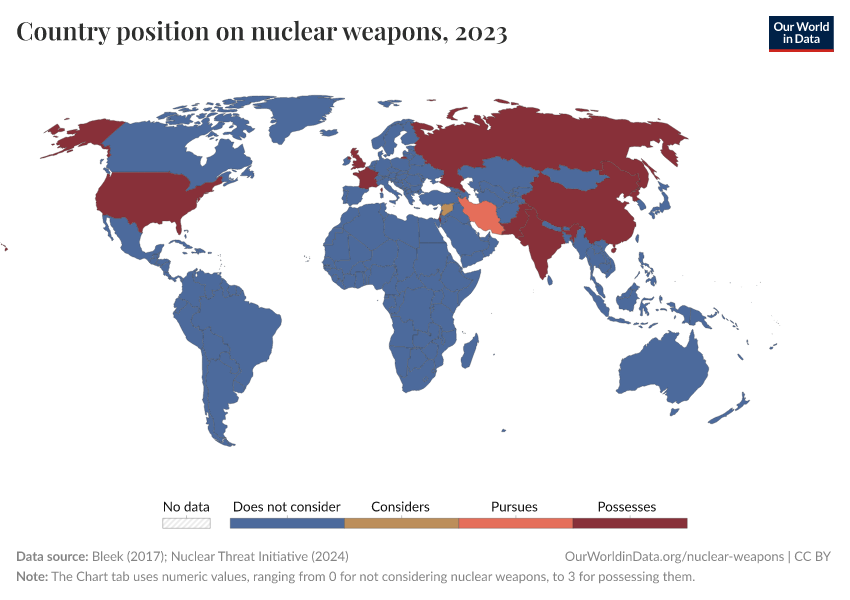
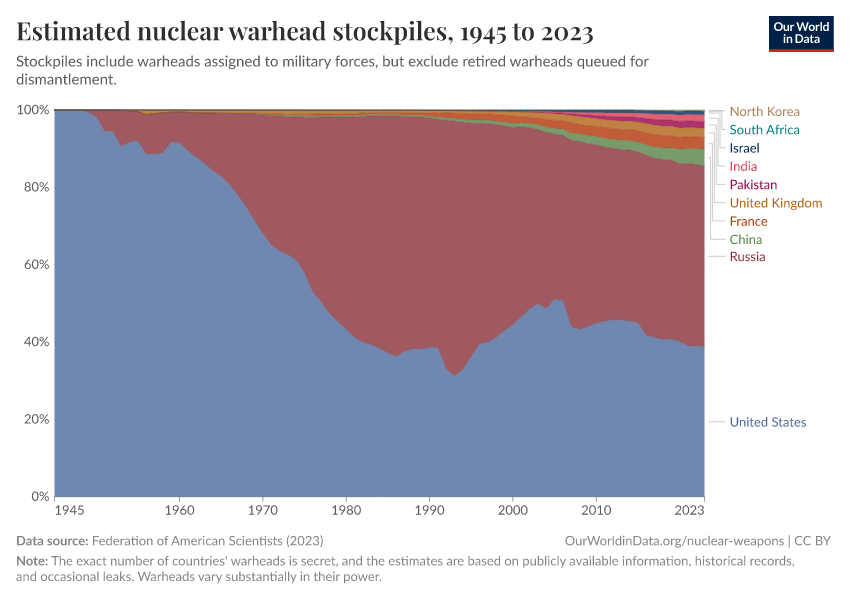
Nine countries currently have nuclear weapons: Russia, the United States, China, France, the United Kingdom, Pakistan, India, Israel, and North Korea.
These nuclear powers differ a lot in how many nuclear warheads they have. The chart shows that while most have dozens or a few hundred warheads, Russia and the United States have thousands of them.

The chart also shows that the warheads differ in how — and how quickly — they can be used: some are designed for strategic use away from the battlefield, such as against arms industries or infrastructure, while others are for nonstrategic, tactical use on the battlefield.
And while some warheads are not deployed, or even retired and queued for dismantlement, a substantial share of them is deployed on ballistic missiles or bomber bases and can be used quickly.
Many countries have abandoned efforts to obtain nuclear weapons
The number of countries that possess nuclear weapons has never been higher. Only one country that had them — South Africa — entirely dismantled its arsenal.
But, as the chart shows, many more states had considered or pursued nuclear weapons, and almost all of them stopped.
In the late 1970s, more than a dozen countries considered them or pursued them by launching nuclear weapons programs, but almost all stopped. Only Syria has considered nuclear weapons recently, and only Iran has pursued building them.

The number of nuclear weapons has declined substantially since the end of the Cold War
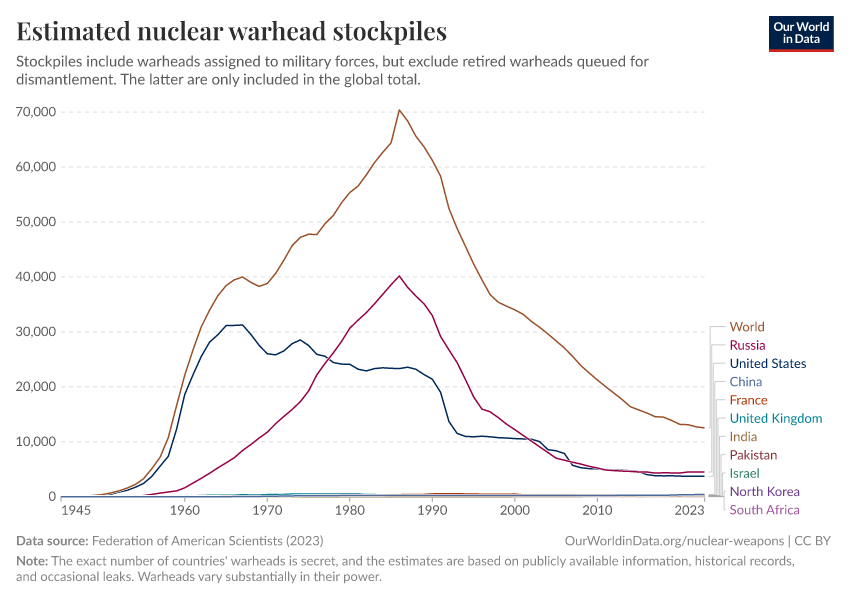
After increasing for almost half a century after their creation in the 1940s, nuclear arsenals reached over 60,000 warheads in 1986.
Since then we have seen a reversal of this trend, as the chart shows. The nuclear powers reduced their arsenals a lot in the following decades, and the number of warheads fell below 20,000 in the 2010s.
The decline has slowed since then, and the total stockpile still consists of more than 10,000 warheads. Some countries have also been expanding their arsenals.
The destructiveness of nuclear arsenals has declined
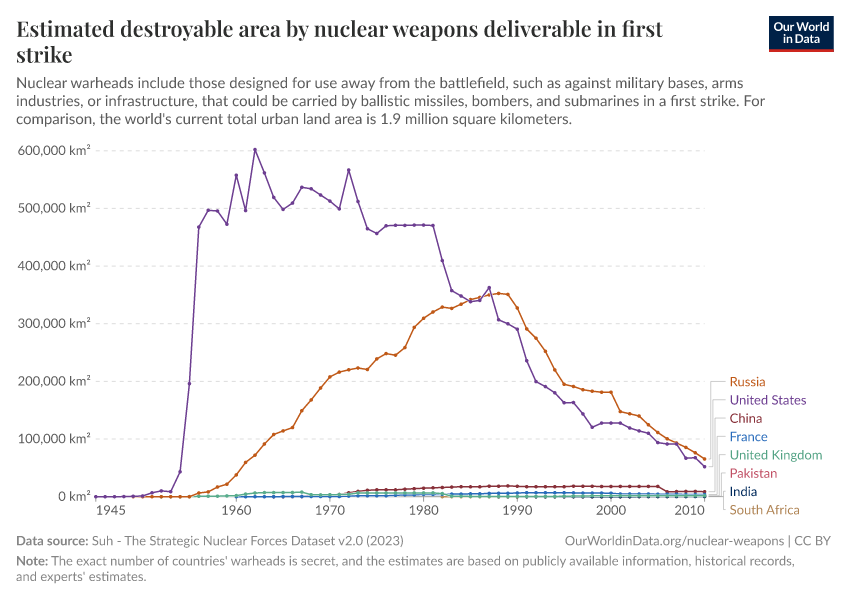
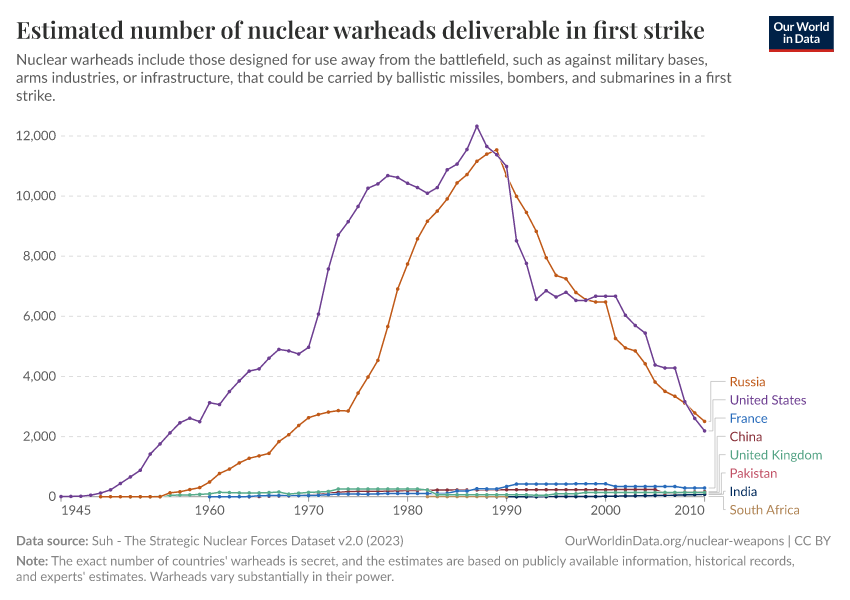
A simple count of the number of warheads, as shown in the previous chart, does not consider that these weapons differ in their explosive power. It also does not consider that not all of them can be used at once.
The data shown in the following chart attempts to take this into account. It considers the destructiveness and deployment of nuclear warheads to arrive at an estimate of the explosive power of nuclear weapons deliverable in a first strike.
We see that the United States rapidly developed much more powerful warheads in the 1950s. The Soviet Union increased the destructiveness of its weapons more slowly but ultimately reached similar levels.
The destructive potential of first-strike warheads peaked at more than 15,000 Mt in the early 1980s. This amounts to more than a million Hiroshima bombs. At this peak, first-strike weapons could destroy more than 40% of the total urban land worldwide.
However, the destructiveness of first strikes has been steadily declining for decades, for both the United States and the Soviet Union/Russia.
Yet, it has still been more than 2,500 Mt, with the potential to directly destroy almost 7% of the total urban land worldwide.

Nuclear weapons tests have almost stopped
The nuclear weapons states frequently tested their warheads in the past, but tests now have almost ended.
The chart shows that they peaked in 1962 at 178 tests, mostly conducted by the United States and the Soviet Union. These tests harmed the environment and people, especially indigenous communities.
Tests decreased later during the Cold War and have been nearly absent in the last two decades. The only country that has recently tested nuclear weapons is North Korea.

Nuclear weapons have come close to being used a dozen times since World War II
After killing between 110,000 and 210,000 people in Hiroshima and Nagasaki in 1945, nuclear weapons have come close to being used more than a dozen times again.1
The chart below shows a timeline of such close calls.2 We can see that some of them have been accidental, while others have been deliberate.
You can learn more in our article on the risks of nuclear weapons.
Many countries want to limit or abolish nuclear weapons
Countries have sought to reduce the threat posed by nuclear weapons through international cooperation.
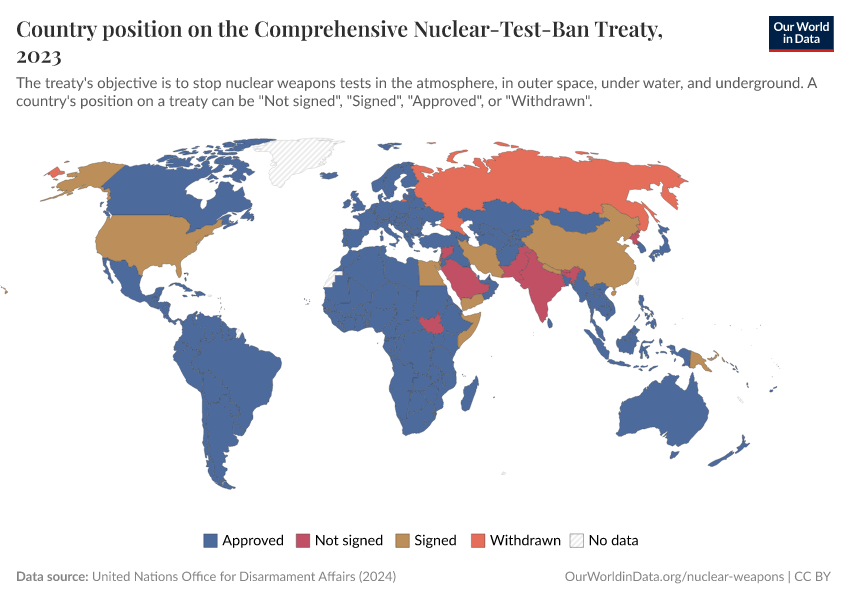
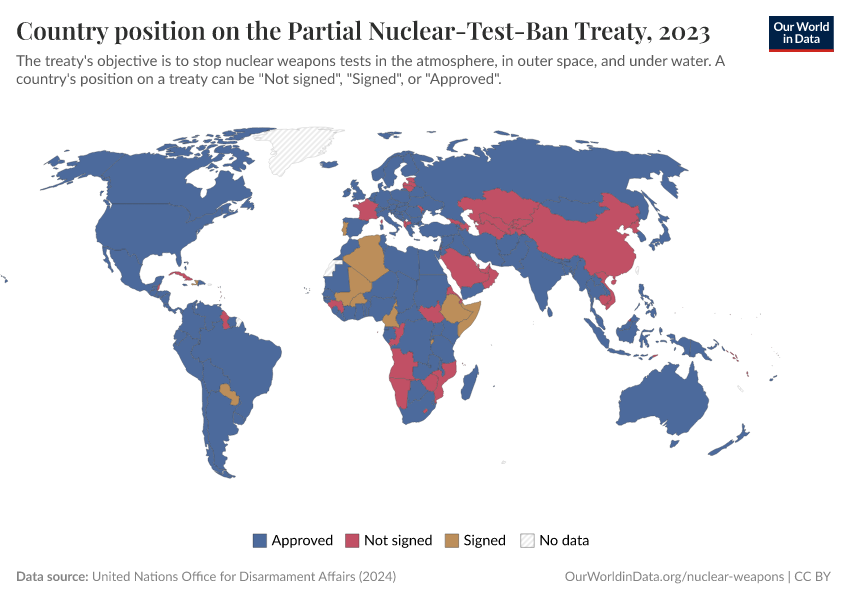
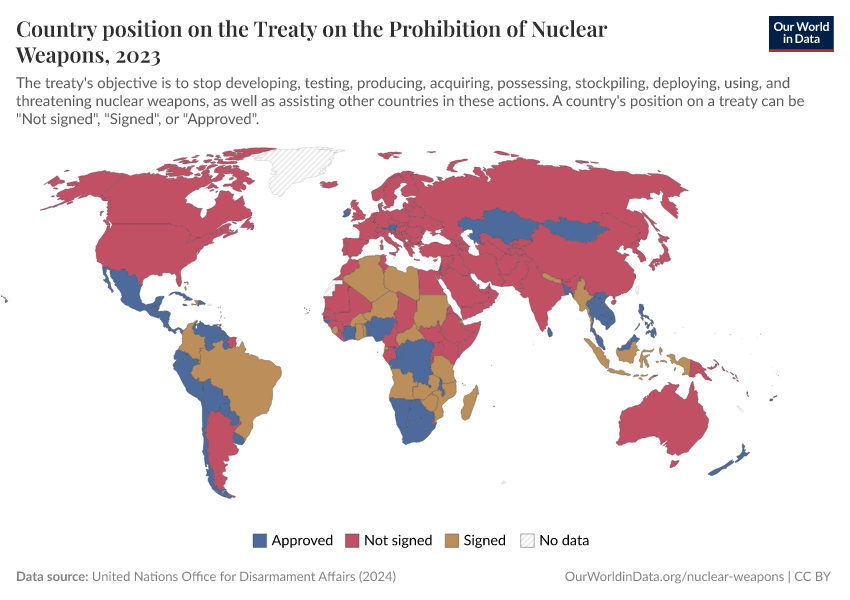
Most countries have approved the Partial and Comprehensive Nuclear-Test-Ban Treaties, which seek an end to nuclear weapons tests.
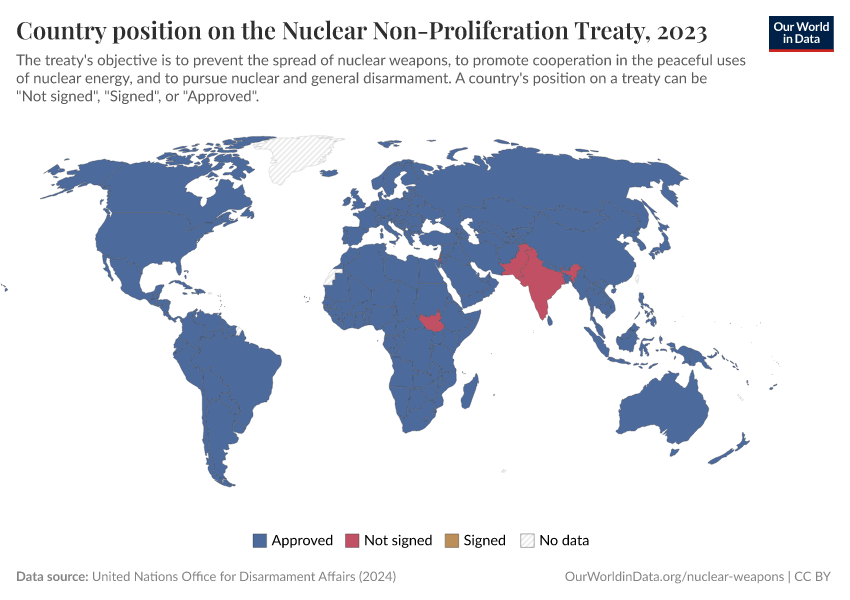
The same goes for the Nuclear Non-Proliferation Treaty, whose objective is to prevent the spread of nuclear weapons.
Recently, dozens of countries have approved the Nuclear Prohibition Treaty, whose aim is to end the development and existence of nuclear weapons altogether.

Key Charts on Nuclear Weapons
See all charts on this topicEndnotes
You can find the stories of six survivors — Masakazu Fujii, Wilhelm Kleinsorge, Hatsuyo Nakamura, Terufumi Sasaki, Toshiko Sasaki, and Kiyoshi Tanimoto — in John Hersey’s article Hiroshima.
This list is largely based on Toby Ord’s 2020 book The Precipice. His list can be found in Chapter 4 and Appendix C of his book.
Ord in turn relies mostly on a document from the US Department of Defense from 1981: Narrative Summaries of Accidents Involving US Nuclear Weapons (1950–1980).
Cite this work
Our articles and data visualizations rely on work from many different people and organizations. When citing this topic page, please also cite the underlying data sources. This topic page can be cited as:
Bastian Herre, Pablo Rosado, and Max Roser (2024) - “Nuclear Weapons” Published online at OurWorldinData.org. Retrieved from: 'https://ourworldindata.org/nuclear-weapons' [Online Resource]BibTeX citation
@article{owid-nuclear-weapons,
    author = {Bastian Herre and Pablo Rosado and Max Roser},
    title = {Nuclear Weapons},
    journal = {Our World in Data},
    year = {2024},
    note = {https://ourworldindata.org/nuclear-weapons}
}
Reuse this work freely
All visualizations, data, and code produced by Our World in Data are completely open access under the Creative Commons BY license. You have the permission to use, distribute, and reproduce these in any medium, provided the source and authors are credited.
The data produced by third parties and made available by Our World in Data is subject to the license terms from the original third-party authors. We will always indicate the original source of the data in our documentation, so you should always check the license of any such third-party data before use and redistribution.
All of our charts can be embedded in any site.
