Hunger and Undernourishment
What are the consequences of undernourishment and how can we make progress against hunger and undernourishment?
Having enough to eat is one of the fundamental basic human needs. Hunger – or, more formally, undernourishment – is defined as eating less than the energy required to maintain an active and healthy life.
The share of undernourished people is the leading indicator for food security and nutrition used by the Food and Agriculture Organization of the United Nations.
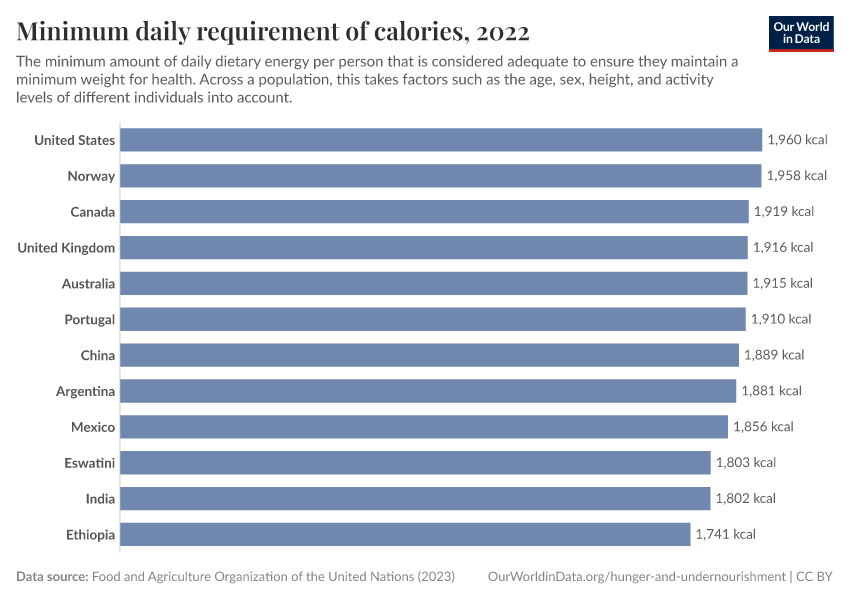
The fight against hunger focuses on a sufficient energy intake – enough calories per person per day. But it is not the only factor that matters for a healthy diet. Sufficient protein, fats, and micronutrients are also essential, and we cover this in our topic page on micronutrient deficiencies.
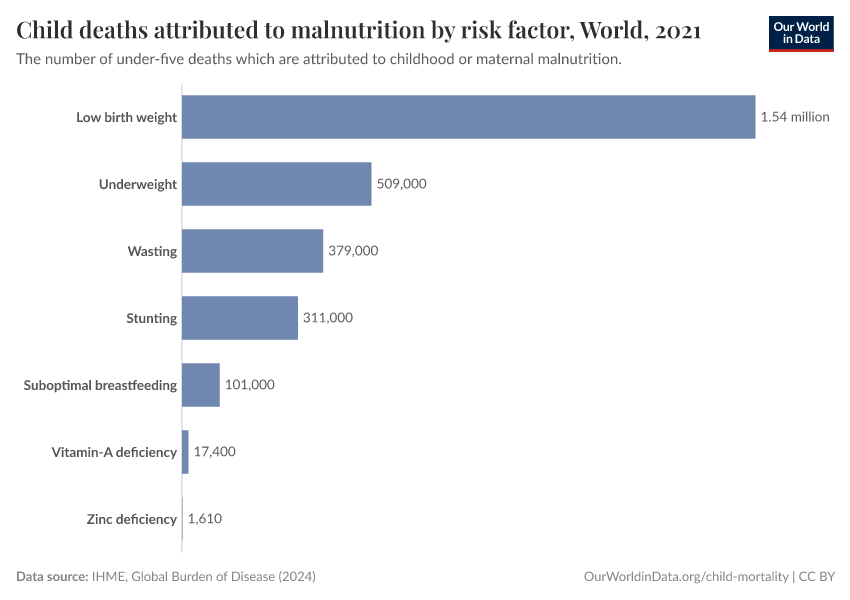
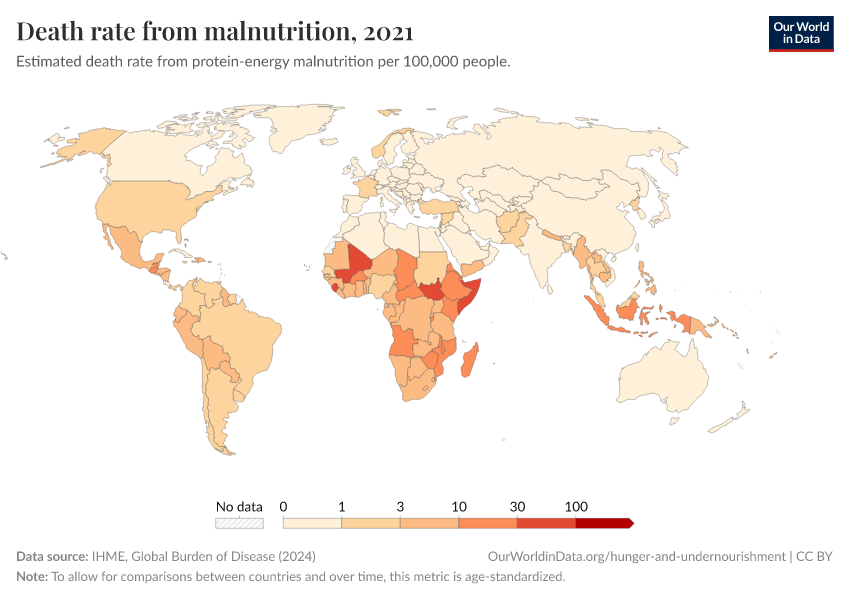
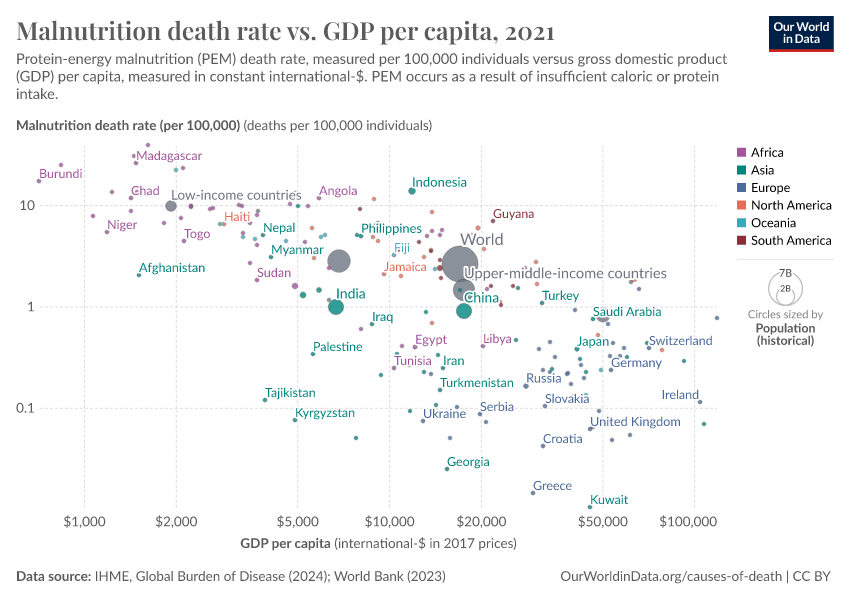
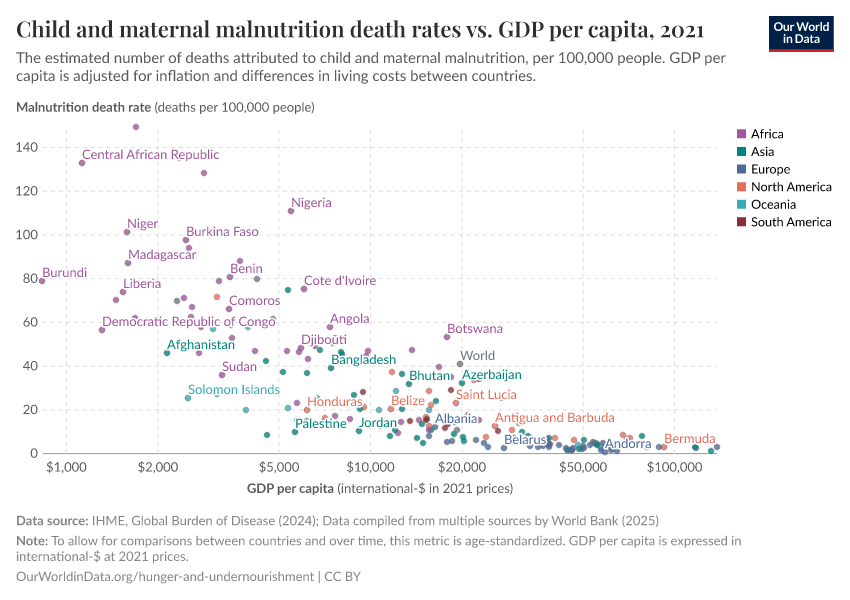
Undernourishment in mothers and children is a leading risk factor for death and other poor health outcomes.
The UN has set a global target as part of the Sustainable Development Goals to “end hunger by 2030“. While the world has progressed in past decades, we are far from reaching this target.
On this page, you can find our data, visualizations, and writing on hunger and undernourishment. It looks at how many people are undernourished, where they are, and other metrics used to track food security.
Key insights on Hunger and Undernourishment
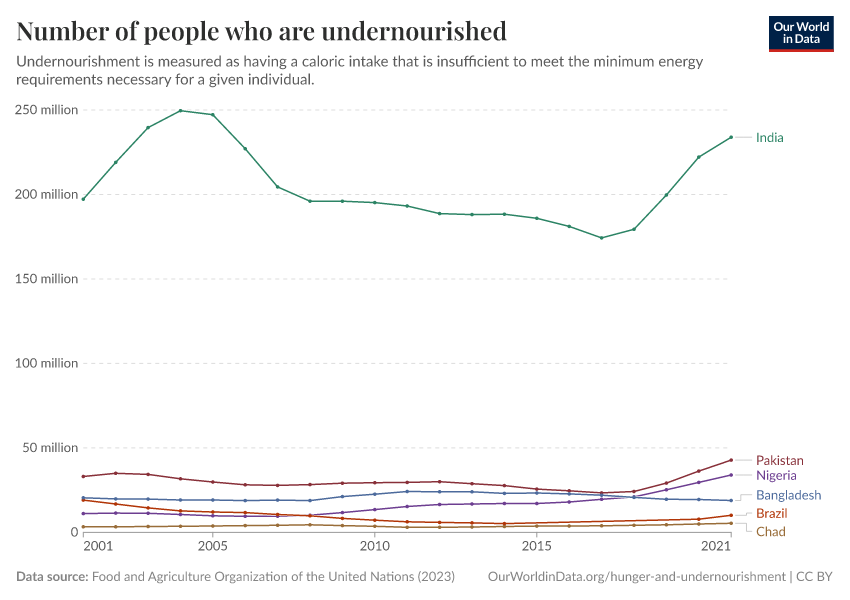
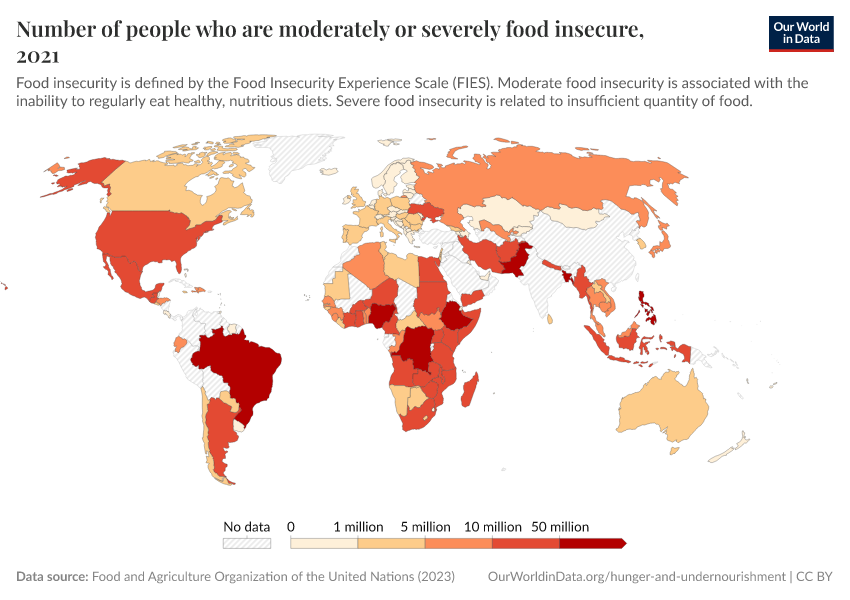
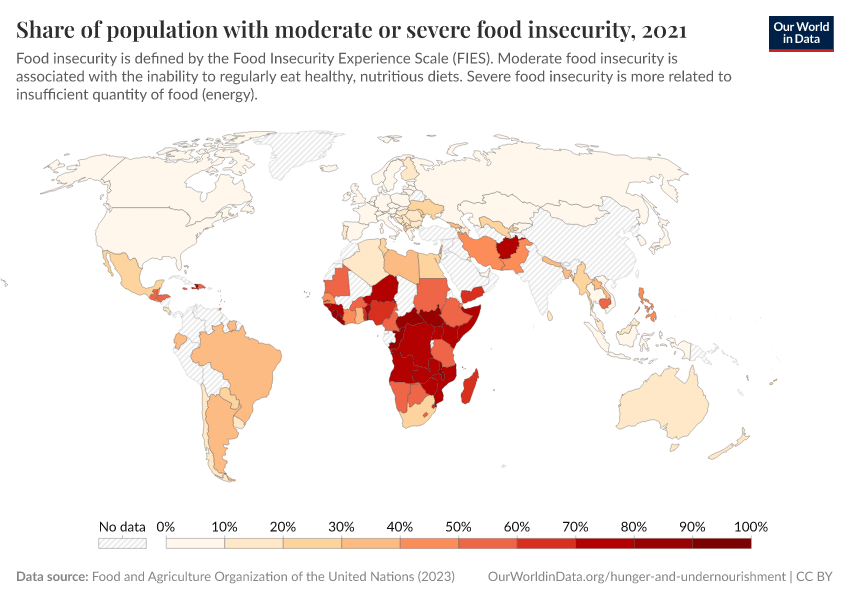
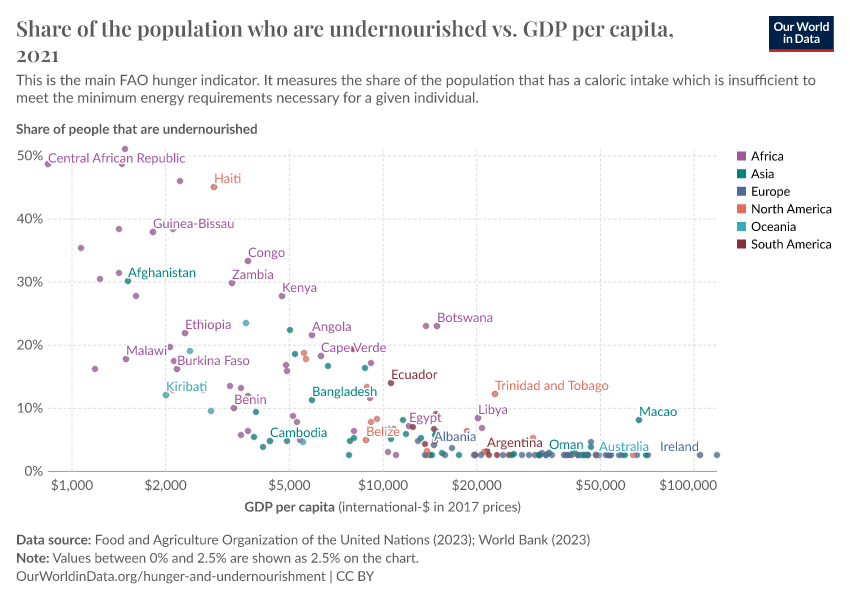
Almost one-in-ten people in the world do not get enough to eat
Hunger – also known as undernourishment – is defined as not consuming enough calories to maintain a normal, active, healthy life.
The world has made much progress in reducing global hunger in recent decades — we will see this in the following key insight. But we are still far away from an end to hunger. Tragically, nearly one-in-ten people still do not get enough food to eat.
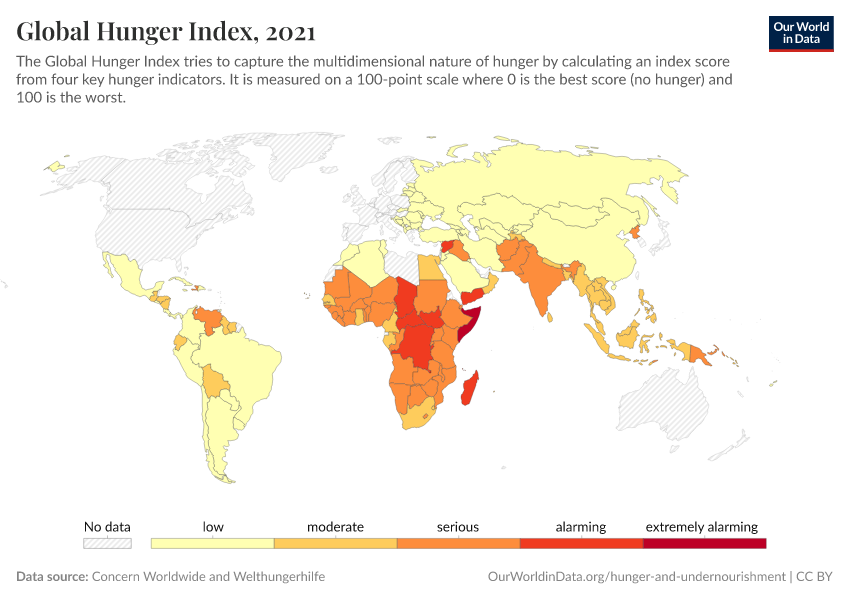
The share of the undernourished population is shown globally and by region in the chart.
You can see that rates of hunger are highest in Sub-Saharan Africa. South Asia has much higher rates than the Americas and East Asia. Rates in North America and Europe are below 2.5%. However, the FAO shows this as “2.5%” rather than the specific point estimate.
What you should know about this data
- Undernourishment is solely determined by the sufficiency of energy (calorie) intake. It does not consider the quality or diversity of someone’s diet.
- You can read more about this metric in our article What is undernourishment and how is it measured?

The world has made significant progress against hunger, but this has slowed
Rates of undernourishment fell quickly during the 20th and early 21st centuries.
The UN FAO estimated that one-in-three people in ‘developing countries’ suffered from hunger in 1970. Rates then plummeted, reaching 12% in 2015.
In the last few years, the FAO has adapted its methodology for estimating undernourishment and no longer updates this long-term series from the 1970s.
However, we can see from more recent data – shown in the previous key insight – that declines have slowed across most regions in the last decade.
Rates of undernourishment are much lower than they were in the past but are still far away from zero.
What you should know about this data
- Undernourishment is solely determined by the sufficiency of energy (calorie) intake. It does not consider the quality or diversity of someone’s diet.
- The FAO maintained a constant definition of "developing countries" throughout the data series, with the following definition: "Includes all countries other than developed countries, namely: all countries in Africa except South Africa, all countries in Asia except Israel and Japan, all countries in Oceania except Australia and New Zealand, and all countries in North and Central America except Canada and USA, and all countries in South America."
- Figures for 1970 and 1980 are the average between two FAO estimates from annual "State of Food Insecurity in the World" reports in 2006 and 2010. Therefore, these estimates should be interpreted cautiously but have been included for a longer-term perspective on reduction trends.

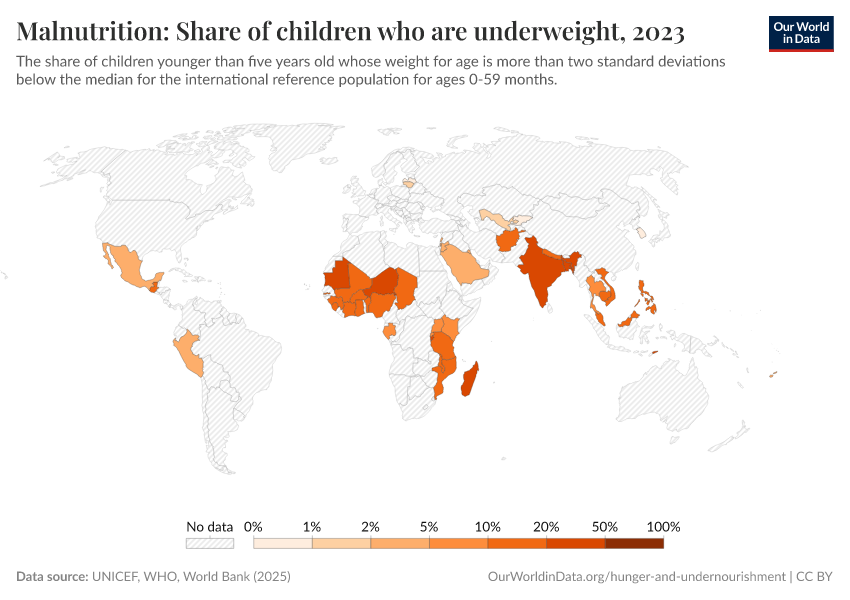
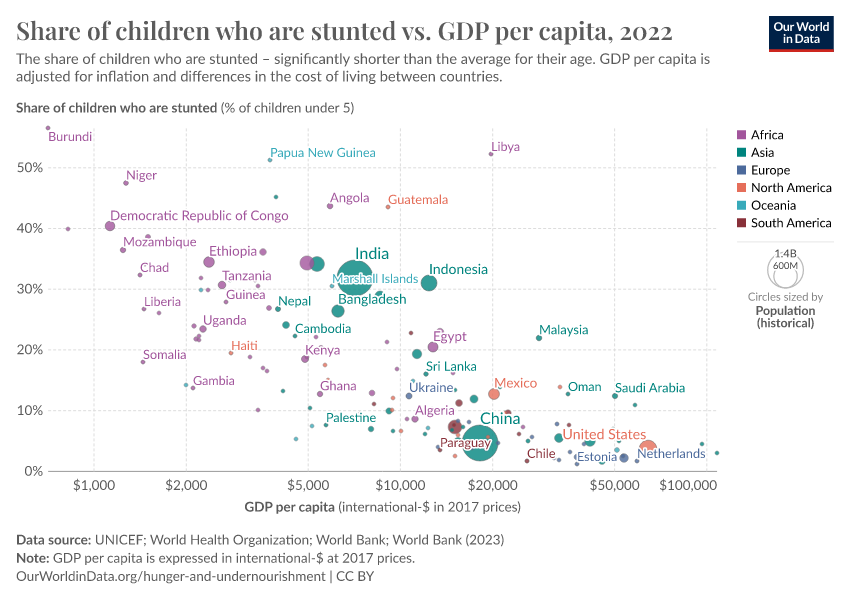
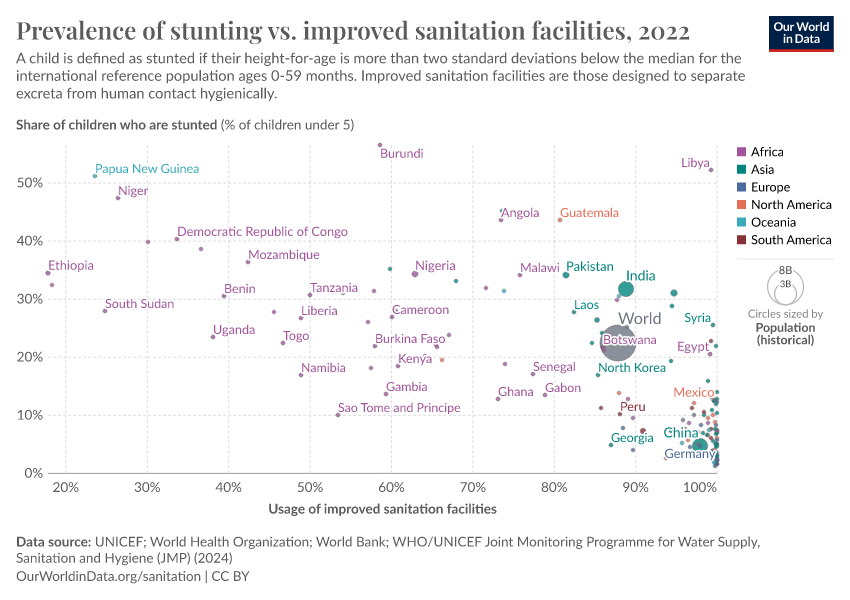
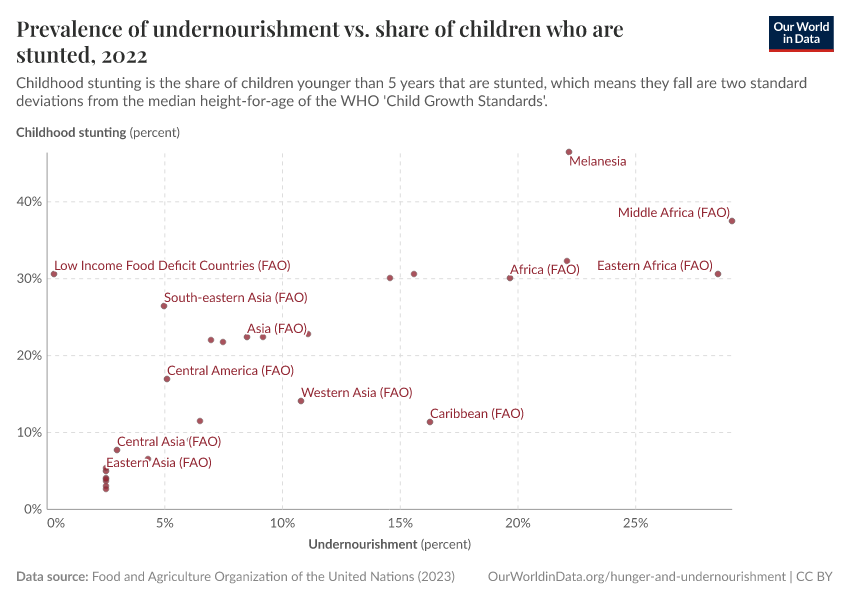
Many children suffer from stunting or wasting due to poor nutrition
Hunger and malnutrition can present themselves in several ways. Poor health outcomes for mothers and children are essential ones.
The World Health Organization (WHO) and UN FAO measure two critical signs of malnutrition in children.
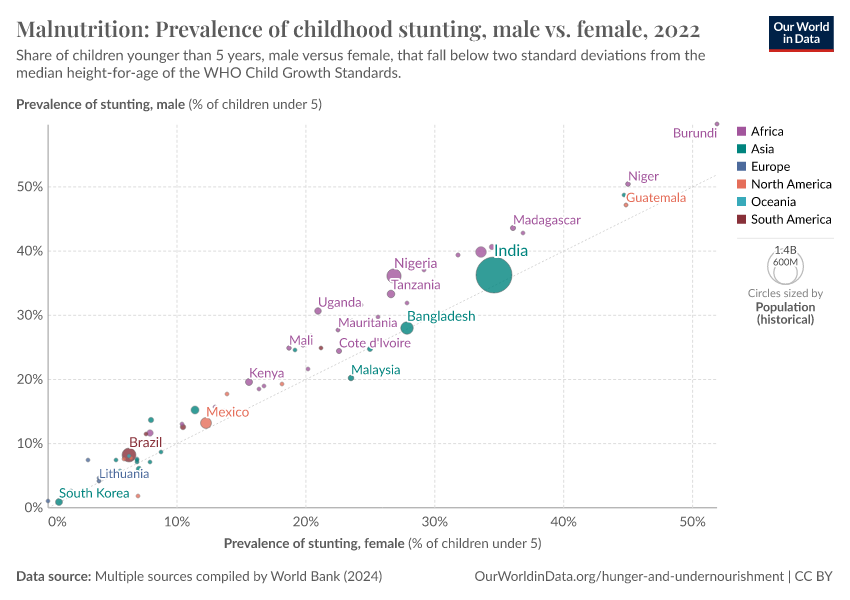
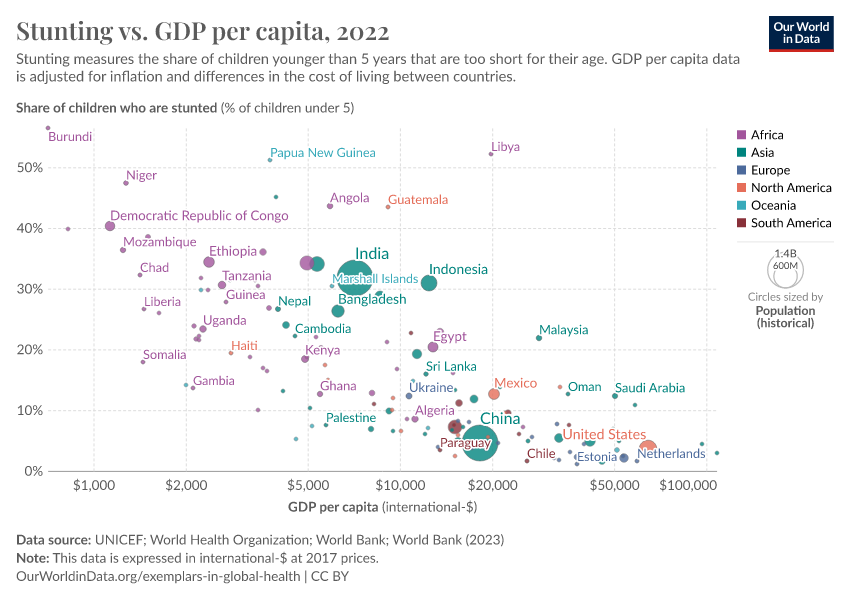
One is stunting. This is when a child is too short for their age. This indicates that a lack of food has hindered their growth and development.
Stunting is not just an issue during childhood. For some children, it has long-term consequences that can persist throughout their life, affecting physical and cognitive development.
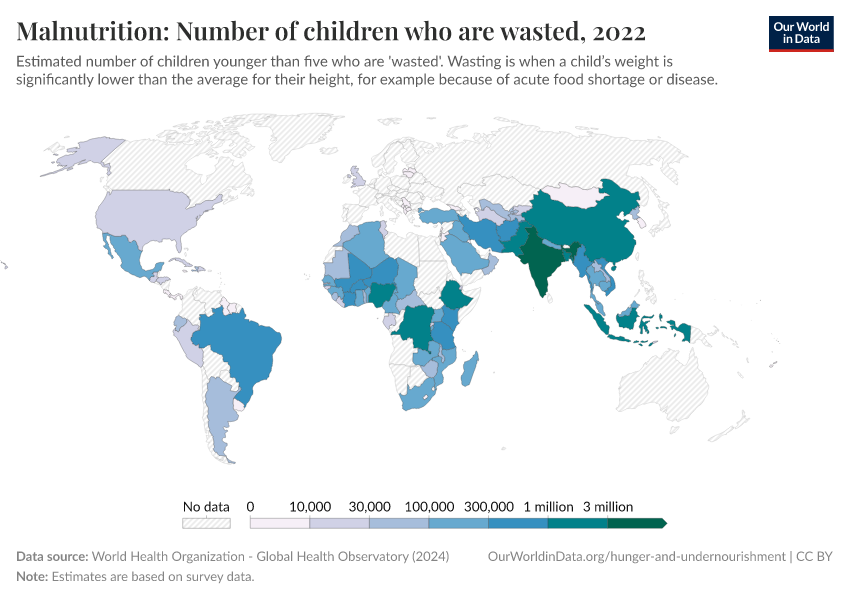
The second is wasting. This is when a child’s weight is too low for their height.
Wasting is a sign that a child has experienced short periods of undernutrition, resulting in significant wastage of muscle and fat tissue. This means their weight is very low for their height.
Many children across the world are still malnourished. In the chart, you can see rates of stunting. In some countries, over one-third and up to one-half of children are stunted.
→ Read more about childhood stunting in our article What is childhood stunting?.
→ Read more about childhood wasting in our article What is childhood wasting?.
What you should know about this data
- ‘Stunting’ and ‘Wasting’ are key metrics used by the World Health Organization (WHO) and the Food and Agriculture Organization of the United Nations (UN FAO) to track child malnutrition.
- ‘Stunting’ is measured based on a child’s height relative to age. The WHO produces ‘Expected Healthy Growth Curves’ for child growth. If a child’s height is more than two standard deviations below the median height on this curve, they are defined as ‘stunted’. Read more about childhood stunting in our article What is childhood stunting?
- ‘Wasting’ is measured based on a child’s weight relative to height. The WHO produces ‘Expected Healthy Growth Curves’ for child growth. If a child’s height is more than two standard deviations below the median height on this curve, they are defined as ‘stunted’. The WHO produces ‘Expected Healthy Growth Curves’ for child growth. If a child’s weight relative to their height is more than two standard deviations below the median, they are defined as ‘wasted’. Read more about childhood wasting in our article What is childhood wasting?

Research & Writing
Definitions and concepts of hunger and malnutrition
Other articles related to hunger
Key Charts on Hunger & Undernourishment
See all charts on this topic


Featured Data on Hunger & Undernourishment
Cite this work
Our articles and data visualizations rely on work from many different people and organizations. When citing this topic page, please also cite the underlying data sources. This topic page can be cited as:
Hannah Ritchie, Pablo Rosado, and Max Roser (2023) - “Hunger and Undernourishment” Published online at OurWorldinData.org. Retrieved from: 'https://ourworldindata.org/hunger-and-undernourishment' [Online Resource]BibTeX citation
@article{owid-hunger-and-undernourishment,
    author = {Hannah Ritchie and Pablo Rosado and Max Roser},
    title = {Hunger and Undernourishment},
    journal = {Our World in Data},
    year = {2023},
    note = {https://ourworldindata.org/hunger-and-undernourishment}
}
Reuse this work freely
All visualizations, data, and articles produced by Our World in Data are completely open access under the Creative Commons BY license. You have the permission to use, distribute, and reproduce these in any medium, provided the source and authors are credited.
The data produced by third parties and made available by Our World in Data is subject to the license terms from the original third-party authors. We will always indicate the original source of the data in our documentation, so you should always check the license of any such third-party data before use and redistribution.
All of our charts can be embedded in any site.