Alcohol Consumption
Who consumes the most alcohol? How has consumption changed over time? And what are the health impacts?
This article was first published in April 2018. We made minor changes to the text in January 2024.
Alcohol has historically, and continues to, hold an important role in social engagement and bonding for many. Social drinking or moderate alcohol consumption for many is pleasurable.
However, alcohol consumption – especially in excess – is linked to a number of negative outcomes: as a risk factor for diseases and health impacts, crime, road incidents, and, for some, alcohol dependence.
This topic page looks at the data on global patterns of alcohol consumption, patterns of drinking, beverage types, the prevalence of alcoholism, and consequences, including crime, mortality, and road incidents.
Related topics:
Data on other drug use can be found on our full topic page here.
Drug use disorders are often classified within the same category as mental health disorders — research and data on mental health can be found on our topic page here.
Support for alcohol dependency
At the end of this topic page, you will find additional resources and guidance if you, or someone you know, needs support in dealing with alcohol dependency.
See all interactive charts on Alcohol Consumption ↓
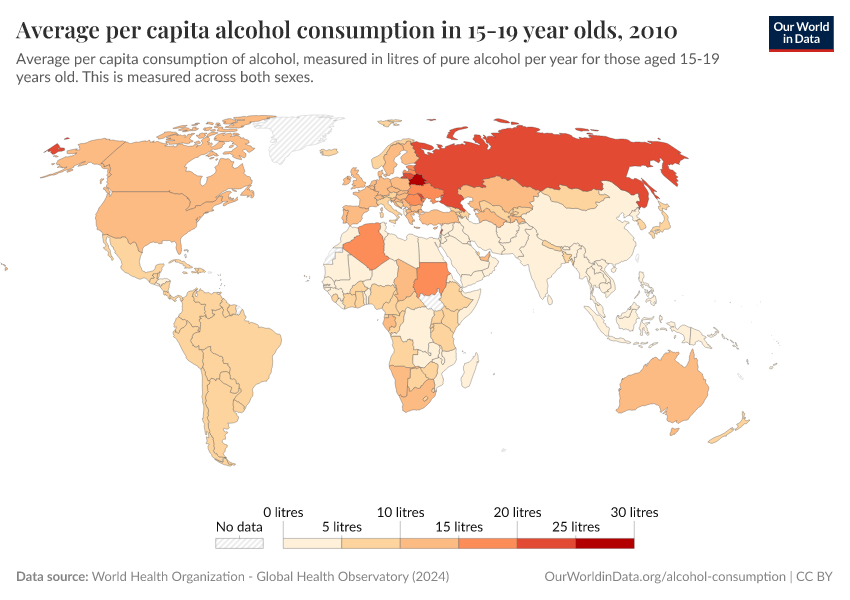
Alcohol consumption across the world today
This interactive map shows the annual average alcohol consumption of alcohol, expressed per person aged 15 years or older. To account for the differences in alcohol content of different alcoholic drinks (e.g., beer, wine, spirits), this is reported in liters of pure alcohol per year.
To make this average more understandable, we can express it in bottles of wine. Wine contains around 12% pure alcohol per volume1 so that one liter of wine contains 0.12 liters of pure alcohol. So, a value of 6 liters of pure alcohol per person per year is equivalent to 50 liters of wine. Or, 67 standard bottles of wine (which have a volume of 0.75 liters).
As the map shows, the average per capita alcohol consumption varies widely globally.
We see large geographical differences: Alcohol consumption across North Africa and the Middle East is particularly low — in many countries, close to zero. At the upper end of the scale, alcohol intake across Europe is higher.

Share of adults who drink alcohol
This interactive map shows the share of adults who drink alcohol. This is given as the share of adults aged 15 years and older who have drunk alcohol within the previous year.
In many countries, the majority of adults drink some alcohol. Across Europe, for example, more than two-thirds do in most countries.
Again, the prevalence of drinking across North Africa and the Middle East is notably lower than elsewhere. Typically, 5 to 10 percent of adults across these regions drank in the preceding year, and in a number of countries, this was below 5 percent.

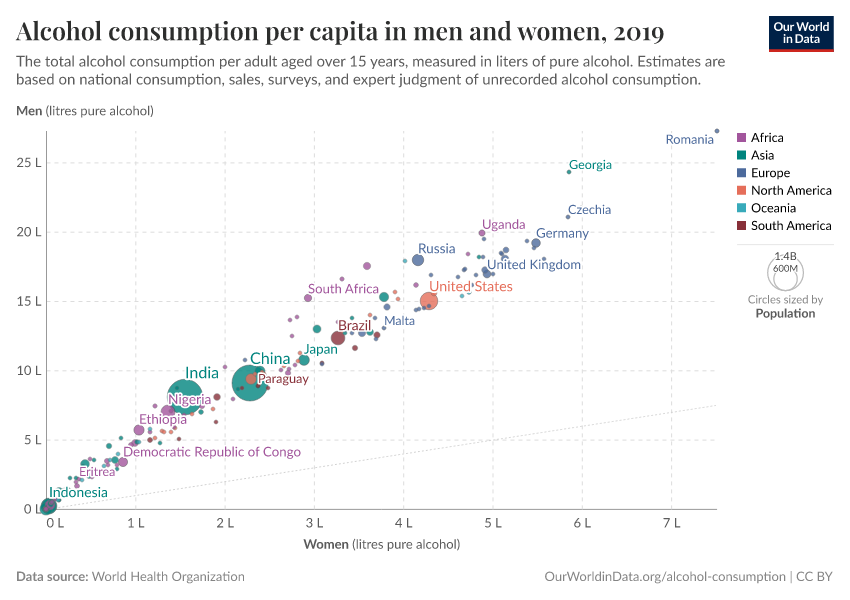
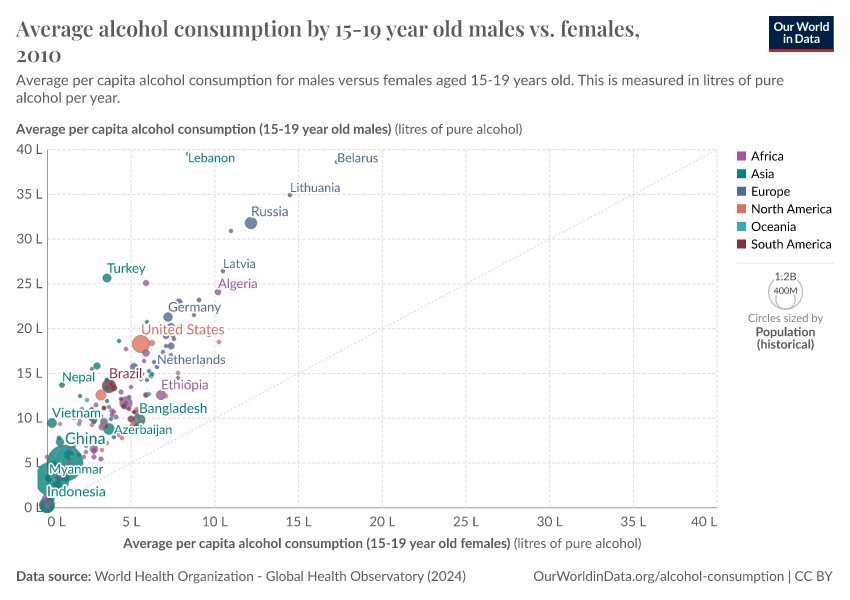
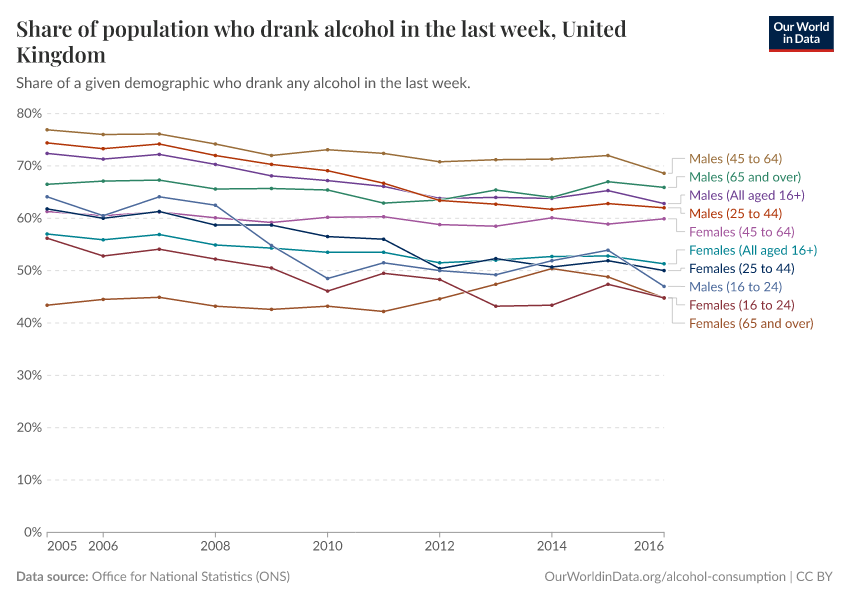
Alcohol consumption by sex
When we look at gender differences, we see that in all countries, men have a higher alcohol consumption than women.
In a related chart, you can see the share who drink alcohol by gender and age group in the UK.

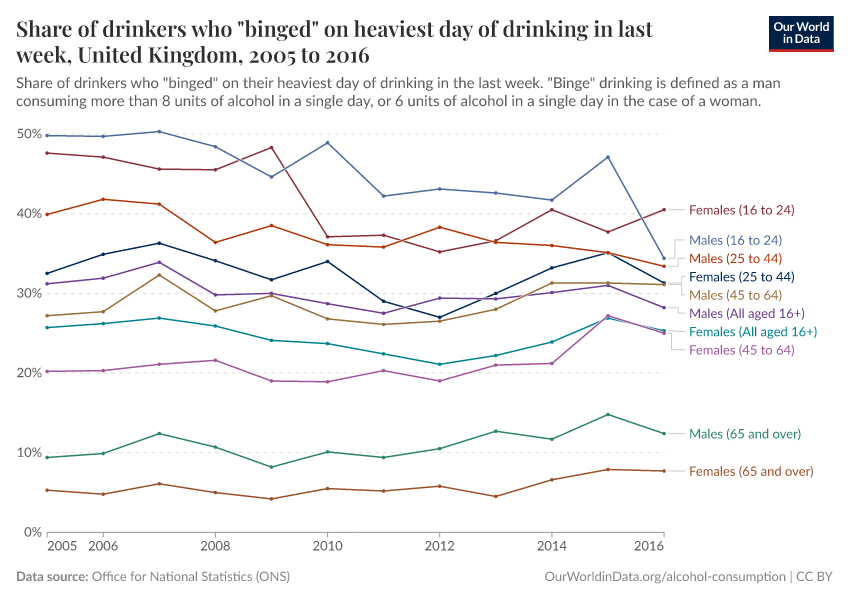
Heavy drinking sessions
Alcohol consumption – whilst a risk factor for a number of health outcomes – typically has the greatest negative impacts when consumed within heavy sessions.
This pattern of drinking is often termed 'binging,' where individuals consume large amounts of alcohol within a single session versus small quantities more frequently.
Heavy episodic drinking is defined as the proportion of adult drinkers who have had at least 60 grams or more of pure alcohol on at least one occasion in the past 30 days. An intake of 60 grams of pure alcohol is approximately equal to 6 standard alcoholic drinks.
The map shows heavy drinkers – those who had an episode of heavy drinking in the previous 30 days – as a share of total drinkers (i.e., those who have drunk less than one alcoholic drink in the last 12 months are excluded).
The comparison of this map with the previous maps makes clear that heavy drinking is not necessarily most common in the same countries where alcohol consumption is most common.
Data on the prevalence of binge drinking by age and gender in the UK can be found here, and trends in heavy and binge drinking in the USA can be found here.

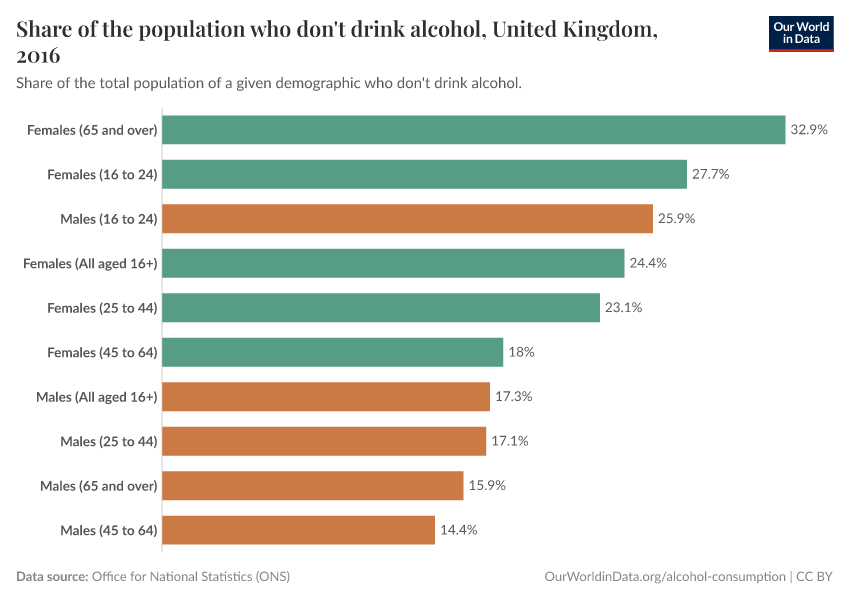
Share of adults who don't drink alcohol
Global trends on alcohol abstinence show a mirror image of drinking prevalence data. This is shown in the charts as the share of adults who had not drunk in the prior year and those who have never drunk alcohol.
Here, we see particularly high levels of alcohol abstinence across North Africa and the Middle East. In most countries in this region, the majority of adults have never drunk alcohol.


Data on the share who don't drink alcohol by gender and age group in the UK is available here.
Historical perspective on alcohol consumption
Total alcohol consumption over the long-run
The chart shows alcohol consumption since 1890 in a number of countries.
A century ago, some countries had much higher levels of alcohol consumption. In France in the 1920s, the average was 22.1 liters of pure alcohol per person per year. This equals 184 one-liter wine bottles per person per year.2 Note that in contrast to the modern statistics that are expressed in alcohol consumption per person older than 15 years, this includes children as well – the average alcohol consumption per adult was, therefore, even higher.

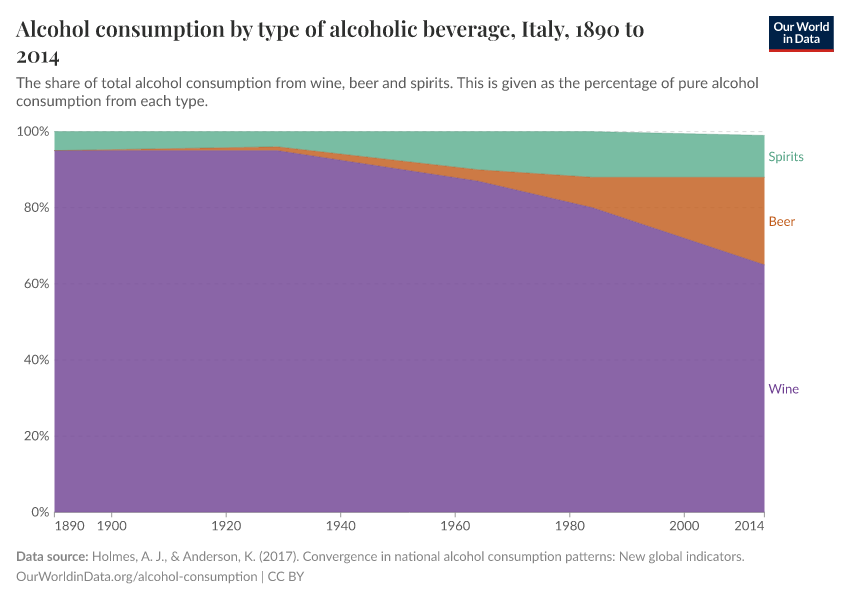
Alcohol consumption by type of alcoholic beverage
This chart shows the change in consumption of alcoholic beverages.
By default, the data for France is shown – in recent decades, here, the share of beer consumption increased to make up around a fifth of alcohol consumption in France.
With the change country feature, it is possible to view the same data for other countries. Sweden, for example, increased the share of wine consumption and, therefore, reduced the share of spirits.

Alcohol consumption in the United States since 1850
Long-run data on alcohol consumption from the United States gives us one perspective of drinking since 1850. In the chart, we see the average consumption (in liters of ethanol) of different beverage types per person in the USA since the mid-nineteenth century.
Over this long time period, we see that per capita drinking quantities have been relatively constant — typically averaging around 8 to 9 liters per year. Over the period 1920-1933, there was a ban on the production, importation, transportation, and sale of alcoholic beverages in the United States (known as the 'National Alcohol Prohibition'). Since the statistics here reflect reported sales and consumption statistics, they assume zero consumption of alcohol over this time. However, there is evidence that alcohol consumption continued through the black market and illegal sales, particularly in the sales of spirits. It's estimated that at the beginning of Prohibition, alcohol consumption decreased to approximately 30 percent of pre-prohibition levels but slowly increased to 60-70 percent by the end of the period.3
As we see, following prohibition, levels of alcohol consumption returned to similar levels as in the pre-prohibition period.

Global beer consumption
The charts show global consumption of beer, first in terms of beer as a share of total alcohol consumption, and then the estimated average consumption per person.
Both are measured in terms of pure alcohol/ethanol intake rather than the total quantity of the beverage. Beer contains around 5% of pure alcohol per volume1 so that one liter of beer contains 0.05 liters of pure alcohol. This means that 5 liters of pure alcohol equals 100 liters of beer.


Global wine consumption
The charts show global consumption of wine, first in terms of wine as a share of total alcohol consumption, and then the estimated average consumption per person.
Both are measured in terms of pure alcohol/ethanol intake rather than the total quantity of the beverage. Wine contains around 12% pure alcohol per volume, so that one liter of wine contains 0.12 liters of pure alcohol.


Global consumption of spirits
The charts show global consumption of spirits, which are distilled alcoholic drinks, including gin, rum, whisky, tequila, and vodka.
The first map shows this in terms of spirits as a share of total alcohol consumption. In many Asian countries, spirits account for most of total alcohol consumption.
The second map shows the estimated average consumption per person.
Both are measured in terms of pure alcohol/ethanol intake rather than the total quantity of the beverage.


Expenditures on alcohol and alcohol consumption by income
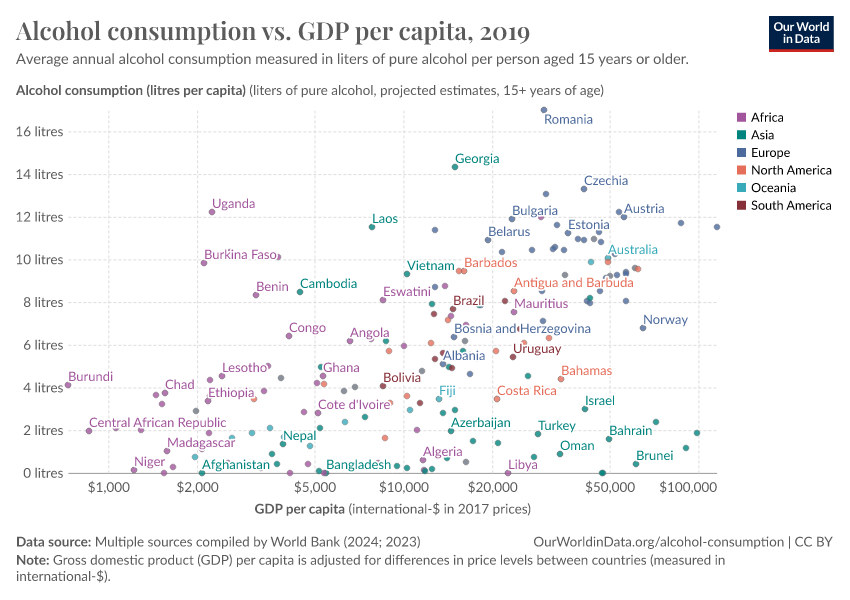
Alcohol consumption vs. income
Does alcohol consumption increase as countries get richer?
In the chart, we see the relationship between average per capita alcohol consumption – in liters of pure alcohol per year – versus gross domestic product (GDP) per capita across countries.
When we look at national averages in this way, there is no distinct relationship between income and alcohol consumption. As shown by clusters of countries (for example, Middle Eastern countries with low alcohol intake but high GDP per capita), we tend to see strong cultural patterns that tend to alter the standard income-consumption relationship we may expect.

However, when we look at consumption data within given countries, we sometimes do see a clear income correlation. Taking 2016 data in the UK as an example, we see that people within higher income brackets tend to drink more frequently. This correlation is also likely to be influenced by other lifestyle determinants and habits; the UK ONS also reports that when grouped by education status, those with a university tend to drink more in total and more frequently than those of lower education status. There are also differences when grouped by profession: individuals in managerial or professional positions tend to drink more frequently than those in intermediate or manual labor roles.4

We also find correlates in drinking patterns when we look at groupings of income, education or work status. Although those in lower income or educational status groups often drink less overall, they are more likely to have lower-frequency, higher-intensity drinking patterns. Overall, these groups drink less, but a higher percentage will drink heavily when they do.
Alcohol expenditure
This interactive chart shows the average share of household expenditure that is spent on alcohol.
Data on alcohol expenditure is typically limited to North America, Europe, and Oceania.

Alcohol expenditure over the long-term
This shows the expenditure on alcohol in the United States, differentiated by where the alcohol has been purchased and consumed.

The health impact of alcohol
Alcohol is responsible for many premature deaths each year
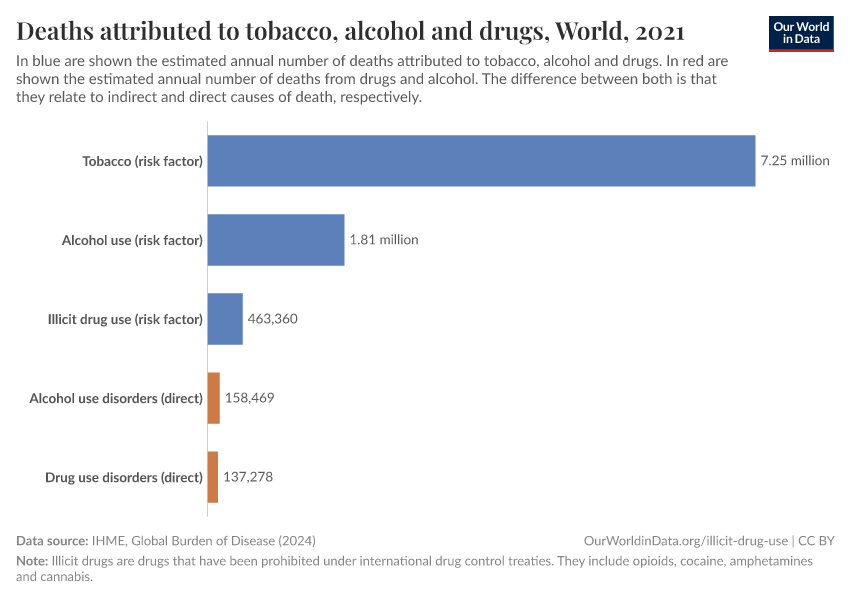
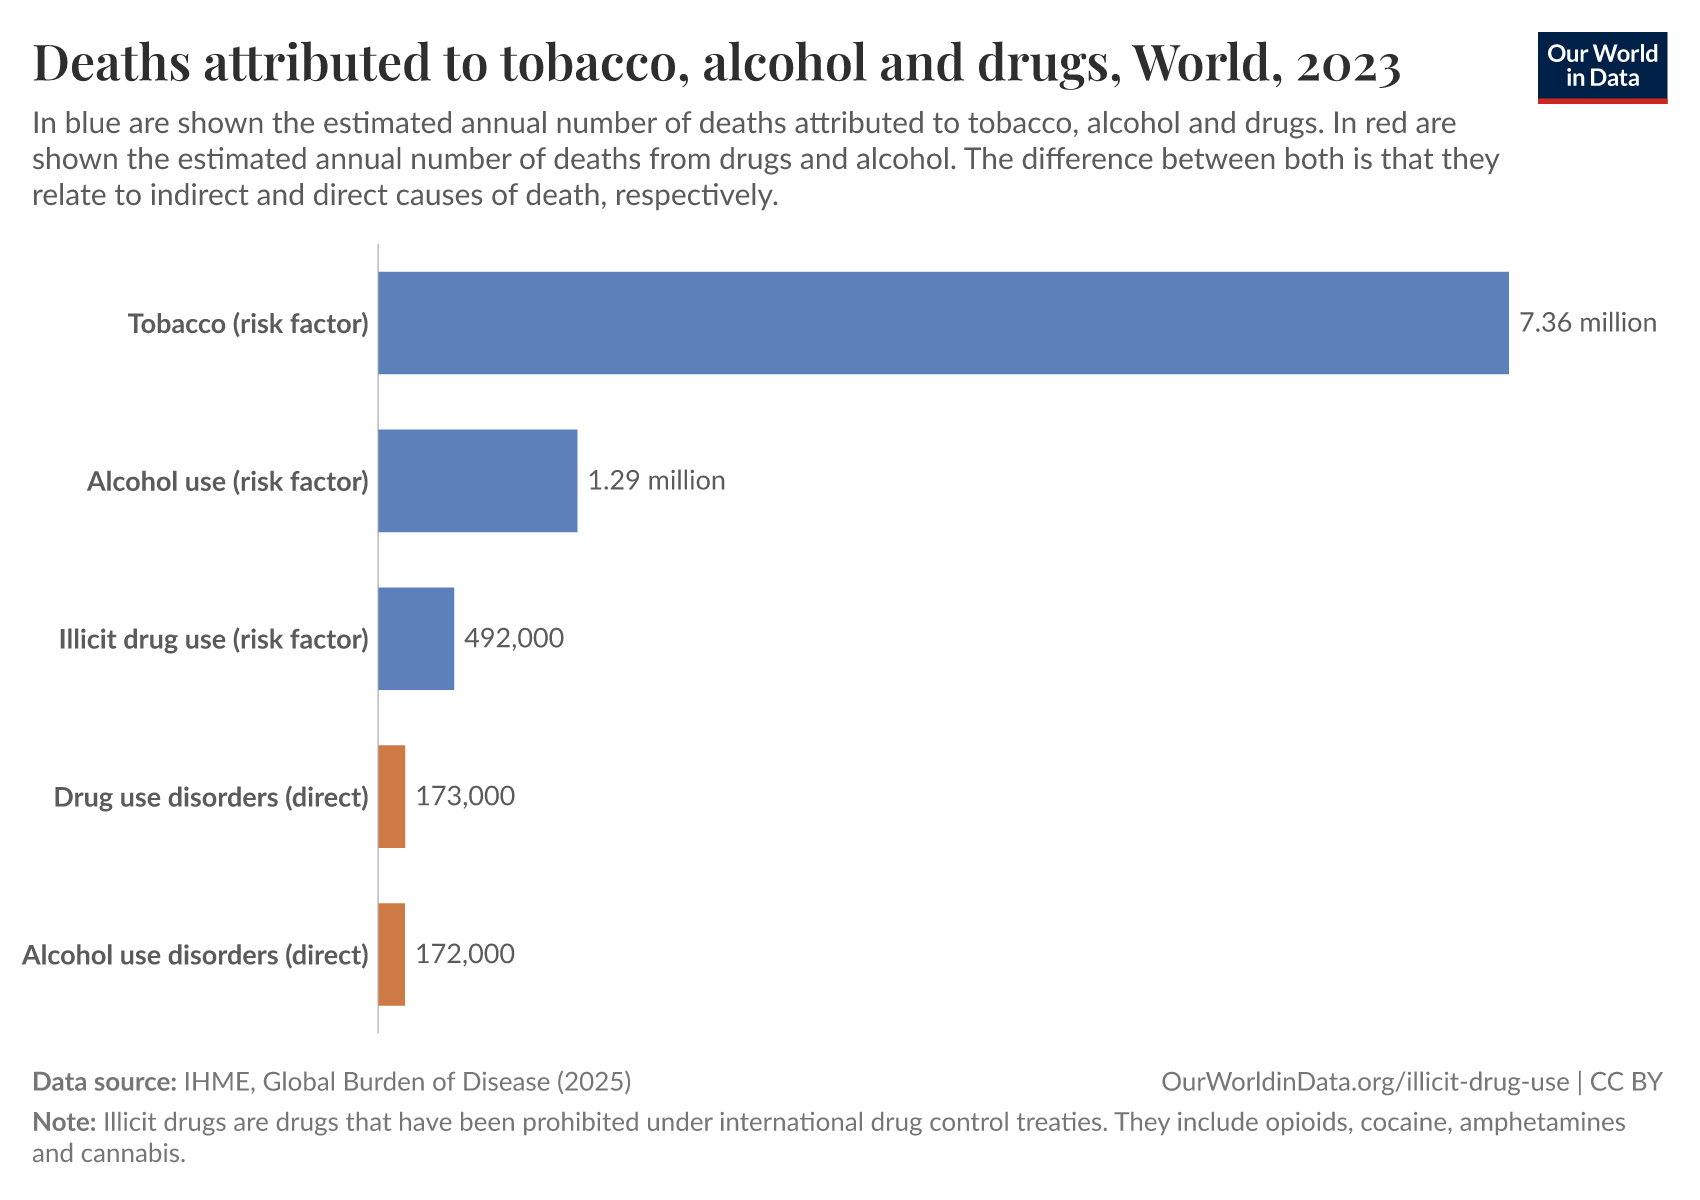
Alcohol is one of the world's largest risk factors for premature death.
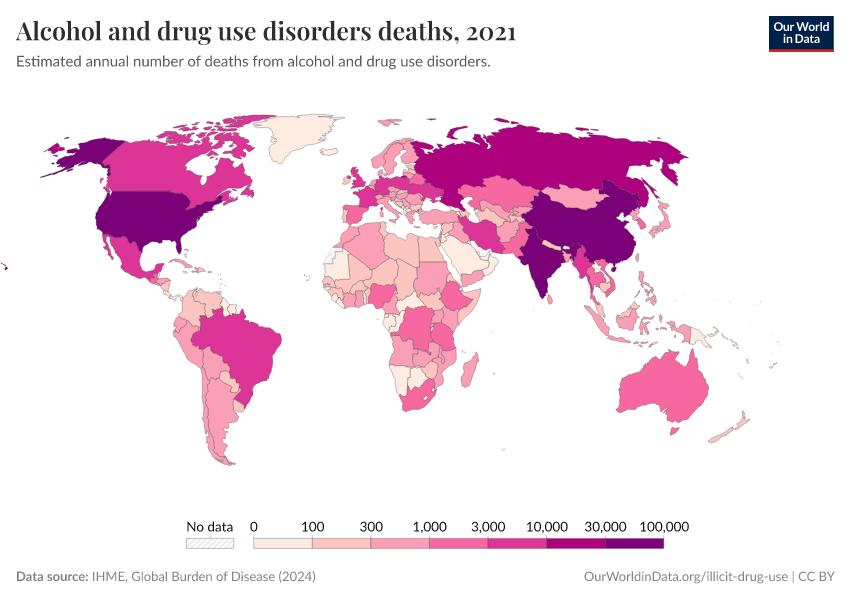
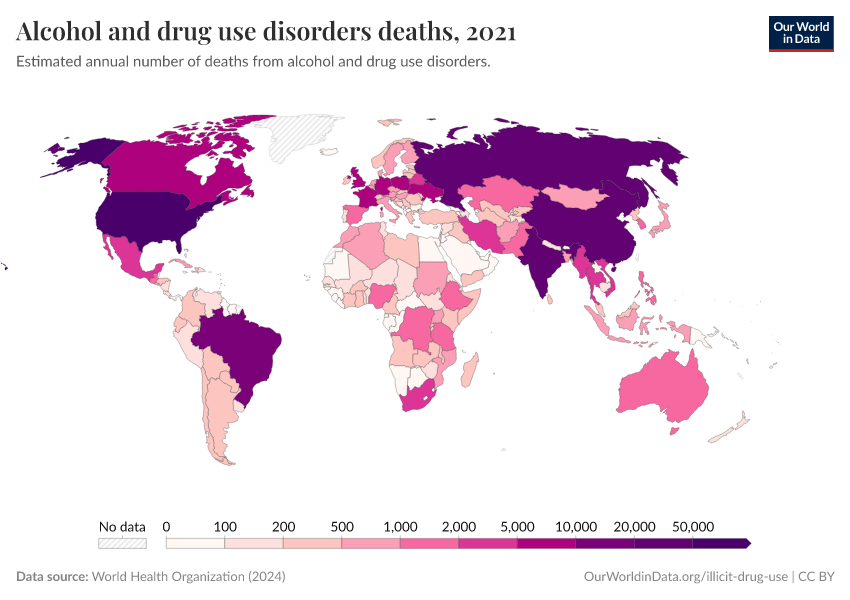
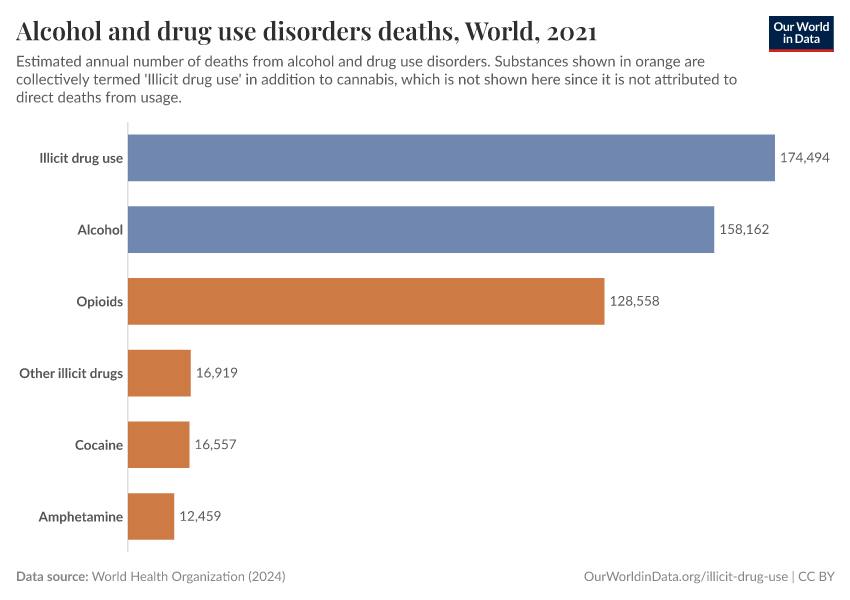
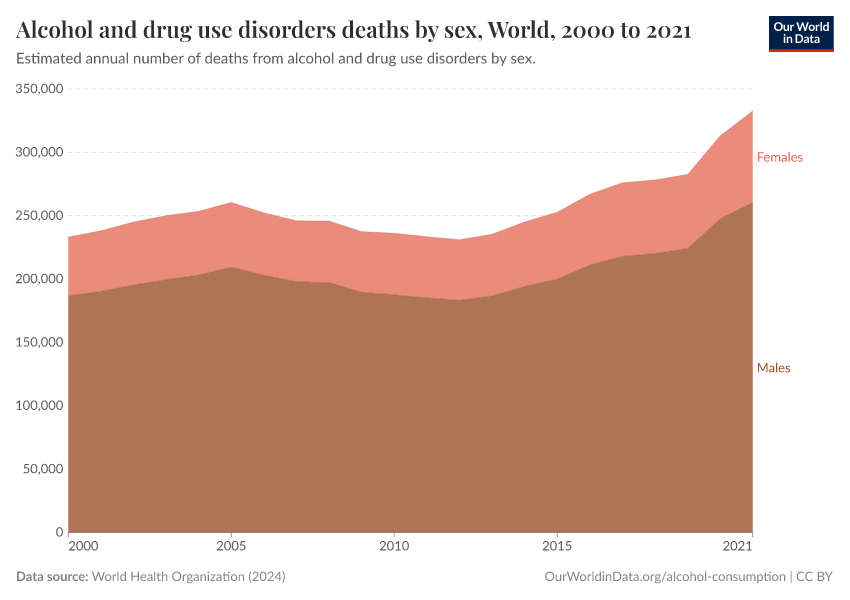
The Institute for Health Metrics and Evaluation (IHME), in its Global Burden of Disease study, provides estimates of the number of deaths attributed to the range of risk factors.5 In the visualization, we see the number of deaths per year attributed to each risk factor. This chart is shown for the global total but can be explored for any country or region using the "Change country or region" toggle.

Alcohol as a risk factor for mortality
Alcohol consumption is a known risk factor for a number of health conditions, and potential mortality cases. Alcohol consumption has a causal impact on more than 200 health conditions (diseases and injuries).
In the chart, we see estimates of the alcohol-attributable fraction (AAF), which is the proportion of deaths that are caused or exacerbated by alcohol (i.e., that proportion that would disappear if alcohol consumption was removed). We see that the proportion of deaths attributed to alcohol consumption is lower in North Africa and the Middle East and much higher in Eastern Europe.

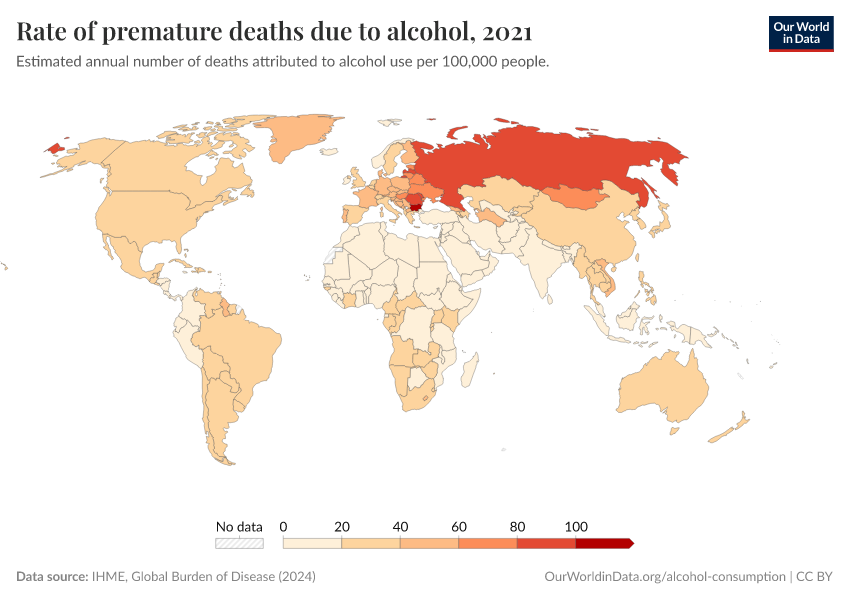
Rate of premature deaths due to alcohol
Shown here is the rate of premature deaths caused by alcohol.
Globally, the age-standardized death rate has declined from approximately 40 deaths per 100,000 people in the early 1990s to 30 deaths per 100,000 in 2019.

Alcoholism and alcohol use disorders
Alcohol use disorder (AUD) refers to the drinking of alcohol that causes mental and physical health problems.
Alcohol use disorder, which includes alcohol dependence, is defined in the WHO's International Classification of Diseases (available here).
At the end of this topic page, we provide a number of potential sources of support and guidance for those concerned about uncontrolled drinking or alcohol dependency.
A definite diagnosis of dependence should usually be made only if three or more of the following have been present together at some time during the previous year:
- (a) a strong desire or sense of compulsion to take the substance;
- (b) difficulties in controlling substance-taking behaviour in terms of its onset, termination, or levels of use;
- (c) a physiological withdrawal state when substance use has ceased or been reduced, as evidenced by: the characteristic withdrawal syndrome for the substance; or use of the same (or a closely related) substance with the intention of relieving or avoiding withdrawal symptoms;
- (d) evidence of tolerance, such that increased doses of the psychoactive substance are required in order to achieve effects originally produced by lower doses (clear examples of this are found in alcohol- and opiate-dependent individuals who may take daily doses sufficient to incapacitate or kill nontolerant users);
- (e) progressive neglect of alternative pleasures or interests because of psychoactive substance use, increased amount of time necessary to obtain or take the substance or to recover from its effects;
- (f) persisting with substance use despite clear evidence of overtly harmful consequences, such as harm to the liver through excessive drinking, depressive mood states consequent to periods of heavy substance use, or drug-related impairment of cognitive functioning; efforts should be made to determine that the user was actually, or could be expected to be, aware of the nature and extent of the harm.
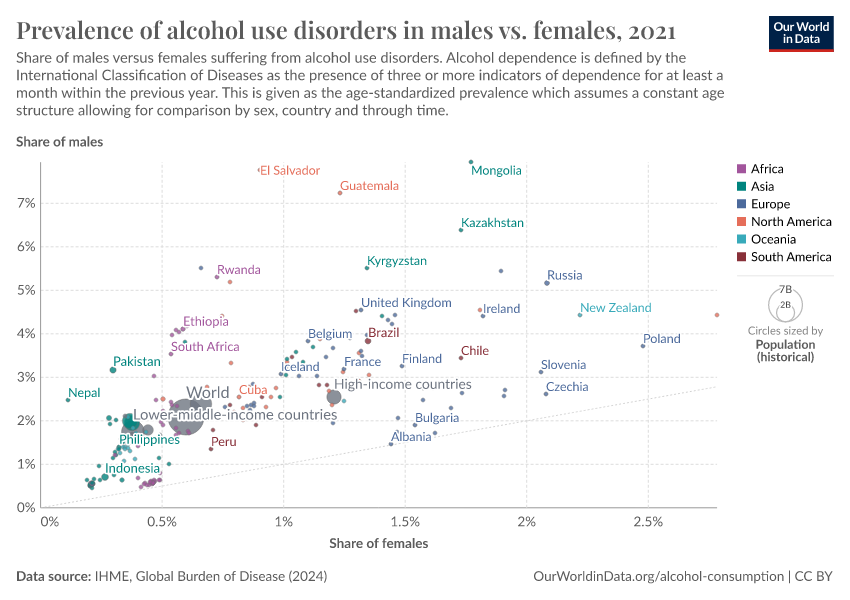
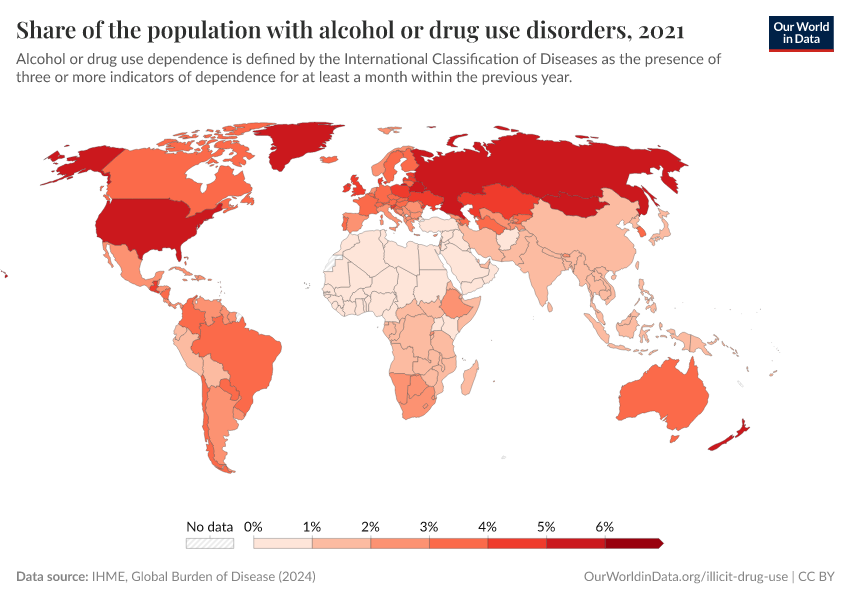
Prevalence of alcohol use disorders
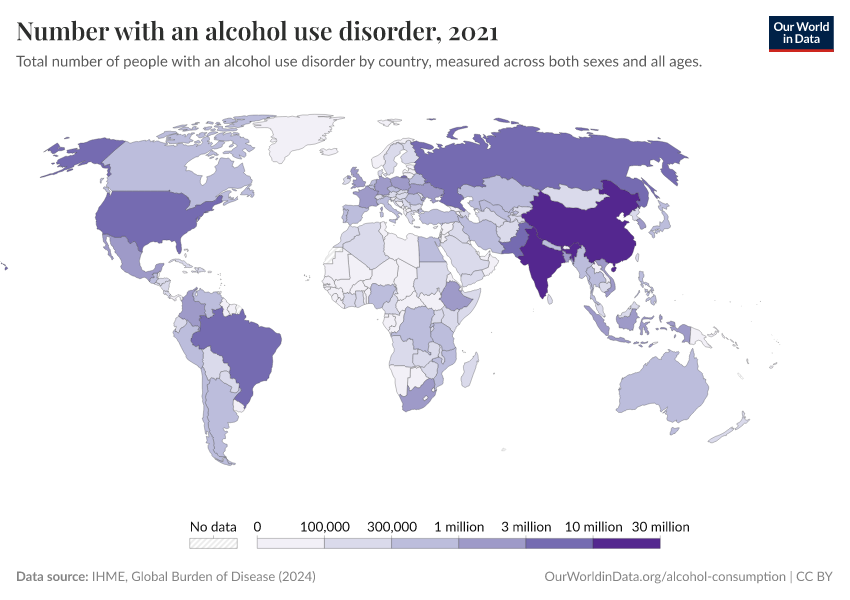
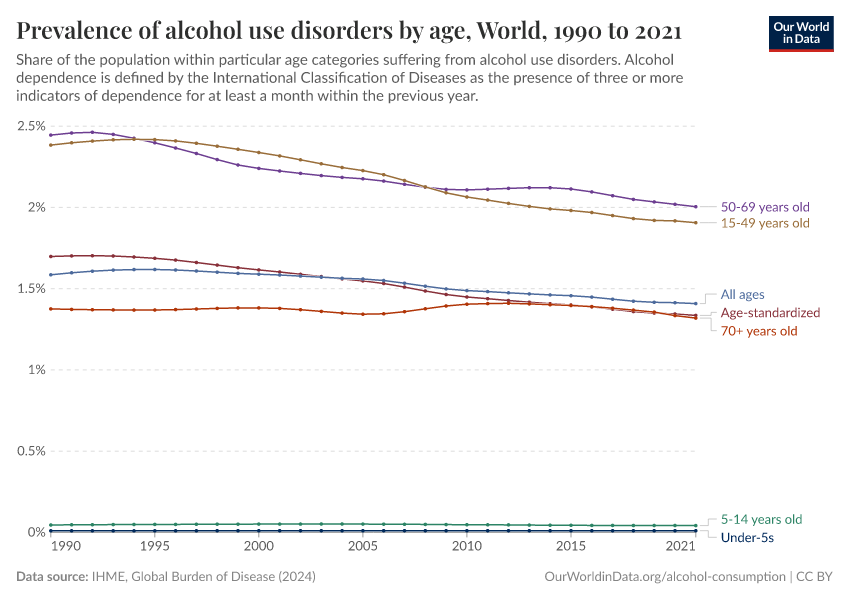
It's estimated that globally, around 1 percent of the population has an alcohol use disorder. At the country level, as shown in the chart, this ranges from around 0.5 to 5 percent of the population.
When we look at the variance in prevalence across age groups, we see that globally, the prevalence is highest in those aged between 15 and 49 years old.
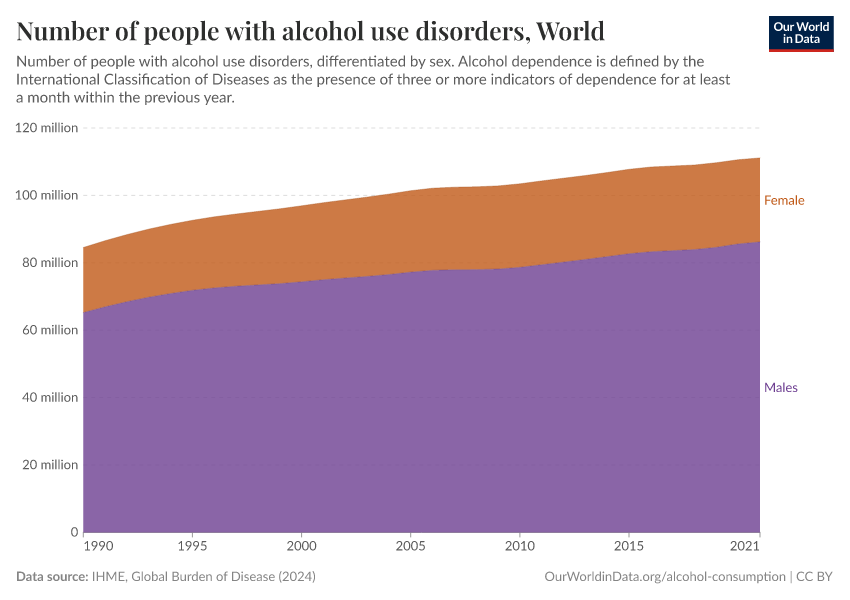
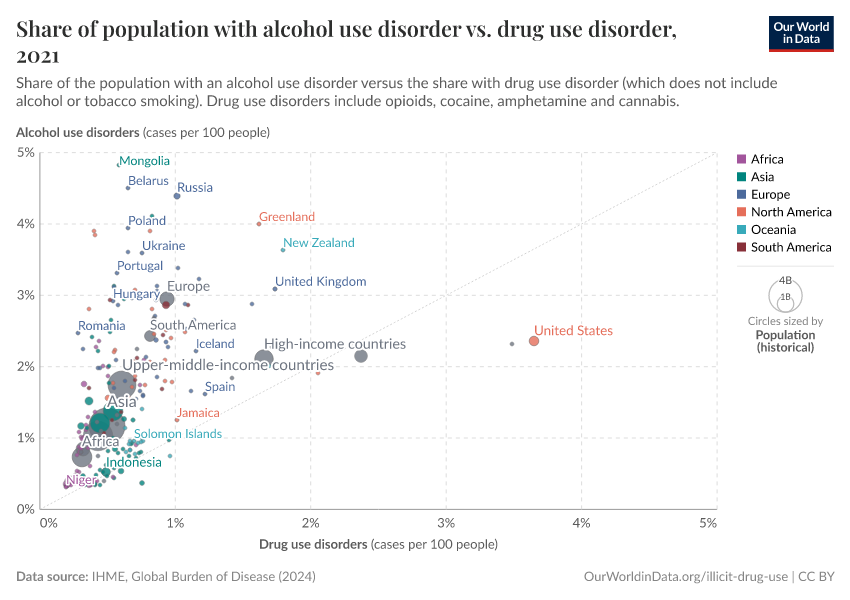
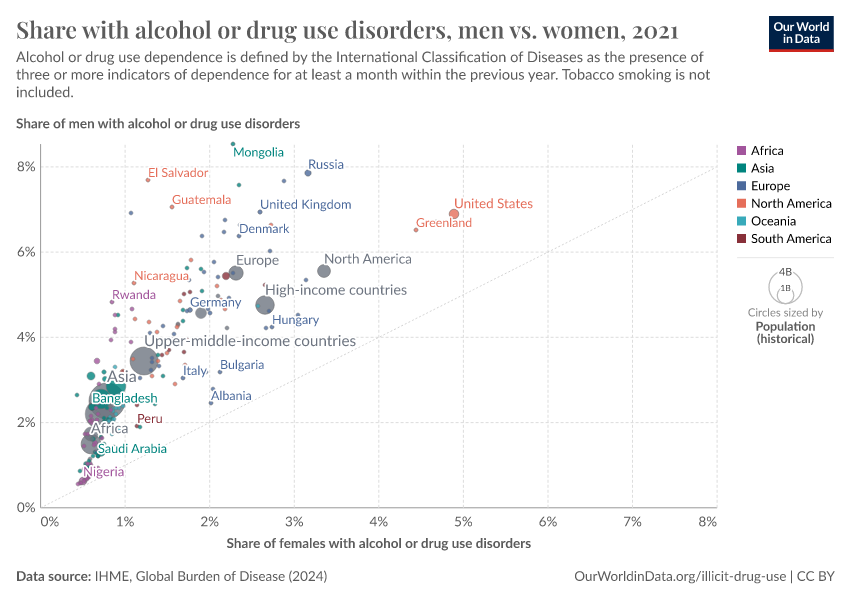
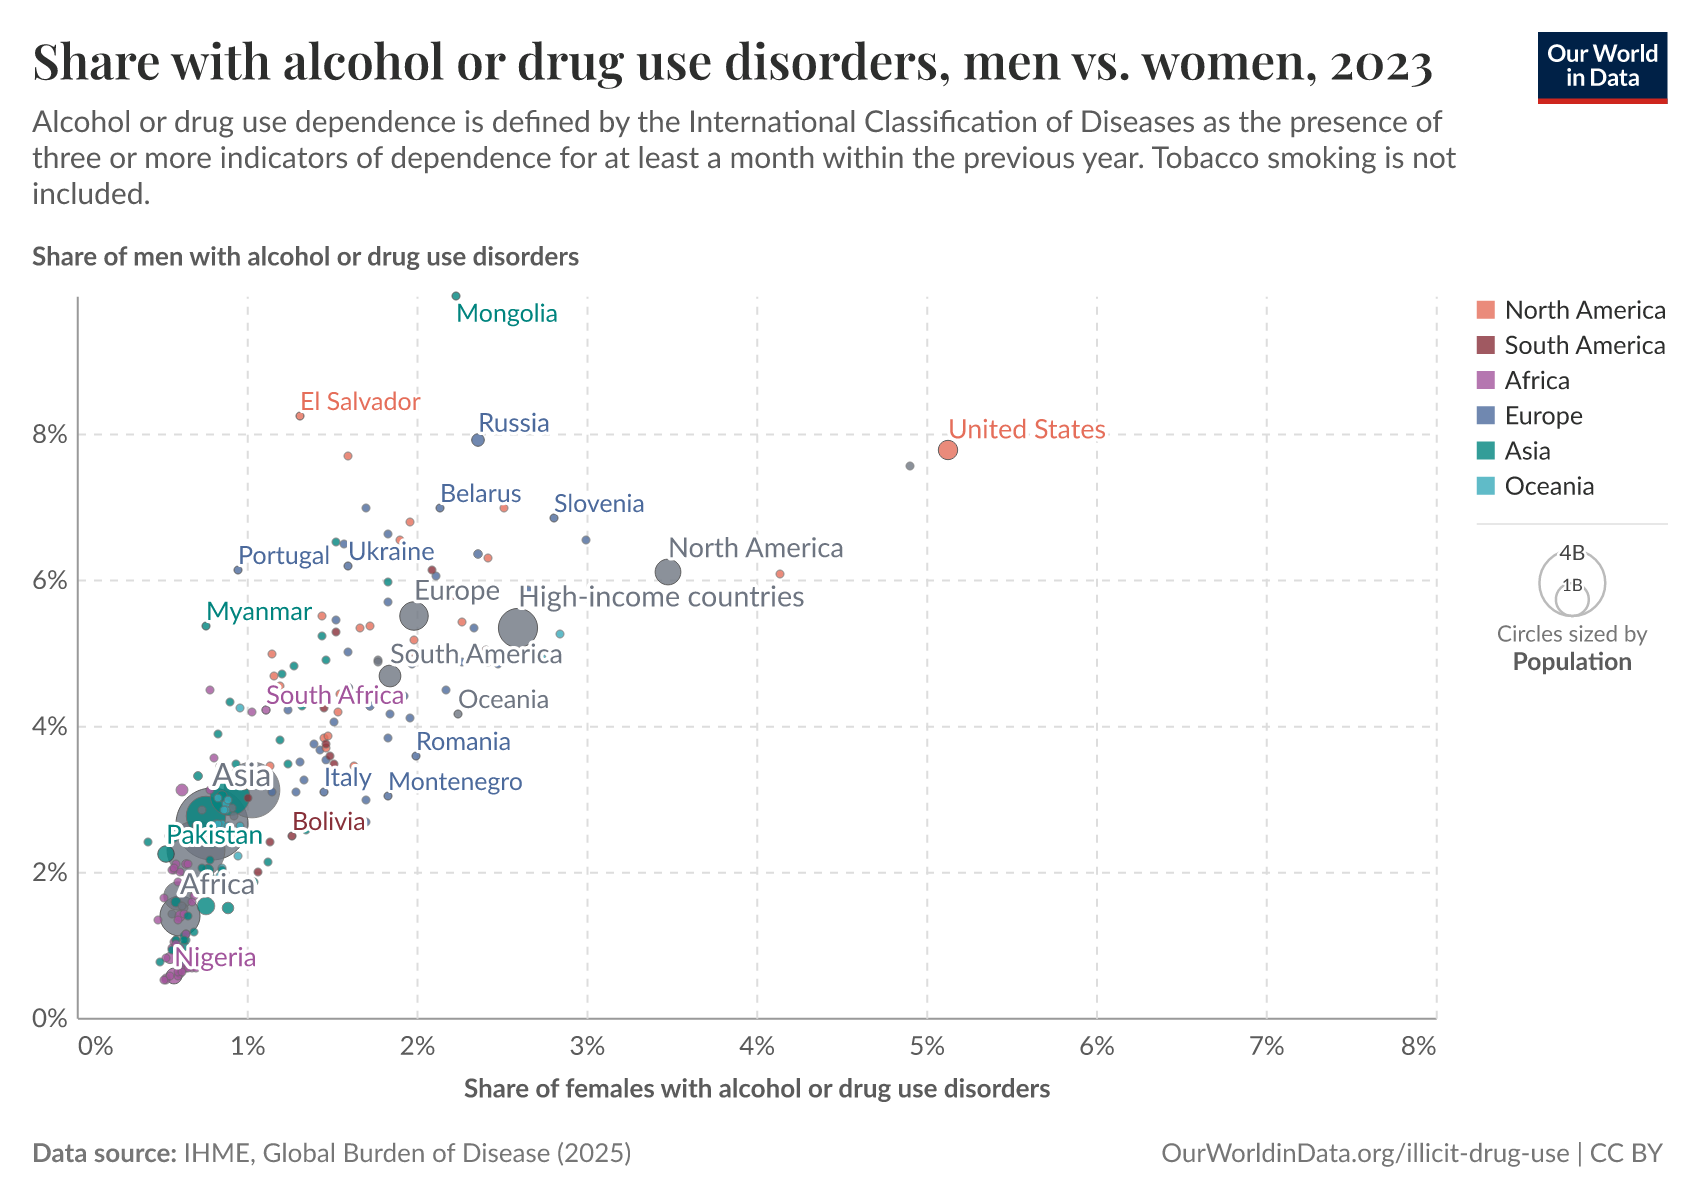
The breakdown of alcohol use disorders by gender for any country can be viewed here; the majority of people with alcohol use disorders – around three-quarters – are male.


The scatter plot compares the prevalence of alcohol use disorders in males versus that of females. The prevalence of alcohol dependence in men is typically higher than in women across all countries.
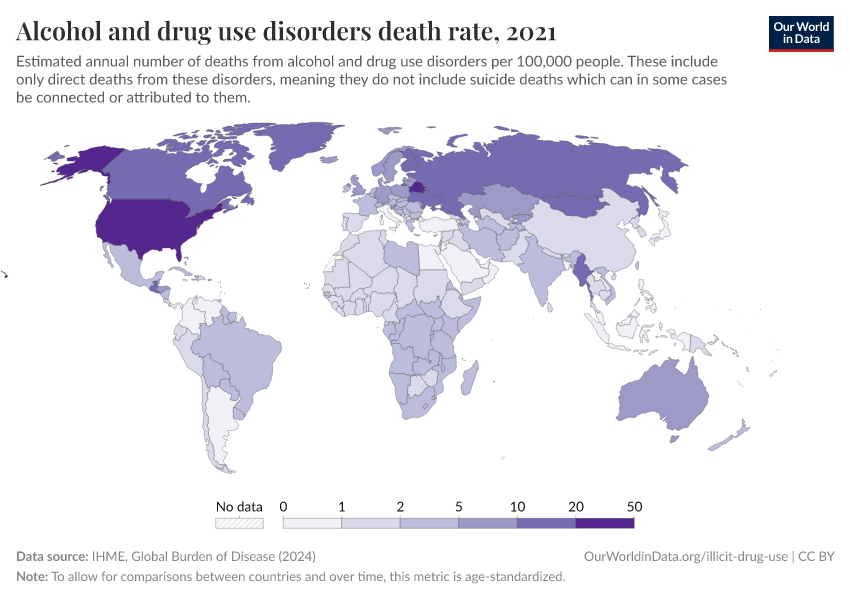
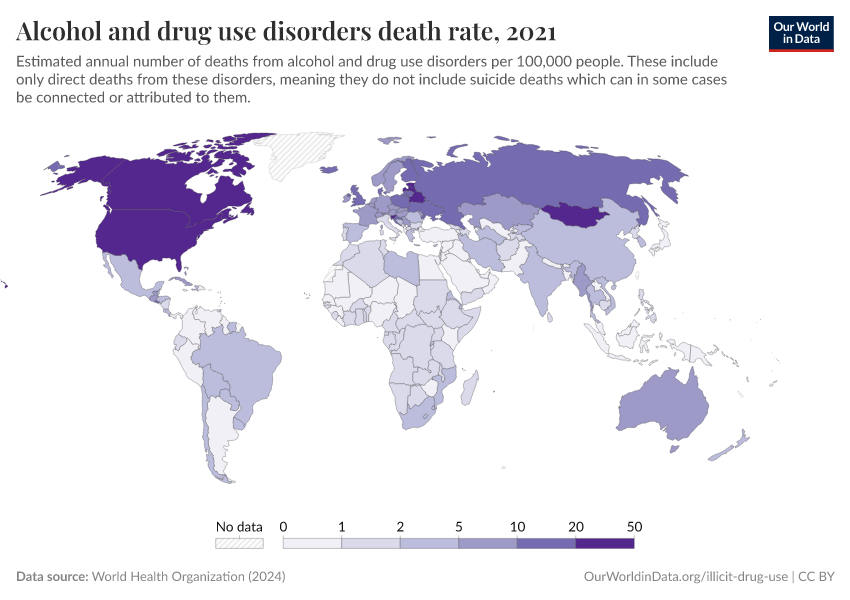
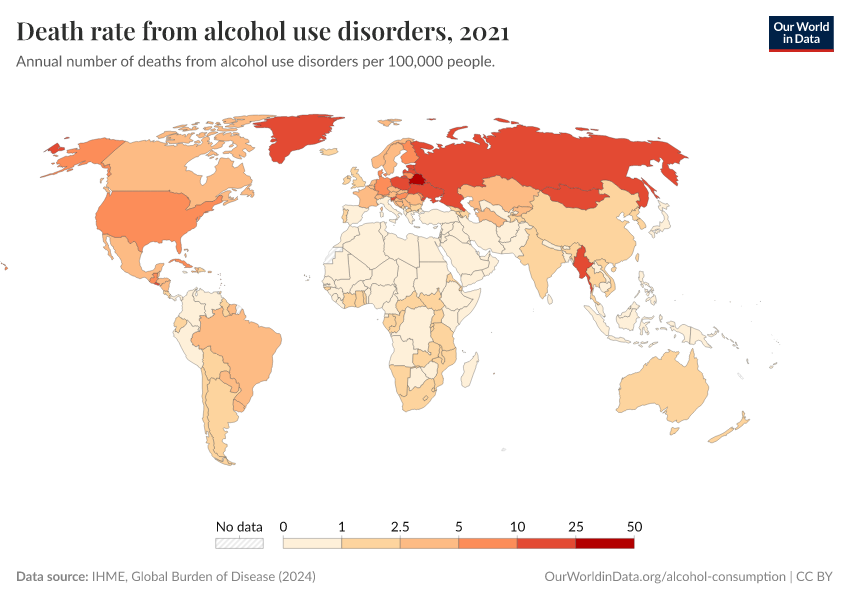
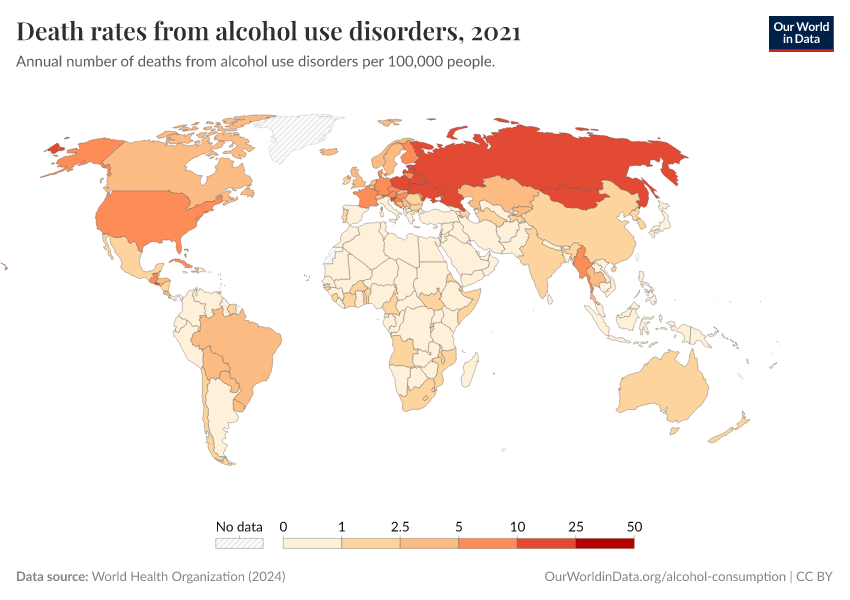
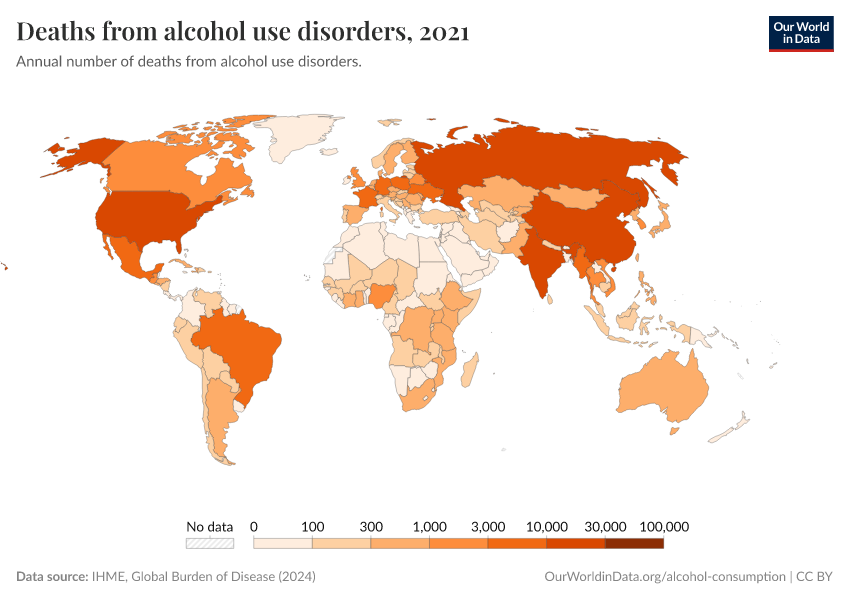
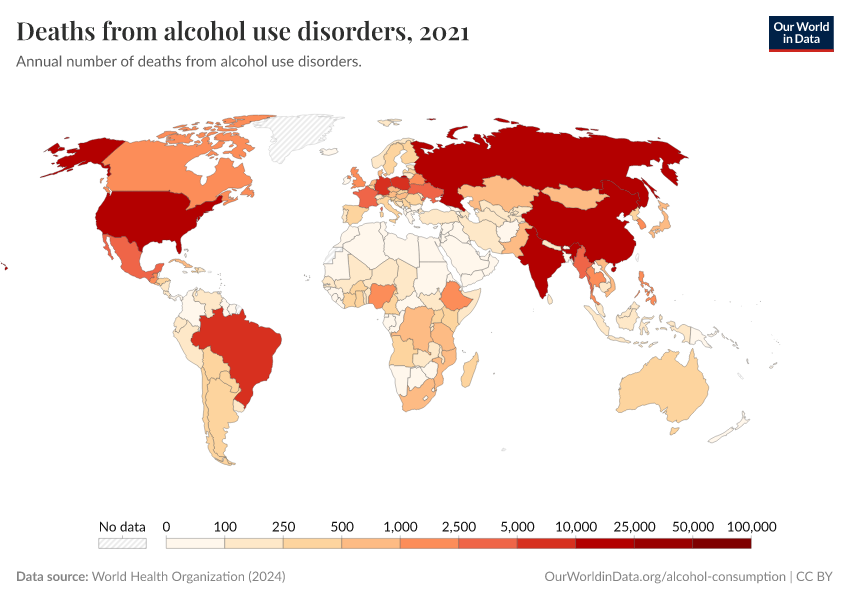
Deaths from alcohol use disorders
Deaths from alcohol dependence can occur both directly or indirectly. Indirect deaths from alcohol use disorders can occur indirectly through suicide. Although clear attribution of suicide deaths is challenging, alcohol use disorders are a known and established risk factor. It's estimated that the relative risk of suicide in an individual with alcohol dependence is around ten times higher than in an individual without.6
The chart shows direct death rates (not including suicide deaths) from alcohol use disorders across the world. The death rates are typically higher in Eastern Europe and lower in North Africa and the Middle East.

The total estimated number of deaths by country from 1990 to 2019 is found here.
Alcohol use disorder treatment
Global data on the prevalence and effectiveness of alcohol use disorder treatment is incomplete.
In the chart, we see data across some countries on the share of people with an alcohol use disorder who received treatment. This data is based on estimates of prevalence and treatment published by the World Health Organization (WHO).

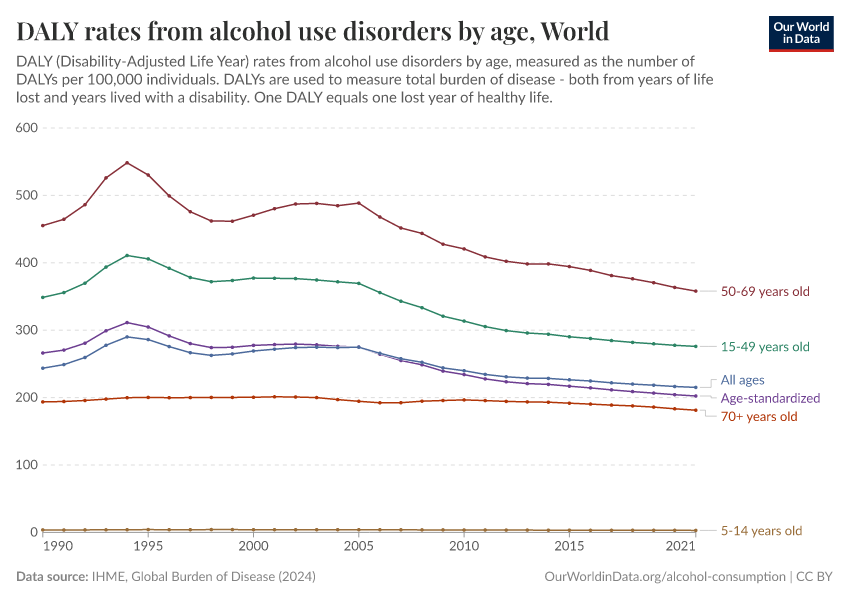
The disease burden from alcohol use disorders
Measuring the health impact by mortality alone fails to capture the impact that alcohol use disorders have on an individual's well-being. The 'disease burden' – measured in Disability-Adjusted Life Years (DALYs) – considers mortality and years lived with disability or health burden. The map shows DALYs per 100,000 people, which result from alcohol use disorders.
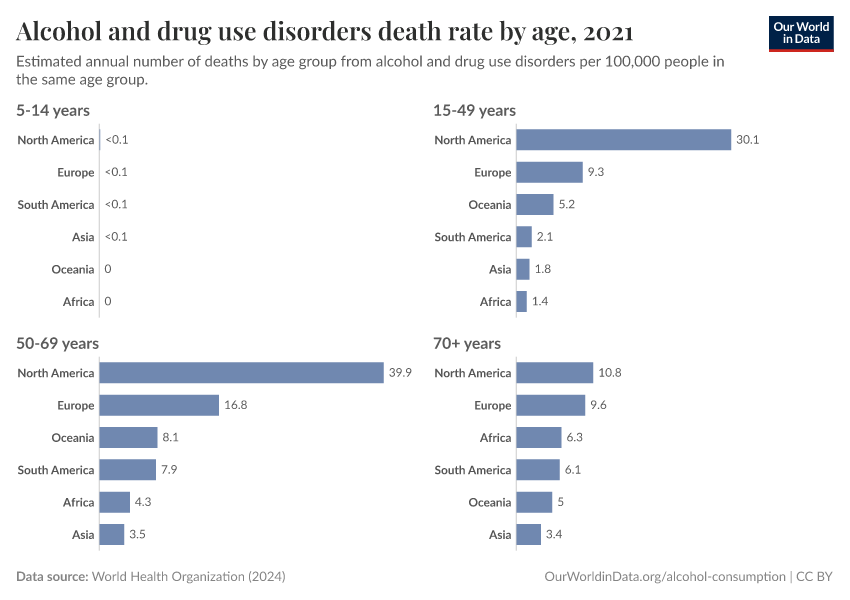
DALY rates differentiated by age group can be found here.

Risk factors for alcohol use disorders
Many of the risk factors for alcohol dependency are similar to those of overall drug use disorders (including illicit drug disorders). Further discussion on these risk factors can be found on our topic page on drug use.
Mental health disorders as a risk factor for alcohol dependency
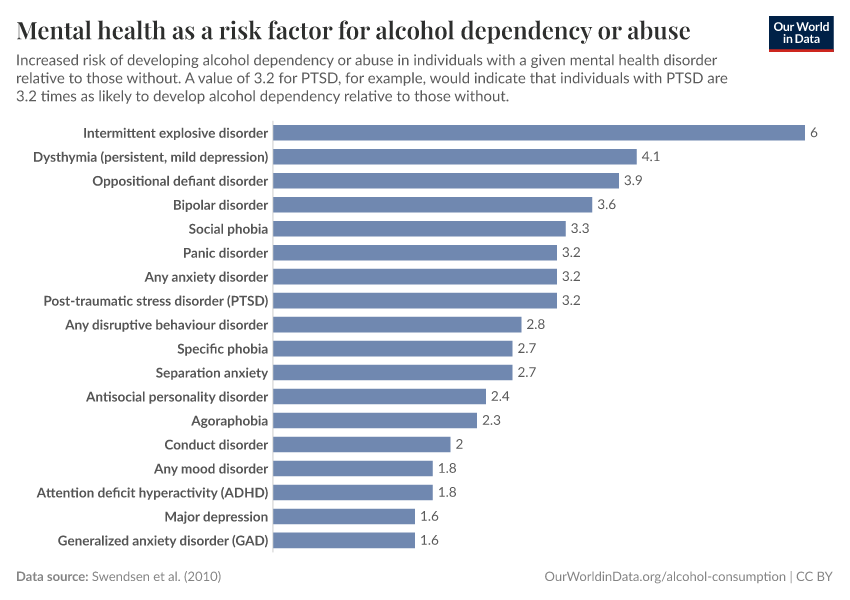
In the chart we show results from a study published by Swendsen et al. (2010).7
In this study, the authors followed a cohort of more than 5,000 individuals with and without a mental health disorder (but without a drug use disorder) over a 10-year period. Following the ten-year period, they re-assessed such individuals for whether they had either nicotine, alcohol, or illicit drug dependency.

The results in the chart show the increased risk of developing alcohol dependency (we show results for illicit drug dependency in our topic page on drug use) for someone with a given mental health disorder (relative to those without). For example, a value of 3.6 for bipolar disorder indicates that illicit drug dependency became more than three times more likely in individuals with bipolar disorder than those without. The risk of an alcohol use disorder is highest in individuals with intermittent explosive disorder, dysthymia, ODD, bipolar disorder, and social phobia.
Alcohol, crime, and road deaths
Alcohol-related road traffic deaths
The map shows the share of all road traffic deaths attributed to alcohol consumption over the national legal limit for alcohol consumption.
In South Africa and Papua New Guinea, more than half of all traffic deaths are attributable to alcohol consumption.
In the US, Canada, Australia, New Zealand, Argentina, and many European countries, alcohol is responsible for around a third of all traffic deaths.

Definitions and Measurement
What is a standard drink measure?
Whilst the World Health Organization (WHO) and most national guidelines typically quantify one unit of alcohol as equal to 10 grams of pure alcohol, the metric used as a 'standard measure' can vary across countries. Most countries across Europe use this 10-gram metric. However, this can vary, with several adopting 12 or 14 grams per unit.
In North America, a unit is typically taken as 14 grams of pure alcohol. In Japan, this is as high as around 20 grams per unit.

Further Resources & Guidance
Alcohol Rehab Guide
- Information: Guidance on the signs of alcoholism, unhealthy drinking behaviors, and support on where to go for help
- Geographical coverage: Universal guidance; support options for the United States
- Available at: https://www.alcoholrehabguide.org/support/
Hello Sunday Morning
- Information: A social movement with the aim to reduce stigma around alcohol and to encourages people to consider their relationship with alcohol.
- Available at: HelloSundayMorning.org
Drink Aware
- Information: List and contact details of a range of places for support on alcohol issues
- Geographical coverage: United Kingdom
- Available at: https://www.drinkaware.co.uk/alcohol-support-services/
Rethinking Drinking
- Information: Test to assess your drinking patterns relative to the US population
- Geographical coverage: Global; assesses relative to US drinking patterns
- Available at: What's your drinking pattern?
Rehab 4 Addiction
- Information: An advisory and referral service for people who suffer from alcohol, drug, and behavioral addiction.
- Geographical coverage: Universal guidance; support options for the United Kingdom
- Available at: https://www.rehab4addiction.co.uk/
Key Charts on Alcohol Consumption
See all charts on this topic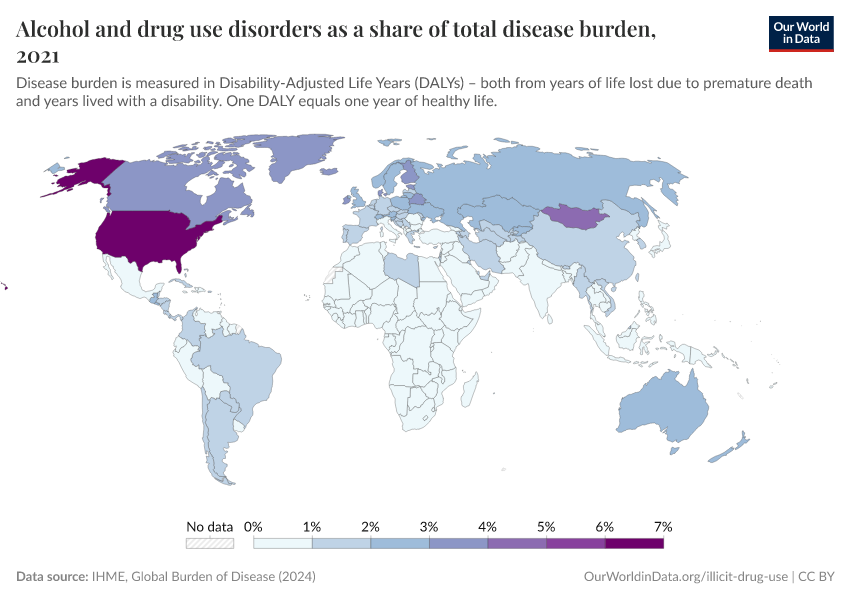


Featured Data on Alcohol Consumption
Endnotes
Alcohol.org has this overview of the range of alcohol by volume of beer, wine, & liquor.
22.1 liters per person in France equals 22.1l / 0.12l = 184 bottles per year.
Miron & Zwiebel (1991). Alcohol Consumption During Prohibition. The American Economic Review, Vol. 81, No. 2, pp. 242-247, (May 1991). Available online.
ONS (2018). Adult drinking habits in Great Britain. UK Office of National Statistics. Available at: https://www.ons.gov.uk/peoplepopulationandcommunity/healthandsocialcare/drugusealcoholandsmoking/datasets/adultdrinkinghabits
GBD 2019 Risk Factor Collaborators. "Global burden of 87 risk factors in 204 countries and territories, 1990–2019: a systematic analysis for the Global Burden of Disease Study 2019" (2020). Link here
Ferrari et al. (2015). The Burden Attributable to Mental and Substance Use Disorders as Risk Factors for Suicide: Findings from the Global Burden of Disease Study 2010. PLOS ONE. Available online.
Swendsen, J., Conway, K. P., Degenhardt, L., Glantz, M., Jin, R., Merikangas, K. R., … & Kessler, R. C. (2010). Mental disorders as risk factors for substance use, abuse, and dependence: results from the 10‐year follow‐up of the National Comorbidity Survey. Addiction, 105(6), 1117-1128. Available at: https://onlinelibrary.wiley.com/doi/pdf/10.1111/j.1360-0443.2010.02902.x
Cite this work
Our articles and data visualizations rely on work from many different people and organizations. When citing this topic page, please also cite the underlying data sources. This topic page can be cited as:
Hannah Ritchie and Max Roser (2022) - “Alcohol Consumption” Published online at OurWorldinData.org. Retrieved from: 'https://ourworldindata.org/alcohol-consumption' [Online Resource]BibTeX citation
@article{owid-alcohol-consumption,
    author = {Hannah Ritchie and Max Roser},
    title = {Alcohol Consumption},
    journal = {Our World in Data},
    year = {2022},
    note = {https://ourworldindata.org/alcohol-consumption}
}
Reuse this work freely
All visualizations, data, and articles produced by Our World in Data are completely open access under the Creative Commons BY license. You have the permission to use, distribute, and reproduce these in any medium, provided the source and authors are credited.
The data produced by third parties and made available by Our World in Data is subject to the license terms from the original third-party authors. We will always indicate the original source of the data in our documentation, so you should always check the license of any such third-party data before use and redistribution.
All of our charts can be embedded in any site.