Environmental Impacts of Food Production
What are the environmental impacts of food production? How do we reduce the impacts of agriculture on the environment?
Agriculture has a significant environmental impact in three key ways.
First, it requires large amounts of fresh water, which can cause significant environmental pressures in regions with water stress. It needs water as input and pollutes rivers, lakes, and oceans by releasing nutrients.
It is a crucial driver of climate change, responsible for around one-quarter of the world’s greenhouse gas emissions.
Finally, agriculture has a massive impact on the world’s environment due to its enormous land use. Half of the world’s habitable land is used for agriculture.
Large parts of the world that were once covered by forests and wildlands are now used for agriculture. This loss of natural habitat has been the main driver for reducing the world’s biodiversity. Wildlife can rebound if we reduce agricultural land use and allow natural lands to restore.
Ensuring everyone has access to a nutritious diet sustainably is one of the most significant challenges we face. On this page, you can find our data, visualizations, and writing relating to the environmental impacts of food.
Key insights on the Environmental Impacts of Food
Food production has a large environmental impact in several ways
What are the environmental impacts of food and agriculture?
The visualization here shows a summary of some of the main global impacts:
- Food production accounts for over a quarter (26%) of global greenhouse gas emissions.1
- Half of the world’s habitable land is used for agriculture. Habitable land is land that is ice- and desert-free.
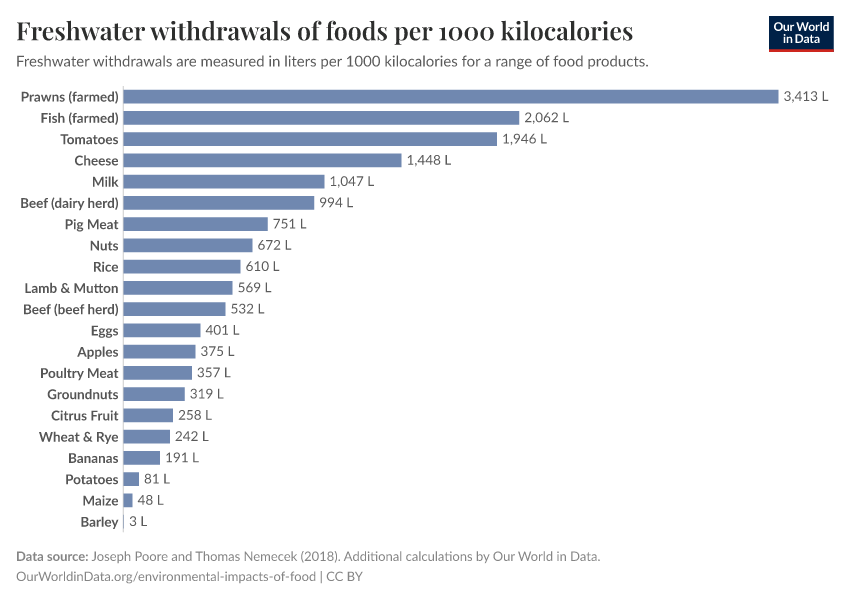
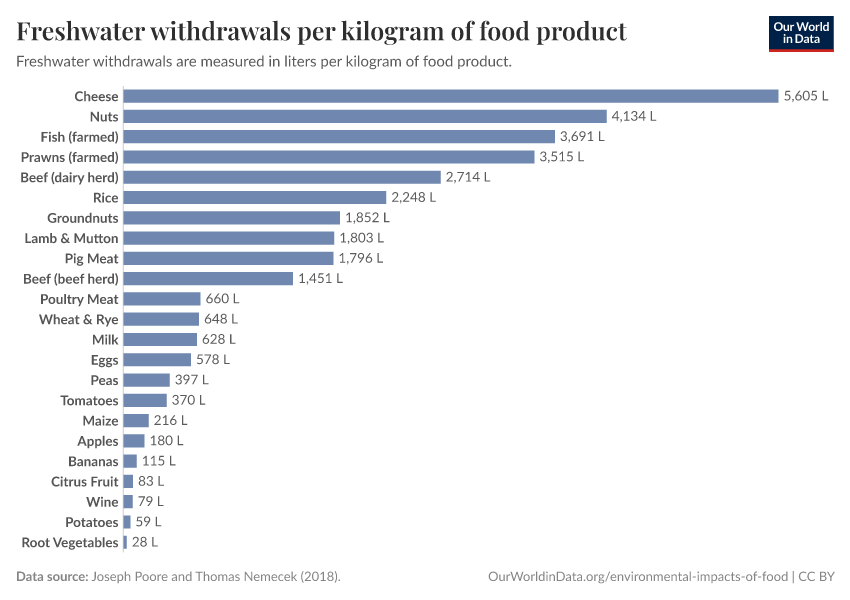
- 70% of global freshwater withdrawals are used for agriculture2.
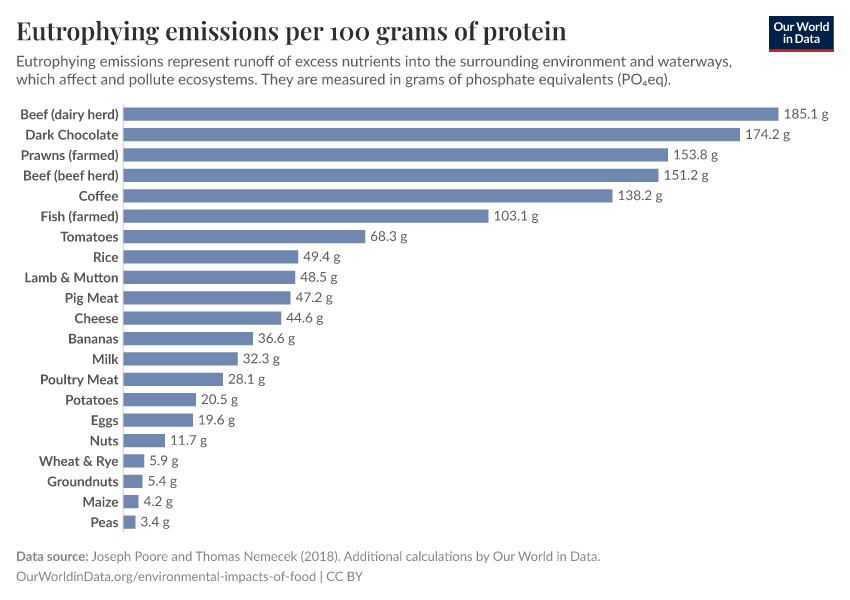
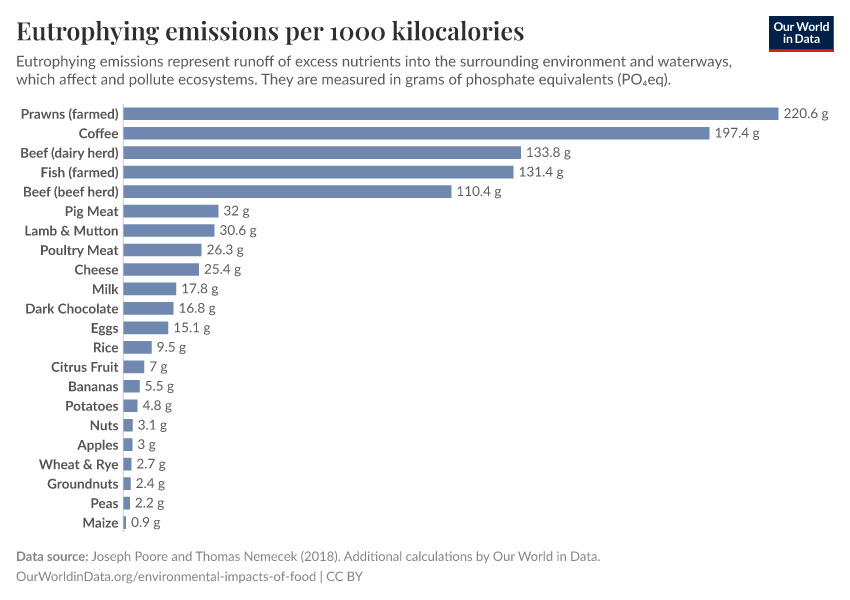
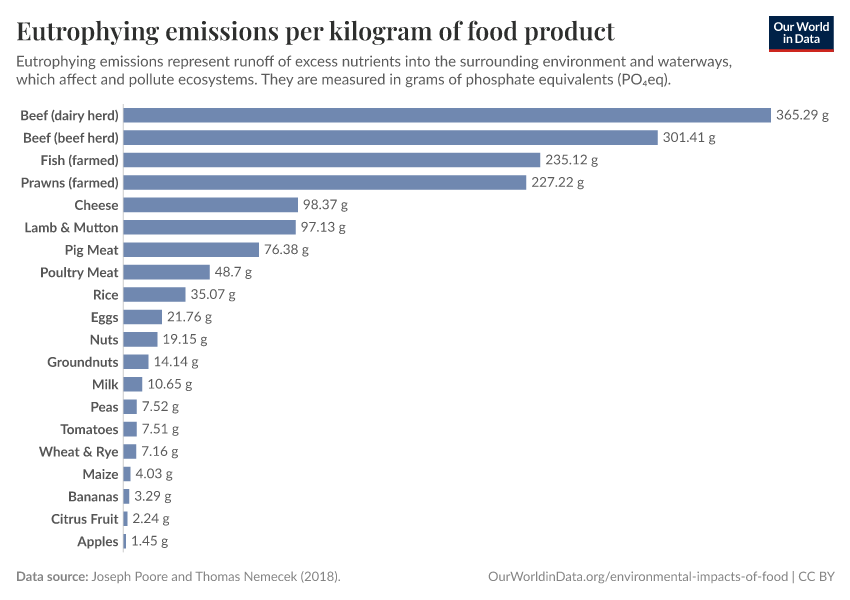
- 78% of global ocean and freshwater eutrophication is caused by agriculture.1 Eutrophication is the pollution of waterways with nutrient-rich water.
- 94% of non-human mammal biomass is livestock. This means livestock outweigh wild mammals by a factor of 15-to-1.3 This share is 97% when only land-based mammals are included.
- 71% of bird biomass is poultry livestock. This means poultry livestock outweigh wild birds by a factor of more than 3-to-1.3
Tackling what we eat, and how we produce our food, plays a key role in tackling climate change, reducing water stress and pollution, restoring lands back to forests or grasslands, and protecting the world’s wildlife.
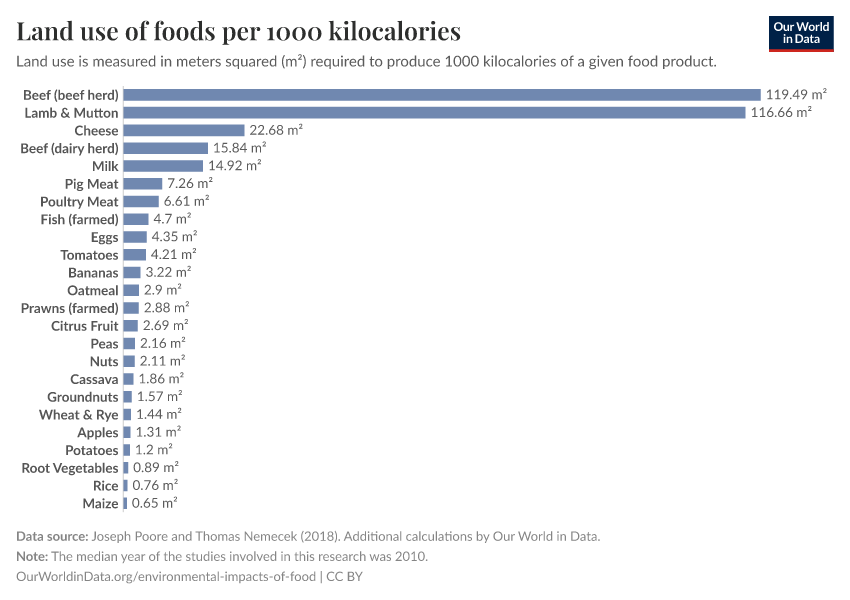
Half of the world’s habitable land is used for agriculture
Around half of the world’s habitable land is used for agriculture. Habitable land is land that is ice- and desert-free. This is what the visualization shows.
Agricultural land is the sum of pasture used for livestock grazing, and cropland used for direct human consumption and animal feed.
Agriculture is, therefore, the world’s largest land user, taking up more area than forests, or wild grasslands.
Three-quarters of this agricultural land is used for livestock, which is pasture plus cropland used for the production of animal feed. This gives the world just 18% of global calories, and 37% of its protein. The other quarter of land is for crops for human consumption, which provide the majority of the world's calories and protein.
What you should know about this data
- Other studies find similar distributions of global land: in an analysis of how humans have transformed global land use in recent centuries, Ellis et al. (2010) found that by 2000, 55% of Earth’s ice-free (not simply habitable) land had been converted into cropland, pasture, and urban areas.4 This left only 45% as ‘natural’ or ‘semi-natural’ land.
- The study by Joseph Poore and Thomas Nemecek (2018) estimates that 43% of ice- and desert-free land is used for agriculture. 83% of this is used for animal-sourced foods.1
- The difference in these figures is often due to the uncertainty of the size of ‘rangelands’. Rangelands are grasslands, shrublands, woodlands, wetlands, and deserts that are grazed by domestic livestock or wild animals. The intensity of grazing on rangelands can vary a lot. That can make it difficult to accurately quantify how much rangelands are used for grazing, and therefore how much is used for food production.
- But as the review above showed, despite this uncertainty, most analyses tend to converge on an estimate of close to half of habitable land being used for agriculture.
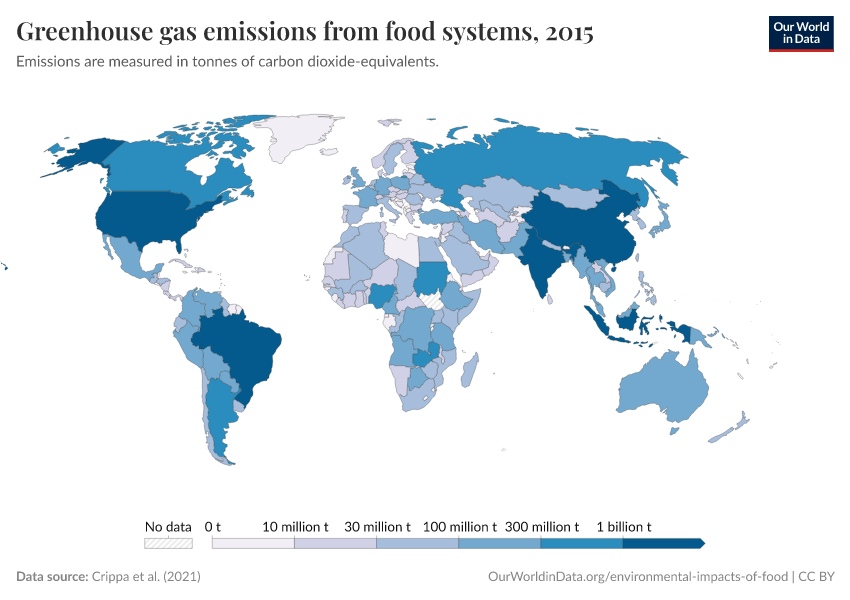
Food is responsible for one-quarter of the world’s emissions
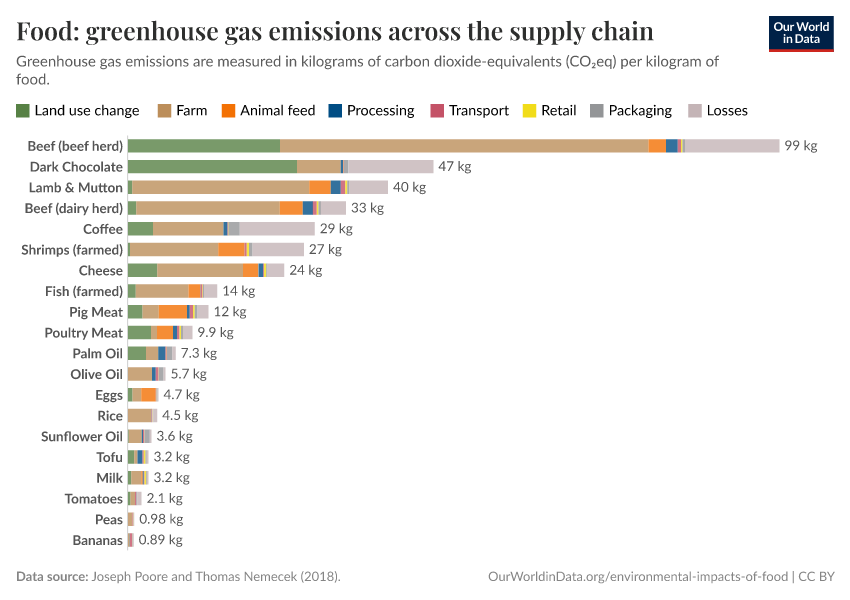
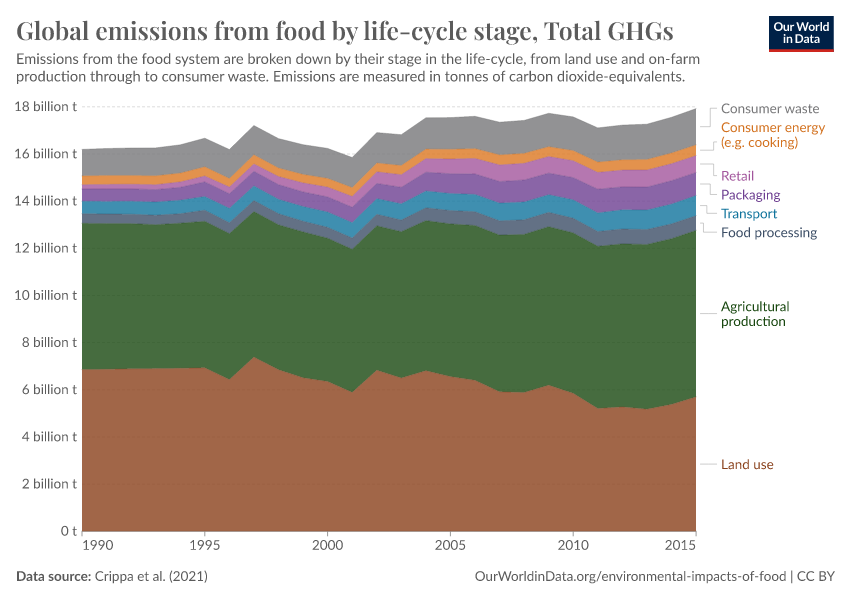
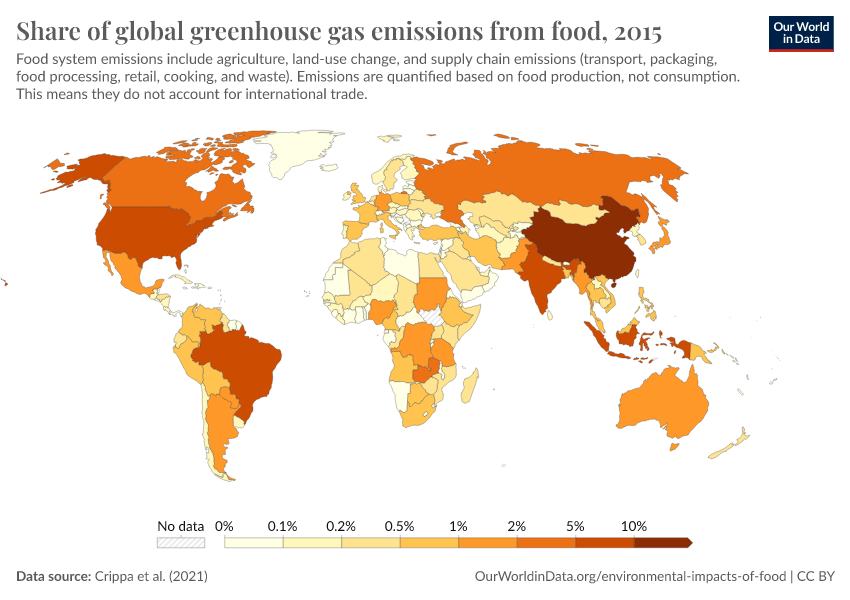
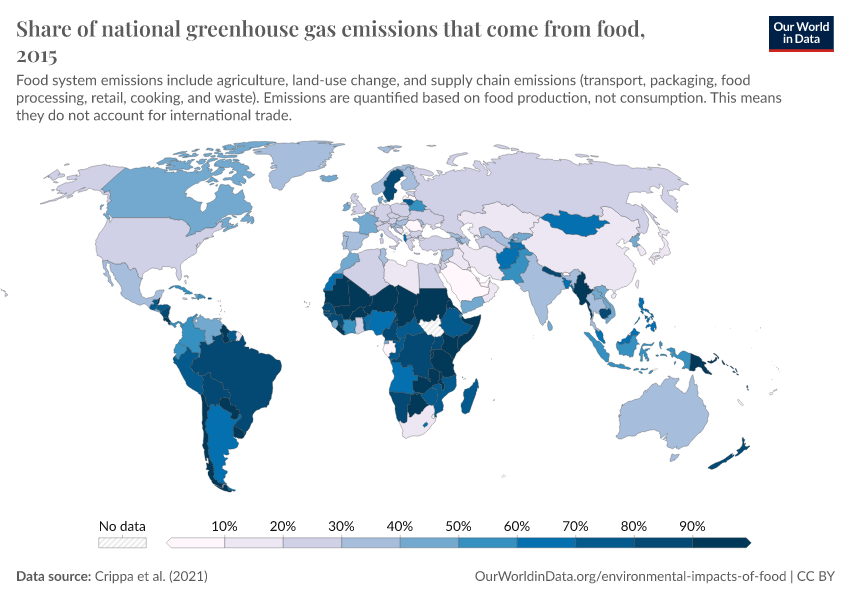
Food systems are responsible for around one-quarter (26%) of global greenhouse gas emissions.1
This includes emissions from land use change, on-farm production, processing, transport, packaging, and retail.
We can break these food system emissions down into four broad categories:
30% of food emissions come directly from livestock and fisheries. Ruminant livestock – mainly cattle – for example, produce methane through their digestive processes. Manure and pasture management also fall into this category.
1% comes from wild fisheries, most of which is fuel consumption from fishing vessels.
Crop production accounts for around a quarter of food emissions. This includes crops for human consumption and animal feed.
Land use accounts for 24% of food emissions. Twice as many emissions result from land use for livestock (16%) as for crops for human consumption (8%).
Finally, supply chains account for 18% of food emissions. This includes food processing, distribution, transport, packaging, and retail.
Other studies estimate that an even larger fraction – up to one-third – of the world's greenhouse gas emissions come from food production.5 These differences come from the inclusion of non-food agricultural products – such as textiles, biofuels, and industrial crops – plus uncertainties in food waste and land use emissions.
What you should know about this data
- The source of this data is the meta-analysis of global food systems from Joseph Poore and Thomas Nemecek (2018), published in Science.1 This dataset is based on data from 38,700 commercially viable farms in 119 countries and 40 products.
- Environmental impacts are calculated based on life-cycle analyses that consider impacts across the supply chain, including land use change, on-farm emissions, the production of agricultural inputs such as fertilizers and pesticides, food processing, transport, packaging, and retail.
- Greenhouse gas emissions are measured in carbon dioxide equivalents (CO2eq). This means each greenhouse gas is weighted by its global warming potential value. Global warming potential measures the amount of warming a gas creates compared to CO2. In this study, CO2eq and warming effects are measured over a 100-year timescale (GWP100).
Emissions from food alone would take us past 1.5°C or 2°C this century
One-quarter to one-third of global greenhouse gas emissions come from our food systems. The rest comes from energy.
While energy and industry make a bigger contribution than food, we must tackle both food and energy systems to address climate change.
Michael Clark and colleagues modeled the amount of greenhouse gas emissions that would be emitted from food systems this century across a range of scenarios.
In a business-as-usual scenario, the authors expect the world to emit around 1356 billion tonnes of CO2-we by 2100.
As the visualization shows, this would take us well beyond the carbon budget for 1.5°C – we would emit two to three times more than this budget. And it would consume almost all of our budget for 2°C.
Ignoring food emissions is simply not an option if we want to get close to our international climate targets.
Even if we stopped burning fossil fuels tomorrow – an impossibility – we would still go well beyond our 1.5°C target, and nearly miss our 2°C target.
What you should know about this data
- The source of this data is the meta-analyses of global food systems from Michael Clark et al. (2020), published in Science.6
- Their ‘business-as-usual’ projection makes the following assumptions: global population increases in line with the UN’s medium fertility scenario; per capita diets change as people around the world get richer (shifting towards more diverse diets with more meat and dairy); crop yields continue to increase in line with historical improvements, and rates of food loss and the emissions intensity of food production remain constant.
- This is measured in global warming potential CO2 warming-equivalents (CO2-we). This accounts for the range of greenhouse gasses, not just CO2 but also others such as methane and nitrous oxide. We look at the differences in greenhouse gas metrics at the end of our article on the carbon footprint of foods.
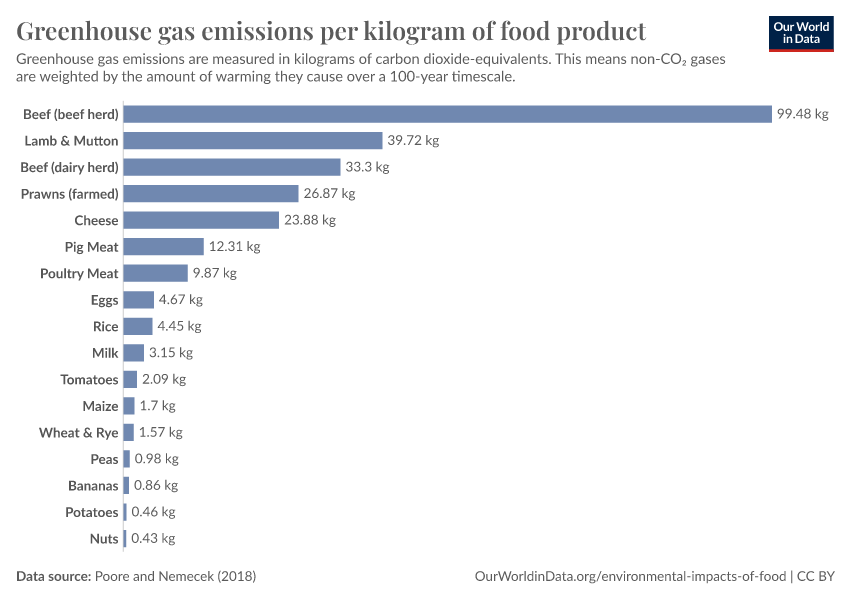
What we eat matters much more than how far it has traveled
‘Eat local’ is a common recommendation to reduce the carbon footprint of your diet. But it’s often a misguided one.
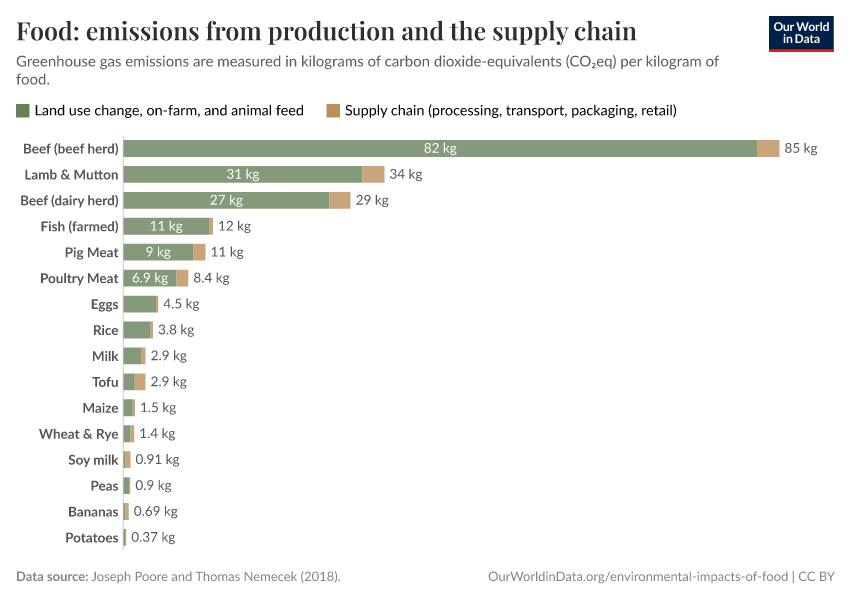
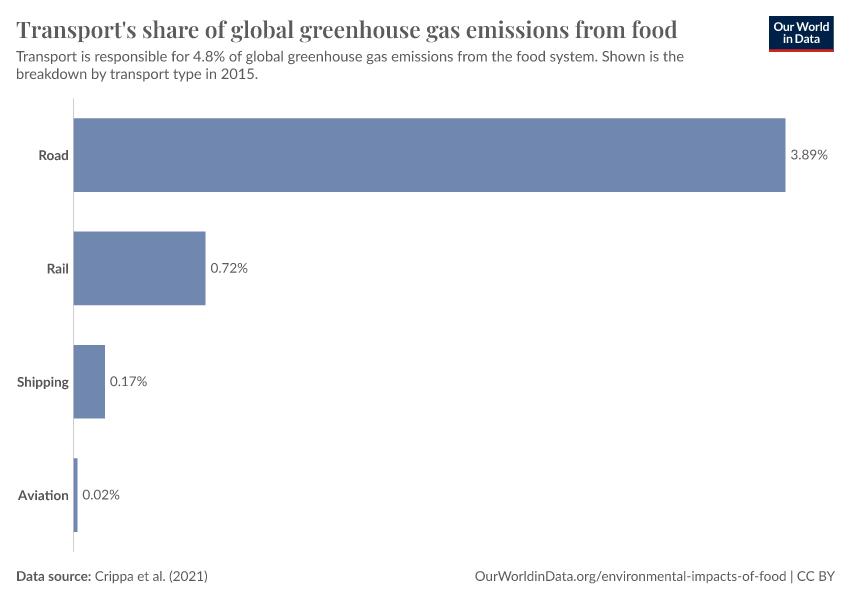
Transport tends to be a small part of a food’s carbon footprint. Globally, transport accounts for just 5% of food system emissions. Most of food’s emissions come from land use change and emissions from their production on the farm.
Since transport emissions are typically small, and the differences between foods are large, what types of food we eat matter much more than how far it has traveled. Locally-produced beef will have a much larger footprint than peas, regardless of whether it’s shipped across continents or not.
The visualization shows this.
Producing a kilogram of beef, for example, emits 60 kilograms of greenhouse gasses (CO2-equivalents). The production of a kilogram of peas, shown at the bottom of the chart, emits just 1 kilogram of greenhouse gasses. Whether the beef or peas are produced locally will have little impact on the difference between these two foods.
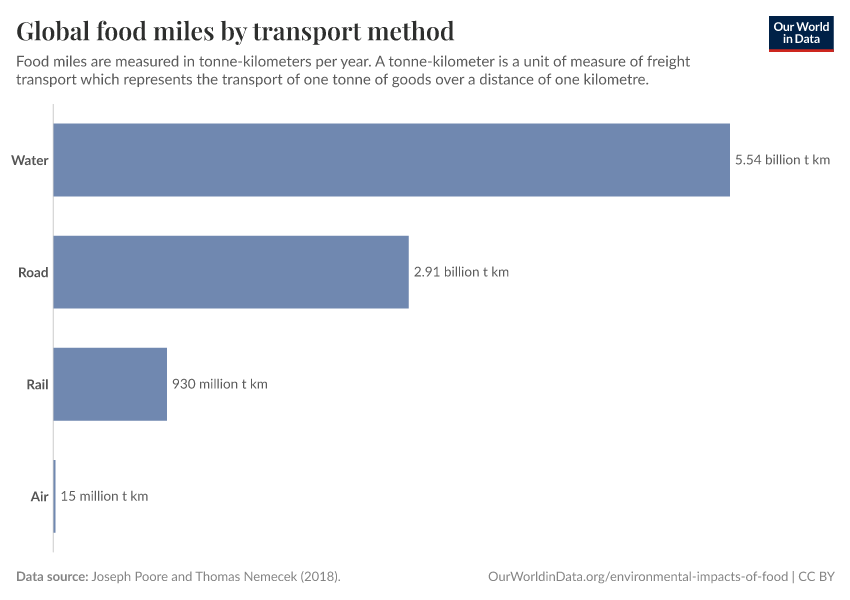
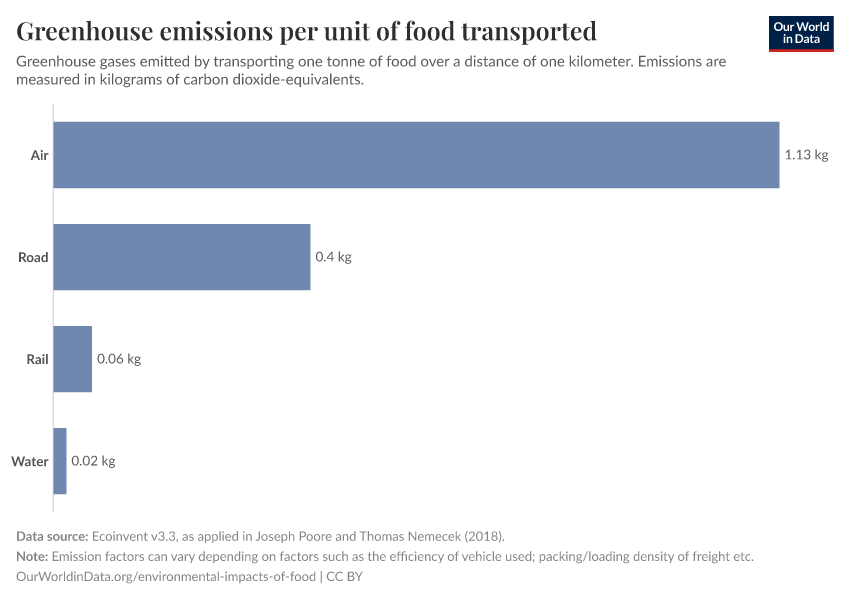
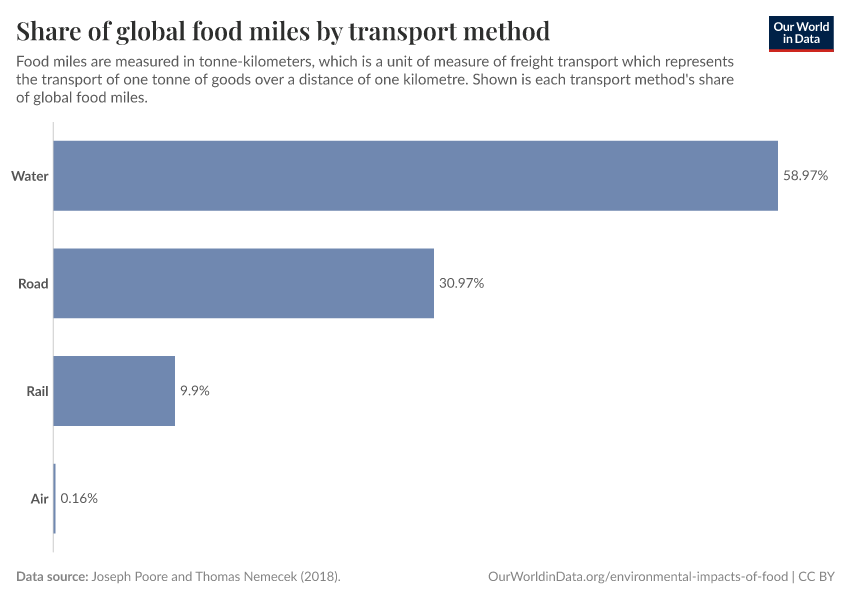
The reason that transport accounts for such a small share of emissions is that most internationally traded food travels by boat, not by plane. Very little food is air-freighted; it accounts for only 0.16% of food miles.7 For the few products which are transported by air, the emissions can be very high: flying emits 50 times more CO2eq than boat per tonne kilometer.
Unlike aviation, shipping is a very carbon-efficient way to transport goods. So, even shipping food over long distances by boat emits only small amounts of carbon. A classic example of traded food is avocados. Shipping one kilogram of avocados from Mexico to the United Kingdom would generate 0.21kg CO2eq in transport emissions.8This is only around 8% of avocados’ total footprint.
Even when shipped at great distances, its emissions are much less than locally-produced animal products.
What you should know about this data
- The source of this data is the meta-analyses of global food systems from Joseph Poore and Thomas Nemecek (2018), published in Science.1 This dataset is based on data from 38,700 commercially viable farms in 119 countries and 40 products.
- Environmental impacts are calculated based on life-cycle analyses that consider impacts across the supply chain, including land use change, on-farm emissions, the production of agricultural inputs such as fertilizers and pesticides, food processing, transport, packaging, and retail.
- Greenhouse gas emissions are measured in carbon dioxide equivalents (CO2eq). This means each greenhouse gas is weighted by its global warming potential value. Global warming potential measures the amount of warming a gas creates compared to CO2. In this study, CO2eq and warming effects are measured over a 100-year timescale (GWP100).
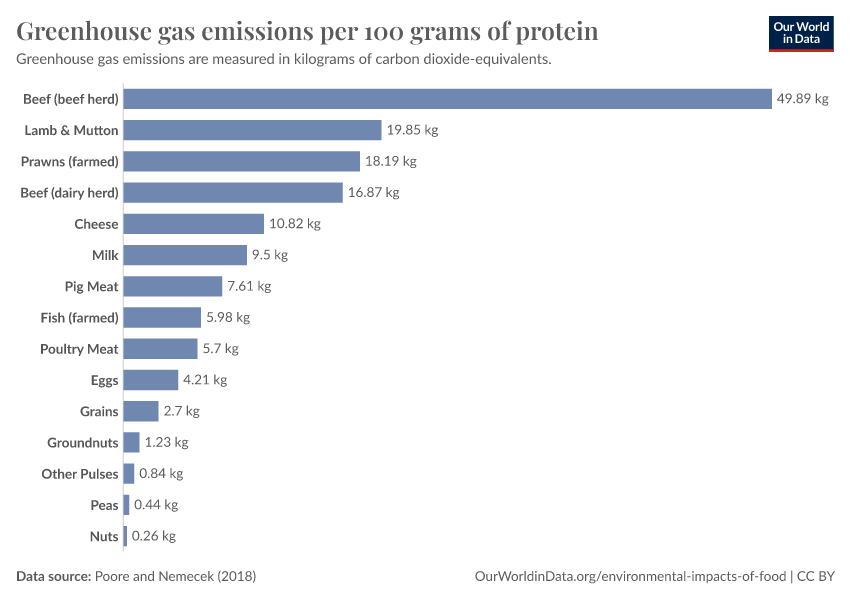
Meat and dairy foods tend to have a higher carbon footprint
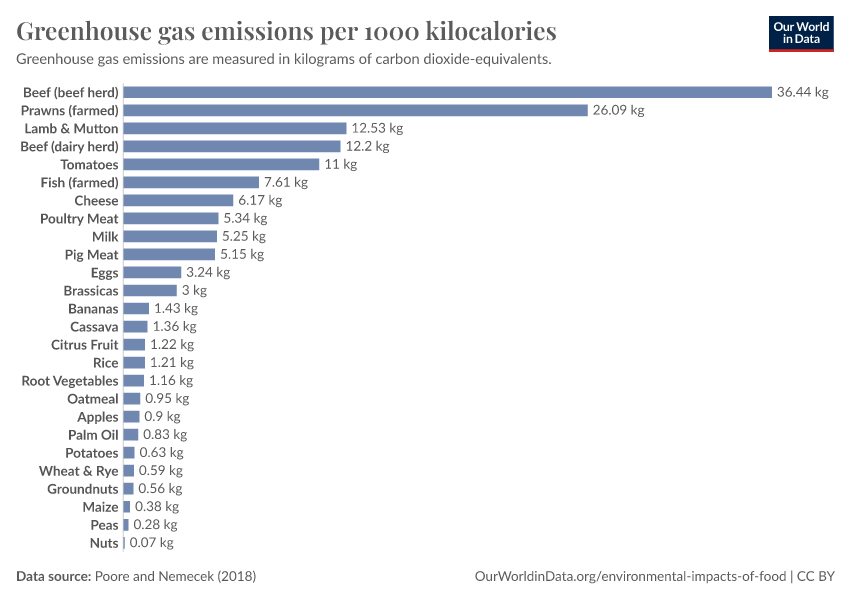
When we compare the carbon footprint of different types of foods, a clear hierarchy emerges.
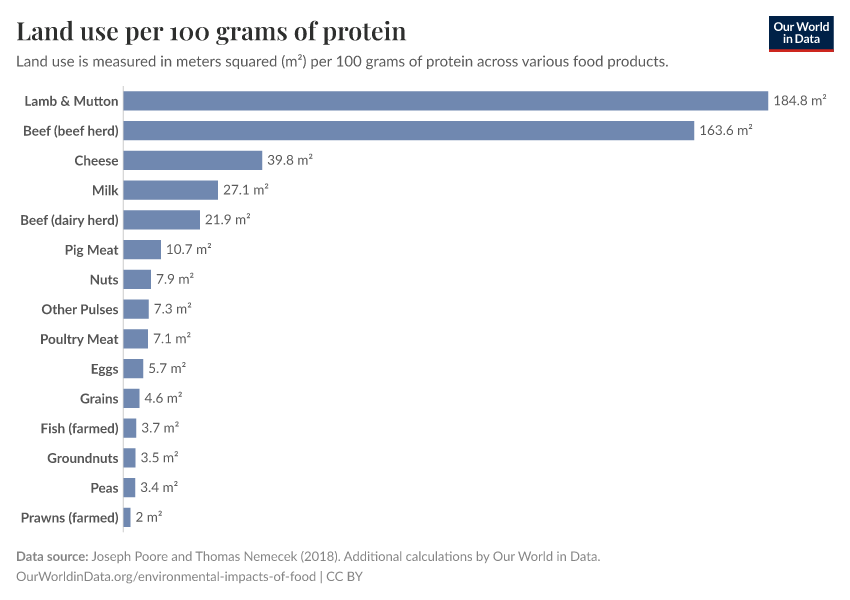
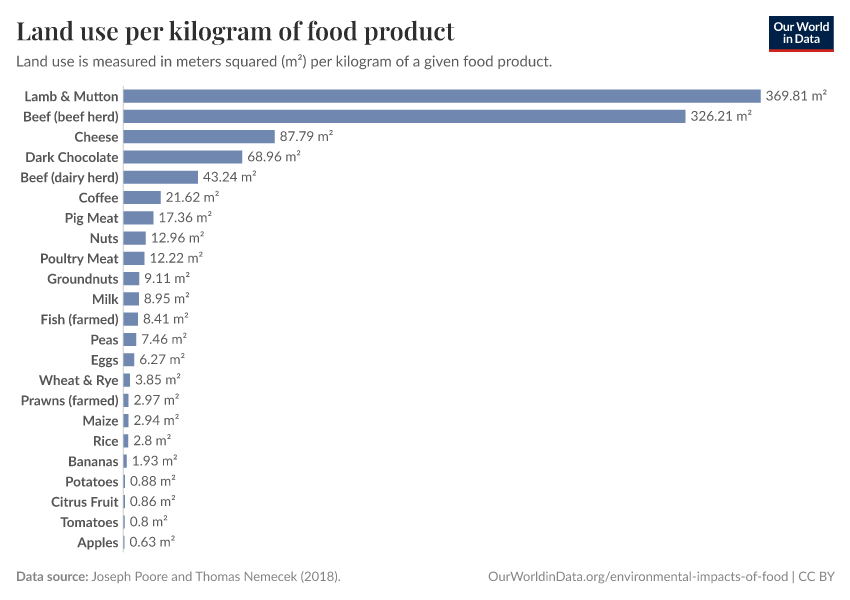
Meat and dairy products tend to emit more greenhouse gasses than plant-based foods. This holds true whether we compare on the basis of mass (per kilogram), per kilocalorie, or per gram of protein, as shown in the chart.
Within meat and dairy products, there is also a consistent pattern: larger animals tend to be less efficient and have a higher footprint. Beef typically has the largest emissions; followed by lamb; pork; chicken; then eggs and fish.
What you should know about this data
- This data presents global average values. For some foods – such as beef – there are large differences depending on where it is produced, and the farming practices used. Nonetheless, the lowest-carbon beef and lamb still have a higher carbon footprint than most plant-based foods.
- The source of this data is the meta-analyses of global food systems from Joseph Poore and Thomas Nemecek (2018), published in Science.1 This dataset covers 38,700 commercially viable farms in 119 countries and 40 products.
- Environmental impacts are calculated based on life-cycle analyses that consider impacts across the supply chain, including land use change, on-farm emissions, the production of agricultural inputs such as fertilizers and pesticides, food processing, transport, packaging, and retail.
- Greenhouse gas emissions are measured in carbon dioxide equivalents (CO2eq). This means each greenhouse gas is weighted by its global warming potential value. Global warming potential measures the amount of warming a gas creates compared to CO2. For CO2eq, this is measured over a 100-year timescale (GWP100).

There are also large differences in the carbon footprint of the same foods
The most effective way to reduce greenhouse gas emissions from the food system is to change what we eat.
Adopting a more plant-based diet by reducing our consumption of carbon-intensive foods such as meat and dairy – especially beef and lamb – is an effective way for consumers to reduce their carbon footprint.
But there are also opportunities to reduce emissions by optimizing for more carbon-efficient practices and locations to produce foods. For some foods – in particular, beef, lamb, and dairy – there are large differences in emissions depending on how and where they’re produced. This is shown in the chart.
Producing 100 grams of protein from beef emits 25 kilograms of carbon dioxide-equivalents (CO2eq), on average. But this ranges from 9 kilograms to 105 kilograms of CO2eq – a ten-fold difference.
Optimizing production in places where these foods are produced with a smaller footprint could be another effective way of reducing global emissions.
What you should know about this data
- The source of this data is the meta-analyses of global food systems from Joseph Poore and Thomas Nemecek (2018), published in Science.1 This dataset covers 38,700 commercially viable farms in 119 countries and 40 products.
- Environmental impacts are calculated based on life-cycle analyses that consider impacts across the supply chain, including land use change, on-farm emissions, the production of agricultural inputs such as fertilizers and pesticides, food processing, transport, packaging, and retail.
- Greenhouse gas emissions are measured in carbon dioxide equivalents (CO2eq). This means each greenhouse gas is weighted by its global warming potential value. Global warming potential measures the amount of warming a gas creates compared to CO2. For CO2eq, this is measured over a 100-year timescale (GWP100).
Research & Writing
January 24, 2020
You want to reduce the carbon footprint of your food? Focus on what you eat, not whether your food is local
“Eat local” is a common recommendation to reduce your diet's carbon footprint. How does the impact of what you eat compare to where it comes from?
November 6, 2019
Food production is responsible for one-quarter of the world’s greenhouse gas emissions
One-quarter of the world's greenhouse gas emissions result from food and agriculture. What are the main contributors to food's emissions?
Food production and climate change
November 6, 2019
Food production is responsible for one-quarter of the world’s greenhouse gas emissions
March 18, 2021
How much of global greenhouse gas emissions come from food?
June 10, 2021
Emissions from food alone could use up all of our budget for 1.5°C or 2°C – but we have a range of opportunities to avoid this
March 19, 2021
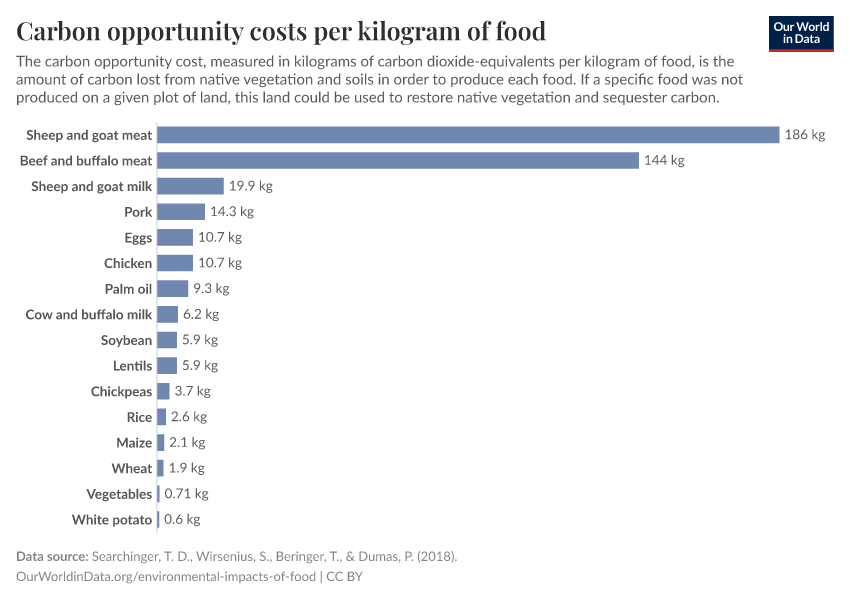
What are the carbon opportunity costs of our food?
Food miles and transport
Environmental impacts of meat and dairy
February 4, 2020
Less meat is nearly always better than sustainable meat, to reduce your carbon footprint
January 19, 2022
Dairy vs. plant-based milk: what are the environmental impacts?
March 10, 2020
The carbon footprint of foods: are differences explained by the impacts of methane?
March 4, 2021
If the world adopted a plant-based diet, we would reduce global agricultural land use from 4 to 1 billion hectares
Land use and deforestation
February 4, 2021
Drivers of Deforestation
May 30, 2022
After millennia of agricultural expansion, the world has passed ‘peak agricultural land’
September 2, 2021
To protect the world’s wildlife, we must improve crop yields — especially across Africa
November 11, 2019
Half of the world’s habitable land is used for agriculture
Other articles on food impacts
More key articles on the Environmental Impacts of Food
Key Charts on Environmental Impacts of Food Production
See all charts on this topic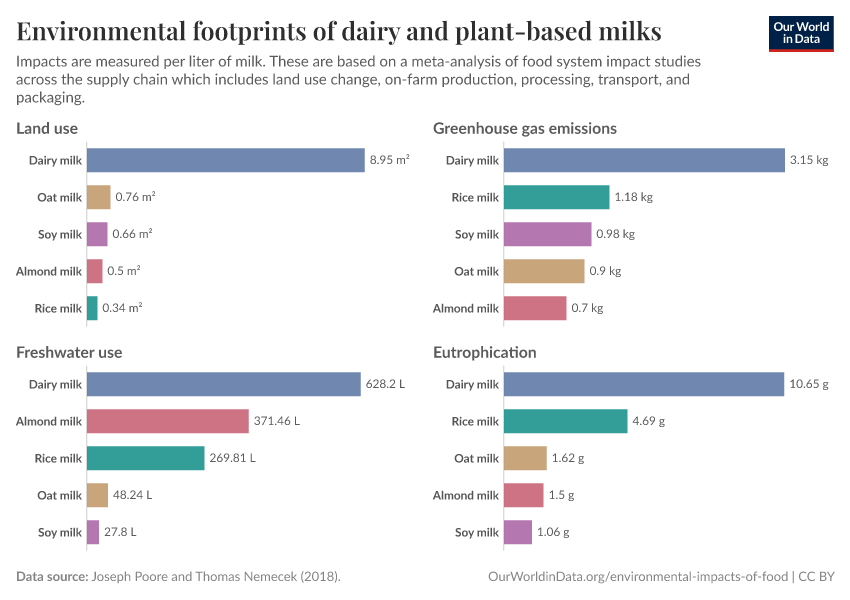


Featured Data on Environmental Impacts of Food Production
Endnotes
Poore, J., & Nemecek, T. (2018). Reducing food’s environmental impacts through producers and consumers. Science, 360(6392), 987-992.
FAO. (2011). The state of the world’s land and water resources for food and agriculture (SOLAW) – Managing systems at risk. Food and Agriculture Organization of the United Nations, Rome and Earthscan, London.
Bar-On, Y. M., Phillips, R., & Milo, R. (2018). The biomass distribution on Earth. Proceedings of the National Academy of Sciences, 115(25), 6506-6511.
Ellis, E. C., Klein Goldewijk, K., Siebert, S., Lightman, D., & Ramankutty, N. (2010). Anthropogenic transformation of the biomes, 1700 to 2000. Global Ecology and Biogeography, 19(5), 589-606.
Crippa, M., Solazzo, E., Guizzardi, D., Monforti-Ferrario, F., Tubiello, F. N., & Leip, A. J. N. F. (2021). Food systems are responsible for a third of global anthropogenic GHG emissions. Nature Food, 2(3), 198-209.
Clark, Michael A., Nina GG Domingo, Kimberly Colgan, Sumil K. Thakrar, David Tilman, John Lynch, Inês L. Azevedo, and Jason D. Hill. “Global food system emissions could preclude achieving the 1.5° and 2° C climate change targets.” Science, 370, no. 6517 (2020): 705-708.
’Food miles’ are measured in tonne-kilometers which represents the transport of one tonne of goods by a given transport mode (road, rail, air, sea, inland waterways, pipeline etc.) over a distance of one kilometer. Poore & Nemecek (2018) report that of the 9.4 billion tonne-kilometers of global food transport, air-freight accounted for only 15 million. This works out at only 0.16% of the total; most foods are transported by boat.
We get this footprint value as: [9000km * 0.023kg per tonne-kilometer / 1000 = 0.207kg CO2eq per kg].
Cite this work
Our articles and data visualizations rely on work from many different people and organizations. When citing this topic page, please also cite the underlying data sources. This topic page can be cited as:
Hannah Ritchie, Pablo Rosado, and Max Roser (2022) - “Environmental Impacts of Food Production” Published online at OurWorldinData.org. Retrieved from: 'https://ourworldindata.org/environmental-impacts-of-food' [Online Resource]BibTeX citation
@article{owid-environmental-impacts-of-food,
    author = {Hannah Ritchie and Pablo Rosado and Max Roser},
    title = {Environmental Impacts of Food Production},
    journal = {Our World in Data},
    year = {2022},
    note = {https://ourworldindata.org/environmental-impacts-of-food}
}
Reuse this work freely
All visualizations, data, and articles produced by Our World in Data are completely open access under the Creative Commons BY license. You have the permission to use, distribute, and reproduce these in any medium, provided the source and authors are credited.
The data produced by third parties and made available by Our World in Data is subject to the license terms from the original third-party authors. We will always indicate the original source of the data in our documentation, so you should always check the license of any such third-party data before use and redistribution.
All of our charts can be embedded in any site.