You want to reduce the carbon footprint of your food? Focus on what you eat, not whether your food is local
“Eat local” is a common recommendation to reduce your diet's carbon footprint. How does the impact of what you eat compare to where it comes from?
People across the world are becoming increasingly concerned about climate change: 8-in-10 people see climate change as a major threat to their country.1
As I have shown before, food production is responsible for one-quarter of the world’s greenhouse gas emissions.
There is rightly a growing awareness that our diet and food choices significantly impact our carbon “footprint.” What can you do to really reduce the carbon footprint of your breakfast, lunches, and dinner? “Eating local” is a recommendation you hear often — even from prominent sources, including the United Nations. While it might make sense intuitively — after all, transport does lead to emissions — it is one of the most misguided pieces of advice.
Eating locally would only have a significant impact if transport was responsible for a large share of food’s final carbon footprint. For most foods, this is not the case.
Greenhouse gas (GHG) emissions from transportation make up a very small amount of the emissions from food, and what you eat is far more important than where your food traveled from.
Where do the emissions from our food come from?
The visualization shows GHG emissions from 29 food products — from beef at the top to nuts at the bottom.
For each product, you can see from which stage in the supply chain its emissions originate. This extends from land use changes on the left to transport and packaging on the right.
Producing a kilogram of beef emits 60 kilograms of greenhouse gases; peas emit just 1 kilogram
This is data from the largest meta-analysis of global food systems to date, published in Science by Joseph Poore and Thomas Nemecek (2018).
In this study, the authors examined data from more than 38,000 commercial farms in 119 countries.2
In this comparison, we look at the total GHG emissions per kilogram of food products. CO2 is the most important GHG, but not the only one — agriculture is a large source of the greenhouse gases methane and nitrous oxide. To capture all GHG emissions from food production, researchers express them in kilograms of carbon dioxide equivalents. This metric takes into account not just CO2 but all greenhouse gases.3
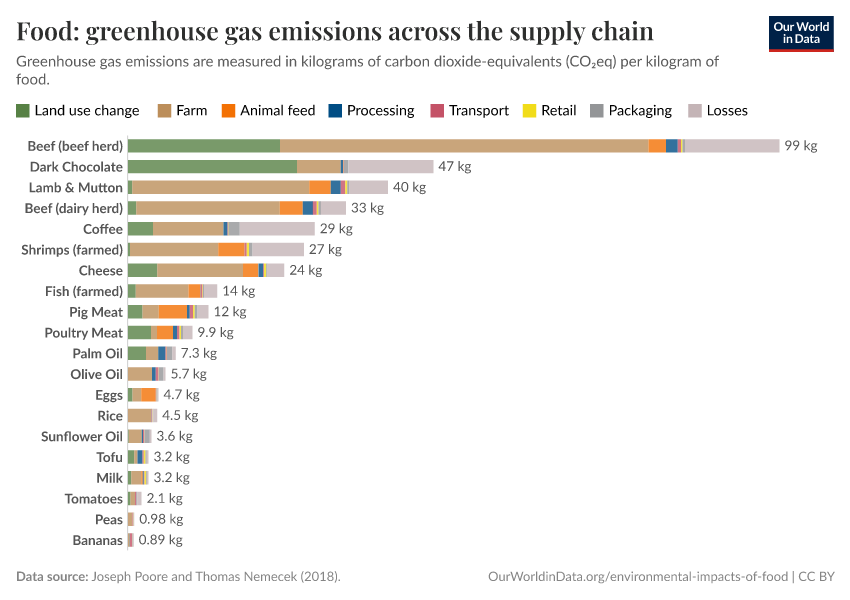
The most important insight from this study is that there are massive differences in the GHG emissions of different foods: producing a kilogram of beef emits 60 kilograms of greenhouse gases (CO2-equivalents). In contrast, peas emit just 1 kilogram per kg.
Overall, animal-based foods tend to have a higher footprint than plant-based. Lamb and cheese both emit more than 20 kilograms of CO2-equivalents per kilogram. Poultry and pork have lower footprints but are still higher than most plant-based foods, at 6 and 7 kg CO2-equivalents, respectively.
For most foods — and particularly the largest emitters — most GHG emissions result from land use change (shown in green) and from processes at the farm stage (brown). Farm-stage emissions include processes such as the application of fertilizers — both organic (“manure management”) and synthetic; and enteric fermentation (the production of methane in the stomachs of cattle). Combined, land use and farm-stage emissions account for more than 80% of the footprint for most foods.
Transport is a small contributor to emissions. For most food products, it accounts for less than 10%, and it’s much smaller for the largest GHG emitters. In beef from beef herds, it’s 0.5%.
Not just transport but all processes in the supply chain after the food leaves the farm — processing, transport, retail, and packaging — mostly account for a small share of emissions.
This data shows this is the case when we look at individual food products. However, studies also show that this holds true for actual diets; for example, researchers Vilma Sandström and colleagues studied the footprint of diets across the EU. Food transport accounted for only 6% of emissions, whilst dairy, meat, and eggs accounted for 83%.4
Eating local only slightly reduces your emissions
Eating local beef or lamb has many times the carbon footprint of most other foods. Whether they are grown locally or shipped from the other side of the world matters very little for total emissions.
Transport typically accounts for less than 1% of beef’s GHG emissions: eating locally has minimal effects on its total footprint. You might think this figure strongly depends on where you live and how far your beef will have to travel, but in the box below, I work through an example to show why it doesn’t make much difference.
Whether you buy it from the farmer next door or from far away, it is not the location that makes the carbon footprint of your dinner large, but the fact that it is beef.
Avoid the small share of foods that are air-freighted
The impact of transport is small for most products, but there is one exception: those which travel by air.
Many believe that air freight is more common than it actually is. Very little food is air-freighted; it accounts for only 0.16% of food miles.9 But for the few products which are transported by air, the emissions can be very high: it emits 50 times more CO2eq than a boat per tonne kilometer.10
To reduce your diet’s carbon footprint, avoid air-freighted foods where you can — but the biggest difference comes from eating less meat and dairy
Many of the foods people assume to come by air are actually transported by boat — avocados and almonds are prime examples. Shipping one kilogram of avocados from Mexico to the United Kingdom would generate 0.21kg CO2eq in transport emissions.11 This is only around 8% of avocados’ total footprint.12 Even when shipped at great distances, its emissions are much less than locally-produced animal products.
Which foods are air-freighted? How do we know which products to avoid?
They tend to be highly perishable foods. This means they need to be eaten soon after they’ve been harvested. In this case, transport by boat is too slow, leaving air travel as the only feasible option.
Some fruits and vegetables tend to fall into this category. Asparagus, green beans, and berries are common air-freighted goods.
It is often hard for consumers to identify foods that have traveled by air because they’re rarely labeled as such. This makes them difficult to avoid. A general rule is to avoid foods with a very short shelf-life and that have traveled a long way (many labels have the country of ‘origin’, which helps with this). This is especially true for foods where there is a strong emphasis on ‘freshness’: for these products, transport speed is a priority.
So, if you want to reduce your diet's carbon footprint, avoid air-freighted foods where you can. But beyond this, you can have a larger difference by focusing on what you eat, rather than ‘eating local’. Eating less meat and dairy or switching from ruminant meat to chicken, pork, or plant-based alternatives will reduce your footprint by much more.
Endnotes
The 2018 Pew Research Center Survey polled people across the world on global threats: in many countries, more than 8 in 10 people said that climate change was a major threat to their country. Even in countries that showed less concern, a large percentage saw it as a major threat: 59% in the US said it was a serious threat.
This was a marked increase in concern from similar polls conducted a few years earlier.
Poore, J., & Nemecek, T. (2018). Reducing food’s environmental impacts through producers and consumers. Science, 360(6392), 987-992.
To express all greenhouse gases in carbon dioxide equivalents (CO2-eq), they are each weighted by their global warming potential (GWP) value. GWP measures the relative warming impact of one molecule or unit mass of a greenhouse gas relative to carbon dioxide over a given timescale — usually over 100 years. For example, one tonne of methane would have 34 times the warming impact of a tonne of carbon dioxide over 100 years. GWP100 values combine greenhouse gases into a single metric of emissions called carbon dioxide equivalents (CO2e). CO2e is then derived by multiplying the mass of emissions of a specific greenhouse gas by its equivalent GWP100 factor. The sum of all gases in their CO2e form provides a measure of total greenhouse gas emissions.
Sandström, V., Valin, H., Krisztin, T., Havlík, P., Herrero, M., & Kastner, T. (2018). The role of trade in the greenhouse gas footprints of EU diets. Global Food Security, 19, 48-55.
Weber, C. L., & Matthews, H. S. (2008). Food-miles and the relative climate impacts of food choices in the United States. Environmental Science & Technology.
This figure is very similar to the previous estimates from Joseph Poore and Thomas Nemecek (2018), where transport accounted for 6% of emissions.
Hospido, A., i Canals, L. M., McLaren, S., Truninger, M., Edwards-Jones, G., & Clift, R. (2009). The role of seasonality in lettuce consumption: a case study of environmental and social aspects. The International Journal of Life Cycle Assessment, 14(5), 381-391.
Carlsson-Kanyama, A., Ekström, M. P., & Shanahan, H. (2003). Food and life cycle energy inputs: consequences of diet and ways to increase efficiency. Ecological Economics, 44(2-3), 293-307.
'Food miles' are measured in tonne-kilometers, representing the transport of one tonne of goods by a given transport mode (road, rail, air, sea, inland waterways, pipeline, etc.) over a distance of one kilometer. Poore & Nemecek (2018) report that of the 9.4 billion tonne-kilometers of global food transport, air freight accounted for only 15 million. This works out at only 0.16% of the total; most foods are transported by boat.
Temperature-controlled transport by sea generates 23g CO2eq per tonne-kilometer, whereas temperature controlled air transport generates 1130g CO2eq per tonne kilometer.
We get this footprint value as: [9000km * 0.023kg per tonne-kilometer / 1000 = 0.207kg CO2eq per kg].
The average footprint of avocados is around 2.5kg CO2eq per kg.
Cite this work
Our articles and data visualizations rely on work from many different people and organizations. When citing this article, please also cite the underlying data sources. This article can be cited as:
Hannah Ritchie (2020) - “You want to reduce the carbon footprint of your food? Focus on what you eat, not whether your food is local” Published online at OurWorldinData.org. Retrieved from: 'https://archive.ourworldindata.org/20251125-173858/food-choice-vs-eating-local.html' [Online Resource] (archived on November 25, 2025).BibTeX citation
@article{owid-food-choice-vs-eating-local,
    author = {Hannah Ritchie},
    title = {You want to reduce the carbon footprint of your food? Focus on what you eat, not whether your food is local},
    journal = {Our World in Data},
    year = {2020},
    note = {https://archive.ourworldindata.org/20251125-173858/food-choice-vs-eating-local.html}
}
Reuse this work freely
All visualizations, data, and articles produced by Our World in Data are completely open access under the Creative Commons BY license. You have the permission to use, distribute, and reproduce these in any medium, provided the source and authors are credited.
The data produced by third parties and made available by Our World in Data is subject to the license terms from the original third-party authors. We will always indicate the original source of the data in our documentation, so you should always check the license of any such third-party data before use and redistribution.
All of our charts can be embedded in any site.