Land Use
How is humanity using the Earth’s land? And how can we decrease our land use so that more land is left for wildlife?
This page was first published in September 2019. We made minor changes to the text in May 2024.
The focus of this topic page is land use for agriculture. However, we are also studying other uses of land, including land required for human settlement.
Agriculture is a major use of land. Half of the world’s habitable land is used for agriculture. The extensive land use of agriculture has a major impact on the Earth's environment as it reduces wilderness and threatens biodiversity.
Reducing the consumption of resource-intensive products and increasing the productivity of land makes it possible to produce food with much fewer inputs and reduce the impact on the environment.
See all interactive charts on land use ↓
Related topics
Other research and writing on land use on Our World in Data:
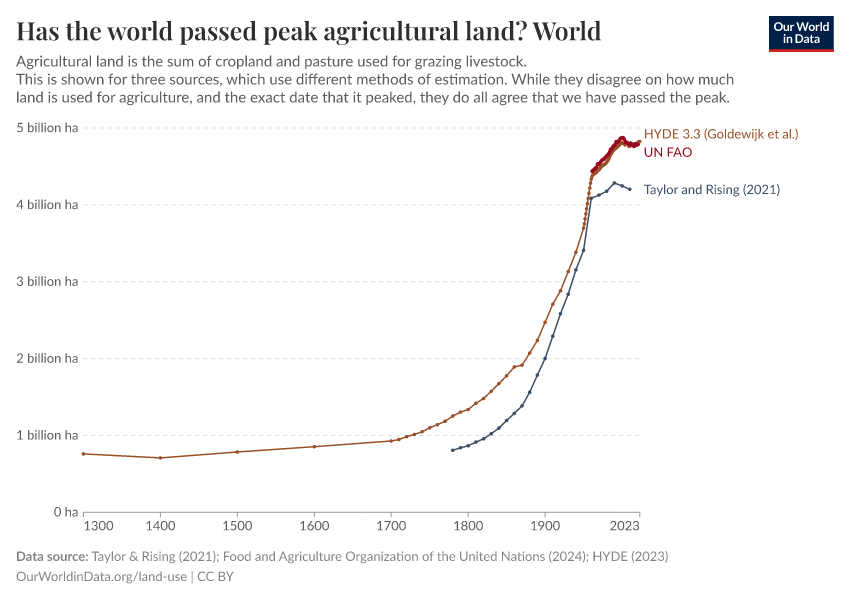
- After millennia of agricultural expansion, the world has passed ‘peak agricultural land’
- Half of the world’s habitable land is used for agriculture
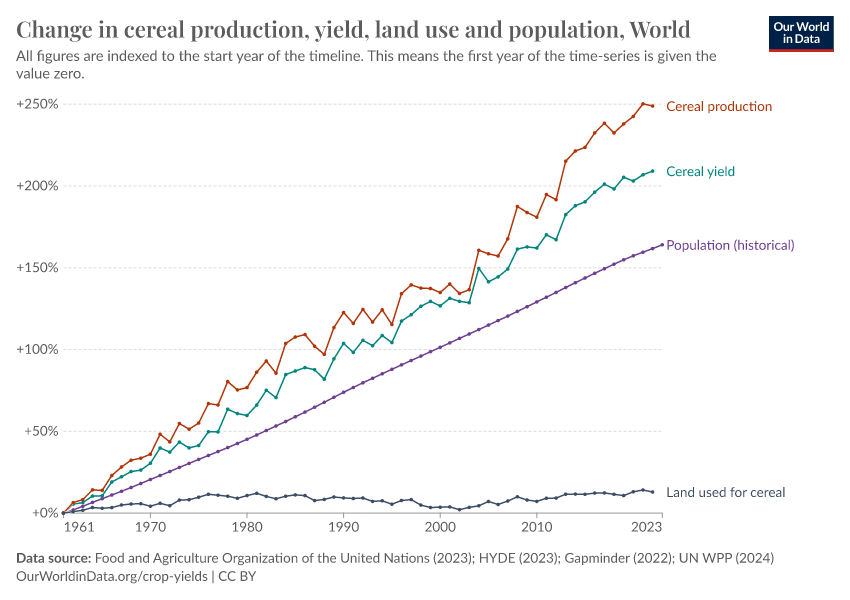
- Yields vs. land use: how the Green Revolution enabled us to feed a growing population
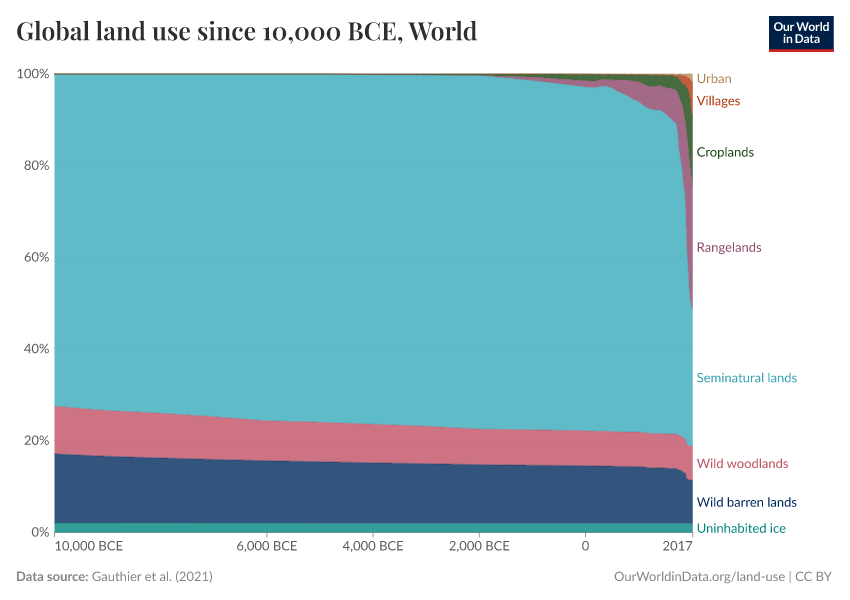
How has global land use changed over the long term?
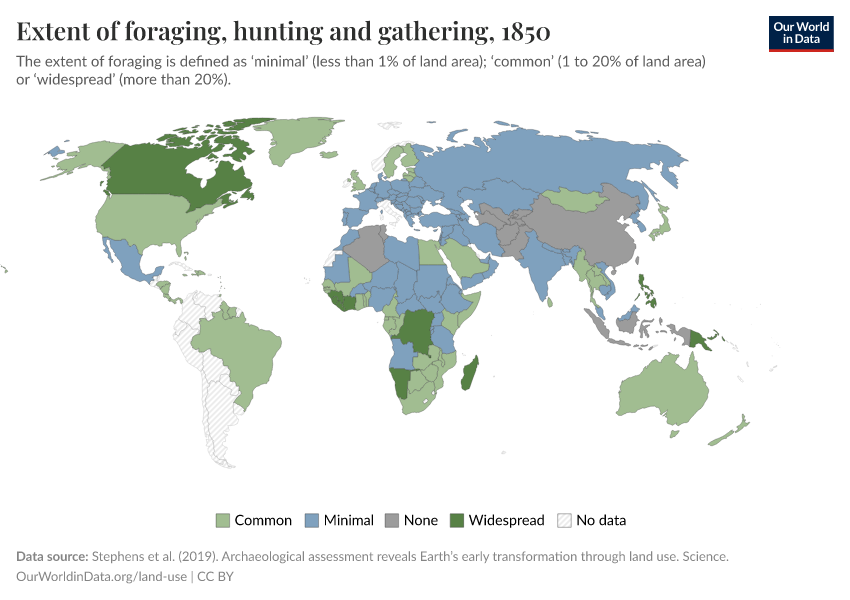
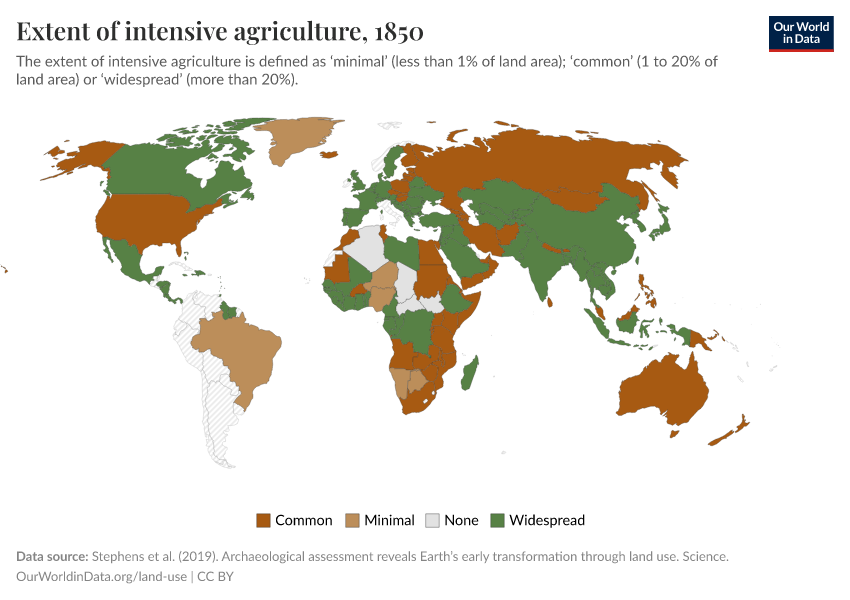
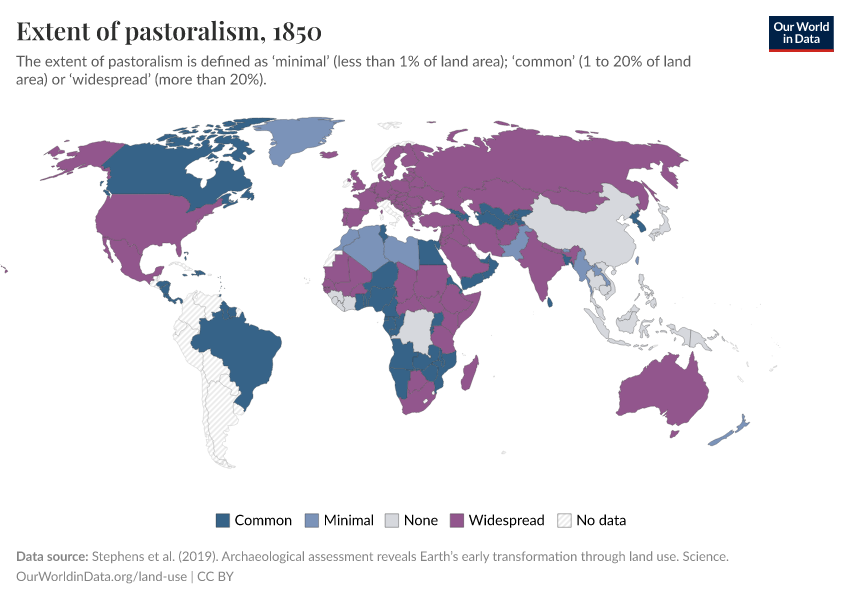
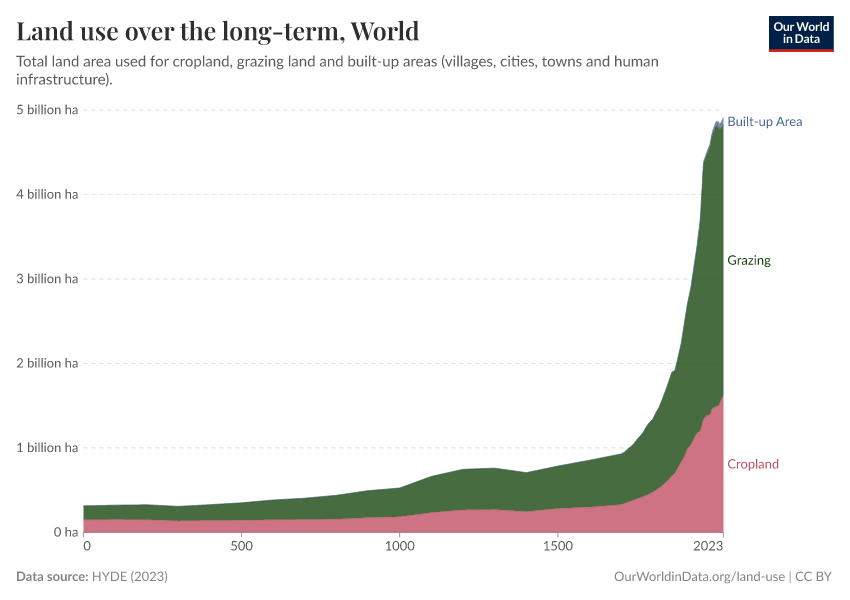
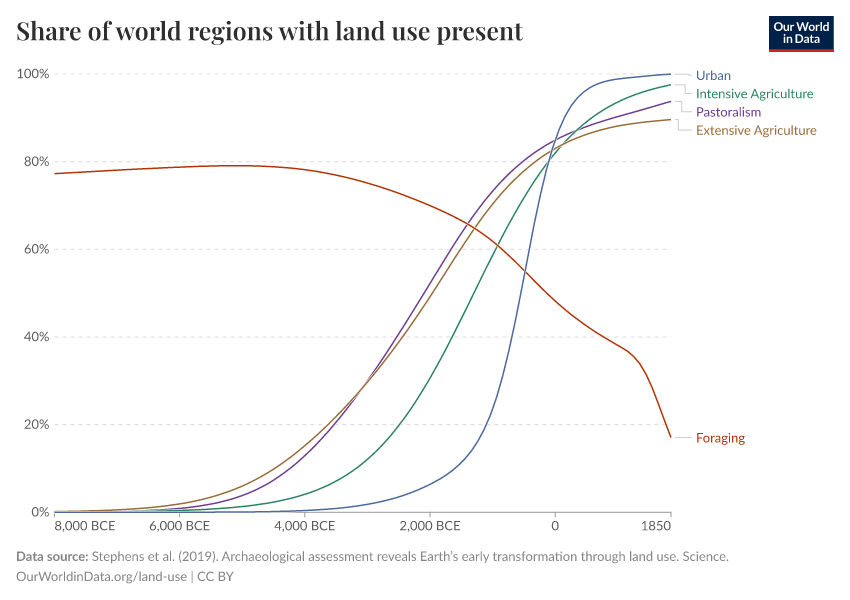
The visualization shows human land use over the long term (since 10,000 BCE) and details the change in total land used for cropland, grazing land, and built-up/urban area in hectares. This can also be viewed by select countries and all regions using the "change country or region" option.

Agricultural land use over the long run
Total agricultural land use
This visualization shows the total land used for agriculture (which is a combination of cropland and grazing land) over the long term, measured in hectares. In the following sections, you can find disaggregated data on cropland and grazing land change over time.

Cropland use
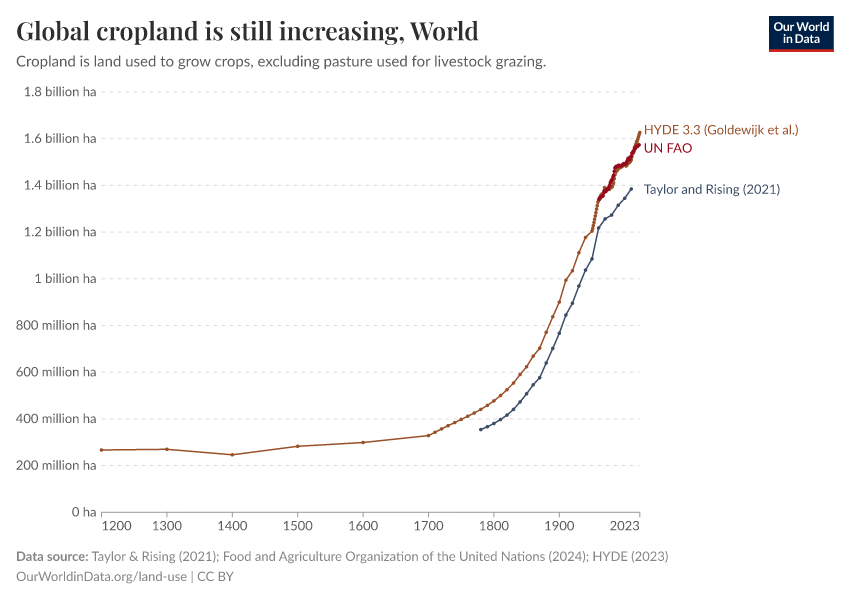
This visualization shows total cropland (which does not include land for grazing) over the long term, measured in hectares.

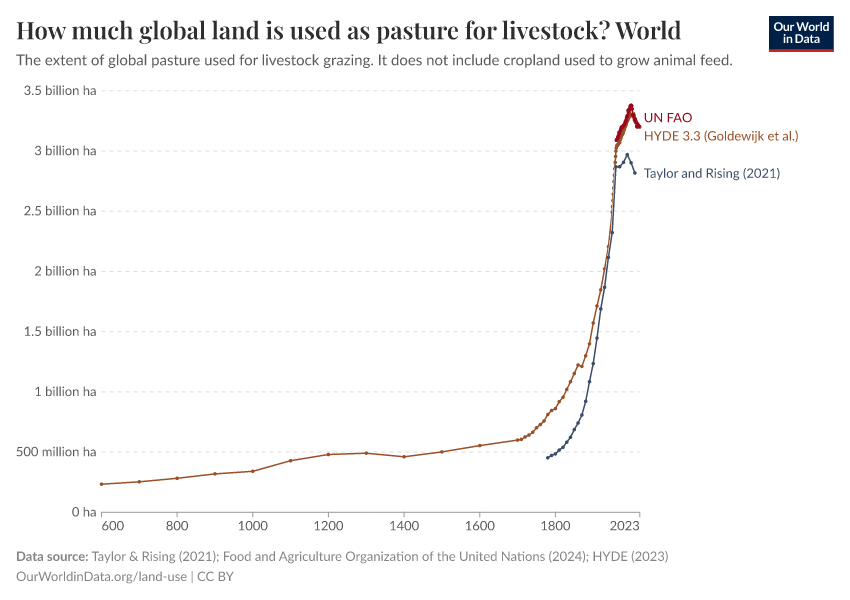
Grazing land use
This visualization shows total grazing land over the long term, measured in hectares.

How much land do countries use for agriculture?
We use roughly half of global habitable land for agriculture. But how much of the total land area is utilized for agriculture across the world? In the map here we see the share of total (both habitable and non-habitable) land area used for agriculture.
There is large variability in the share of land a given country uses for agriculture. Allocation ranges from less than ten percent, for example the Scandinavian region, to close to 80 percent in some countries (including the UK, Uruguay, South Africa, Nigeria, and Saudi Arabia). It's important to note that this metric includes both land used for arable (cropland) production and pasture land for livestock grazing; this means that agriculture can consume a large share of land area, even in arid and semi-arid regions where extensive arable farming is not possible. We will explore this difference in cropland and pastureland in the following section.
If we view the map in "chart" mode, we see how the allocation of land to agriculture has changed over time across the global regions. The share of land used for agriculture has been slowly increasing across most of the world's regions over the past few decades. However, land use across Europe and Central Asia- particularly within the European Union (EU) zone- and North America has been declining.

Arable agriculture (cropland)
There are two main uses of agricultural land: arable farming (which is land dedicated to growing crops) and pastureland (which includes meadows and pastures used for livestock rearing). In the chart here we see a global map of land used for arable agriculture (as a share of total land area).
For most countries, as we will show in the section below, land use for livestock grazing is dominant relative to arable farming. For most countries, land dedicated to cropland is typically below 20 percent, with many countries dedicating less than 10 percent. There are some notable exceptions, however; countries in South Asia and Europe allocate a large share of land area to arable farming. India, Bangladesh, Ukraine, and Denmark all dedicate a large share of their total land area to cropland.

Pastureland (permanent meadows and pasture)
For most countries, the majority of agricultural land is used for livestock rearing in the form of pastureland. In the map here we see the share of permanent meadow and pasture as a percentage of total land area.
In contrast to arable farming, land use for livestock in Europe and South Asia, in particular, is typically less than 20 percent. However, most continental regions have countries where pastureland reaches close to half of the total land area. In some countries (particularly in Central Asia, including Mongolia, Kazakhstan, and Turkmenistan), this can reach up to 70 percent. Livestock farming can take place across a range of diverse climatic and environmental regions (for example, from cattle rearing in temperate regions to sheep farming in hilly and semi-arid terrain), meaning that this type of agriculture is potentially less geographically constrained than arable farming.

Cropland use per person
Cropland per person over the long term
The visualization here shows the change in the average cropland use per person over the long term (since 10,000 BCE), measured in hectares per person.

Cropland use per person in the near term
The global population has more than doubled since the mid-twentieth century. To meet the demands of a rapidly growing population on a planet with finite land resources, reducing our per capita land footprint is essential.
In the chart here we have plotted trends of the average arable land use per person across the world's regions. Overall, we see that the arable land use per capita has declined across all regions since 1961. Per capita land use is highest in North America — more than double the land use of any other region. Land use in Asia — both in South and East Asia is lowest (5-6 times less than in North America). Rates of reduction in South Asia have been the most dramatic; per capita land use in recent years is roughly one-third of its value in 1961.

Agricultural land use per person
Agricultural land per person over the long term
The visualization shows the change in the average agricultural land use (which is the sum of cropland and grazing area) per person over the long term (since 10,000 BCE), measured in hectares per person.

Agricultural land per person over the near term
If we extend our land coverage above from arable land use to total agricultural land (which is the sum of arable, permanent crops and pastures and meadows), we still see overall declines in land per person but with different rates and patterns of reduction. Overall, we see that agricultural land per person is higher than that of arable land. At the global level, per capita agricultural land use is now less than half its value in 1961.
Africa, in particular, has seen dramatic reductions in agricultural land per person – it is now less than one-third of the value it was in the 1960s. The Americas (North and South) and Africa have notably higher per capita agricultural land use relative to Europe and Asia.

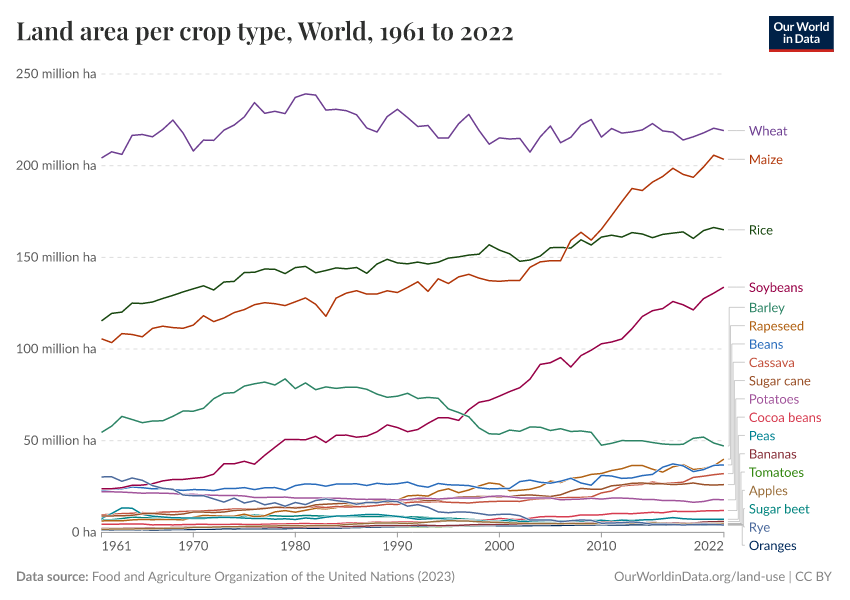
Land use by crop
In the chart here, we see the global area of land use in agriculture by major crop types from 1961 onwards. Overall, we see that the majority of our arable land is used for cereal production; this has grown by around 70 million hectares — an area roughly twice the size of Germany. The total land area used for coarse grains has remained approximately constant since 1961 and is the second largest user of arable land.
The most dramatic increase in land allocation is in the production of oil crops. The total land area used for oil crop production has increased about threefold since 1961 — an area just short of the size of Mexico.

Land use by food type
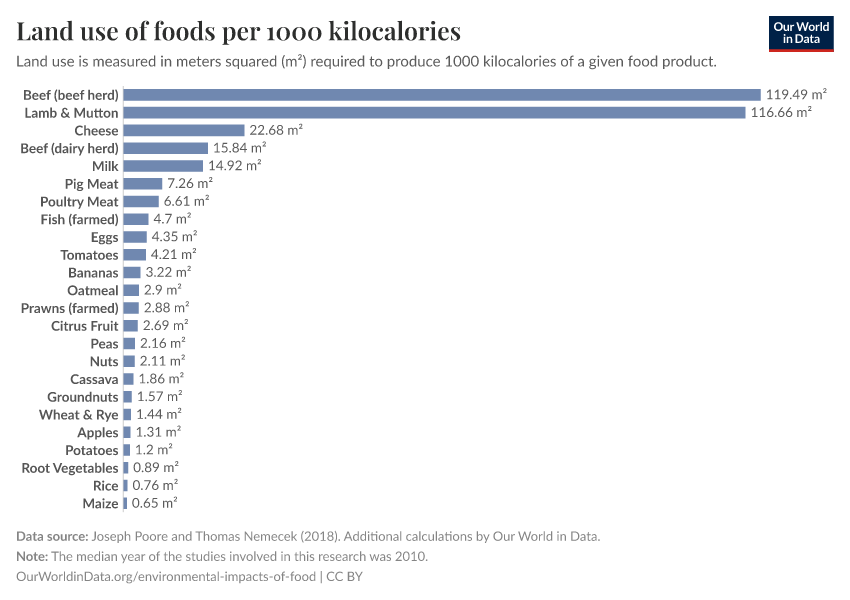
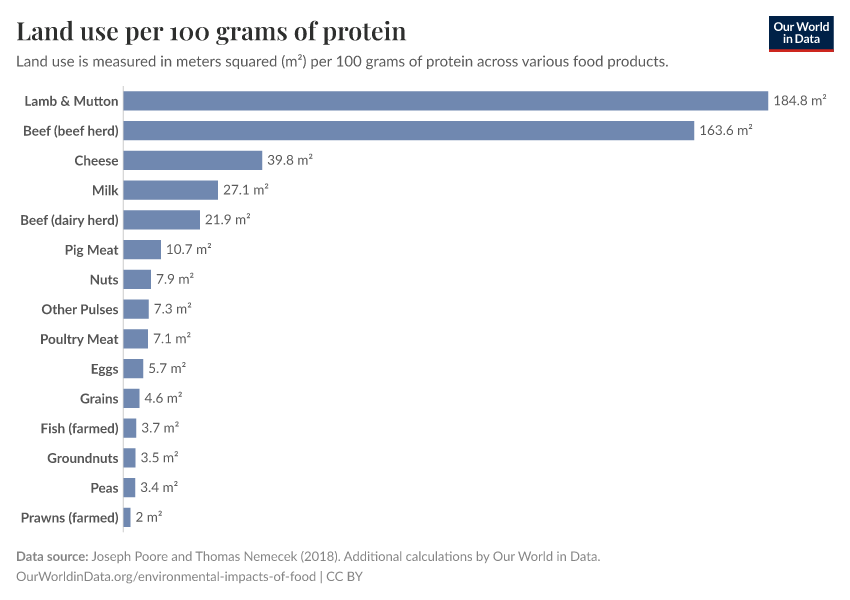
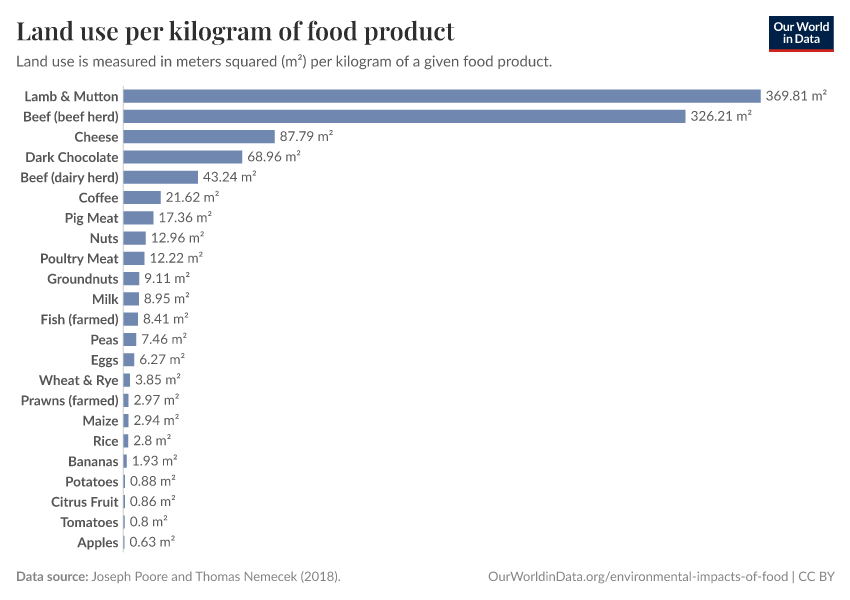
The amount of land required to produce food has wide variations depending on the product — this is especially true when differentiating crops and animal products. In the chart here we have plotted the average land required (sometimes termed the "land footprint") to produce one gram of protein across a range of food types.
At the bottom of the scale, we see that cereal crops typically have a small land impact per unit of protein (although such protein is often lacking in some essential amino acids). At the upper end of the spectrum, we find meat products, with the land required for beef or mutton up to 100 times larger than cereals. However, it's important to note the differences in land required across the meat products: poultry and pork have a land footprint 8-10 times lower than that of beef. This means individuals can make notable reductions in the environmental impact of their diets simply by substituting lower-impact meat products for beef, lamb or mutton.

Arable land needed per unit of crop production
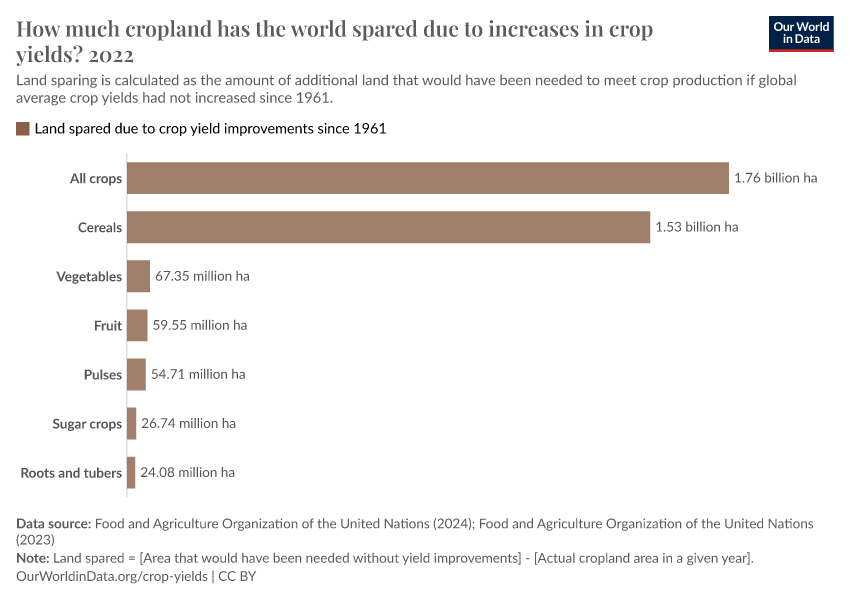
This visualization shows the index of the arable land area needed to produce an equivalent aggregate of crop production relative to the land area needed in 1961, i.e., values in 1961 are equal to 1.0. For example, globally, in 2014, the index value was 0.3; this means only 30% of the arable land area was needed to produce the same quantity of crops relative to 1961. 70% less land was needed.
This data can be viewed for other countries and regions by selecting 'Edit countries and regions' on the chart.
The crop production index (PIN) is the sum of crop commodities produced (after deductions of quantities used as seed and feed). It is weighted by the commodity prices. The FAO explains the construction of the PIN in detail here.
The idea for this chart is taken from Ausubel, Wernick, and Waggoner (2013).1
The authors write:
A combination of agricultural technologies raised yields, keeping downward pressure on the extent of cropland and sparing land for nature.
Countering the global rise of population and affluence by parents and workers, consumers and farmers restrained the expansion of arable land by changing tastes and lifting yields. The noticeable shrinkage in the extent of cropland as a function of the Crop Production index since 1990 provides encouragement that farmers will continue sparing land.

Definitions
Land use categories
The following discussions on global land use (particularly in relation to agriculture) cover a number of definitions and combined categories. It is, therefore, useful to understand the differences between land use terminology, for example, the definition of "arable land" versus "agricultural land".
To provide some clarity on the definitions used here (and the common terminology within the literature), we have visualized these land use categories and groupings in the chart shown here. Also shown are the definitions of each. The groupings and definitions shown below are based on the UN Food and Agricultural Organization (FAO) and should, therefore, be consistent with most international data sources.
Definitions of agricultural land use
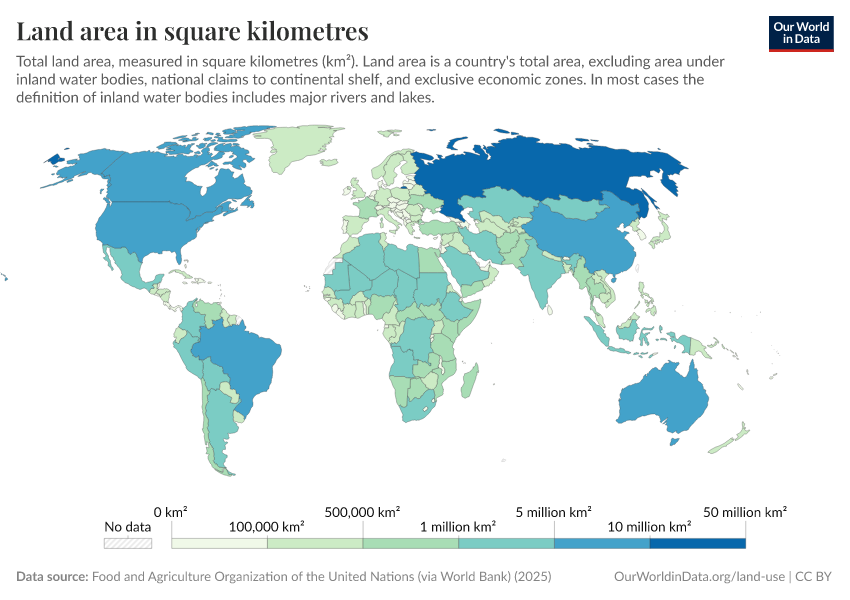
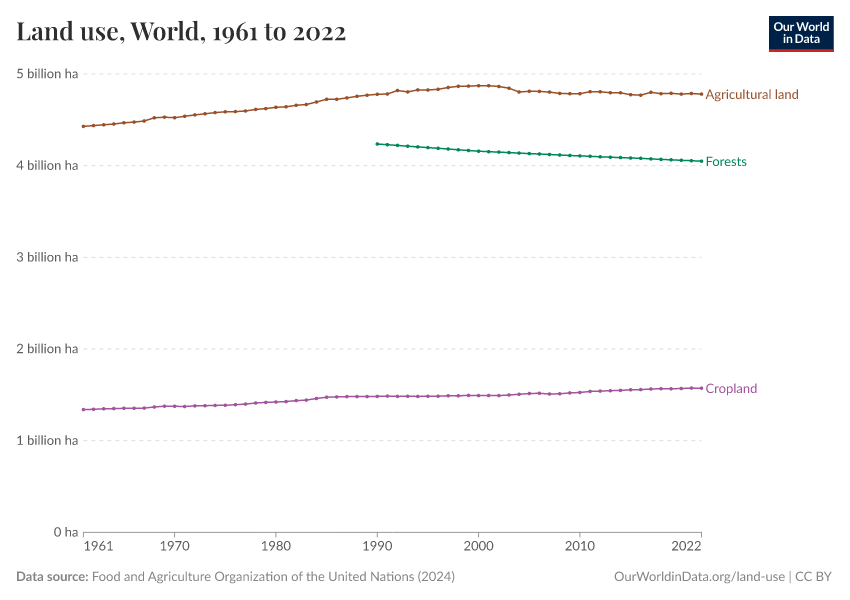
The land area of the World is 13 billion hectares. 4.8 billion are classified as 'agricultural area' by the FAO (this is 37% of the land area).
The agricultural area use is divided into two categories: cropland (33% of the global agricultural area and permanent meadows and pastures (67%) which account for the largest share of the world's agricultural area.2
What do these words mean?
The agricultural area is the sum of cropland, permanent meadows, and pastures.
The FAO definition for cropland is land used for cultivation of crops. The total of areas under ''Arable land'' and ''Permanent crops''.
Arable land is land used for cultivation of crops in rotation with fallow, meadows and pastures within cycles of up to five years. The total of areas under "Temporary crops,'' ''Temporary meadows and pastures,'' and ''Temporary fallow.'' Arable land does not include land that is potentially cultivable but is not cultivated.
Permanent crops are sown or planted once and then occupy the land for some years and need not be replanted after each annual harvest, such as cocoa, coffee, and rubber. This category includes flowering shrubs, fruit trees, nut trees, and vines but excludes trees grown for wood or timber. Again, from the same source, the definition of permanent meadows and pastures is 'land used permanently (five years or more) to grow herbaceous forage crops, either cultivated or growing wild (wild prairie or grazing land).'
Permanent meadows and pastures are defined as land used permanently (five years or more) to grow herbaceous forage crops through cultivation or naturally (wild prairie or grazing land). This class includes: grazing in wooded areas (agroforestry areas, for example); grazing in shrubby zones (heath, maquis, garigue); grassland in the plain or low mountain areas used for grazing: land crossed during transhumance where the animals spend a part of the year (approximately 100 days) without returning to the holding in the evening: mountain and subalpine meadows and similar; and steppes and dry meadows used for pasture.
Key Charts on Land Use
See all charts on this topic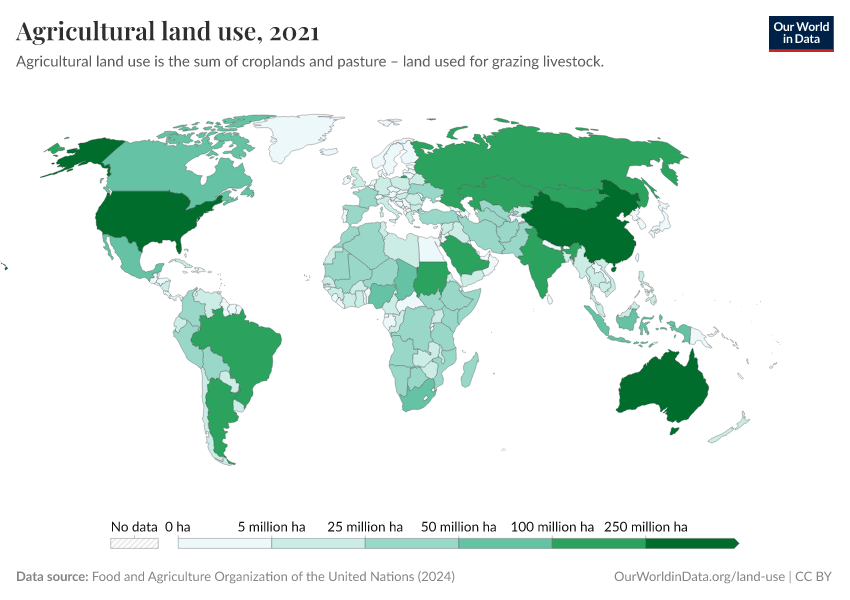


Featured Data on Land Use
Endnotes
Jesse H. Ausubel, Iddo K. Wernick, Paul E. Waggoner (2013) – Peak Farmland and the Prospect for Land Sparing. Population and Development Review, Volume 38, Issue Supplement s1, pages 221–242, February 2013. DOI: 10.1111/j.1728-4457.2013.00561.x. Online here.
These numbers are taken from the FAO (2023) – Statistical Yearbook. Figure 3. Online here.
For comparison: The area of the USA, Canada, and China are all short of 1,000 million ha (USA 963 million ha, China 932 million ha, Canada 909 million ha).
Cite this work
Our articles and data visualizations rely on work from many different people and organizations. When citing this topic page, please also cite the underlying data sources. This topic page can be cited as:
Hannah Ritchie and Max Roser (2019) - “Land Use” Published online at OurWorldinData.org. Retrieved from: 'https://ourworldindata.org/land-use' [Online Resource]BibTeX citation
@article{owid-land-use,
    author = {Hannah Ritchie and Max Roser},
    title = {Land Use},
    journal = {Our World in Data},
    year = {2019},
    note = {https://ourworldindata.org/land-use}
}
Reuse this work freely
All visualizations, data, and articles produced by Our World in Data are completely open access under the Creative Commons BY license. You have the permission to use, distribute, and reproduce these in any medium, provided the source and authors are credited.
The data produced by third parties and made available by Our World in Data is subject to the license terms from the original third-party authors. We will always indicate the original source of the data in our documentation, so you should always check the license of any such third-party data before use and redistribution.
All of our charts can be embedded in any site.