Air pollution kills millions every year — where does it come from?
A breakdown of the sources of many air pollutants that damage our health and ecosystems.
Millions of people die prematurely from air pollution every year. This problem has existed since humans started burning materials for fuel — first wood and biomass, then fossil fuels.
But it’s an environmental and public health problem that we can make progress on. We know this because the world has already been successful in reducing air pollutants, and many countries that used to be highly polluted now have much cleaner air than they used to.
To tackle air pollution effectively — to focus our efforts on the interventions that will have the biggest impact — we need to understand where it’s coming from.
That’s why we wrote this article.1
How air pollution damages our health
Before we discuss the sources of some of the key air pollutants, we should briefly explain how air pollution affects human health and how each of these pollutants contributes to this.
There are three key pathways by which a pollutant can cause harm3:
- Direct exposure: Some gases are toxic and can have an acute effect on health. These acute impacts are more common for people with existing respiratory conditions such as asthma or chronic obstructive pulmonary disease (COPD). This direct exposure does cost lives, but the total number is relatively small compared to the millions that die from chronic exposure to air pollution.
- Formation of particulate matter: Many of the pollutants we’ll look at contribute to health impacts indirectly by breaking down to form secondary smaller particles. These particles are called “particulate matter”. Typically, the smaller the particles are, the worse they can be for human health because they can enter our lungs and airways — and, in some cases, the bloodstream. Particulate matter can cause respiratory and cardiovascular problems, including cancer, strokes, and heart attacks.
- Formation of ozone: Another indirect way these pollutants can affect our health is by forming a gas called ozone (O3). Ozone can cause breathing problems and worsen acute conditions like asthma and COPD4. However, it also affects our health through chronic exposure by causing inflammation of the lungs, increasing the risk of respiratory diseases, and reducing our cardiovascular health.
As we discuss each pollutant, we’ll briefly explain how it affects health through one or several pathways. While it’s difficult to pinpoint exactly how many deaths each pollutant causes, wherever possible, we’ll also try to give a rough order of magnitude estimate.
To give some sense of scale, here is the Global Burden of Disease’s breakdown of global deaths from air pollution.5
In 2021, this totaled around 8 million deaths. Note that there are also natural sources of particulate matter, so not all of these pollution deaths resulted from human emissions. But most did. For more on this, see our colleague Max Roser’s article, which looks at estimates from various sources.
3.1 million came from household air pollution, a combination of direct toxicity and particulate matter. 4.7 million came from outdoor particulate matter, and another half a million from outdoor ozone pollution.6

Breaking down the sources of different air pollutants
Sulfur dioxide: the source of acid rain
Sulfur dioxide (SO2) is the main pollutant that causes acid rain. This has been a major environmental problem because acid rain can change the chemistry of rivers and lakes, affecting fish populations, soils, and the extent and quality of forests. You can also see the effects of acid rain on older limestone and marble buildings and statues, where the acidity dissolves parts of the structure.
There are two ways that SO2 can threaten human health. First, direct inhalation of SO2 can exacerbate respiratory problems such as asthma and bronchitis. But its main contribution is by breaking down to form small particulate matter. While an exact figure is hard to pin down, given that sulfur dioxide is a substantial contributor to particulate matter and that at least 4 million deaths are linked to these small particles yearly, we would estimate that hundreds of thousands of deaths per year are linked to SO2.
SO2 is formed when we burn fuels that contain sulfur.
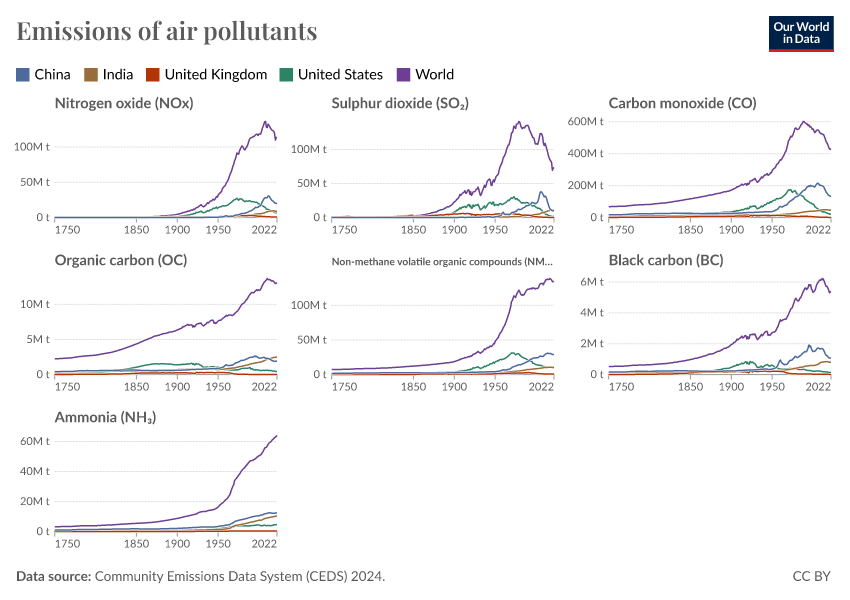
The charts below show where global emissions come from and how these sectors have changed over time. In 2022, energy production was the biggest contributor by far. This is predominantly due to power from coal, which has sulfur impurities that are released when it’s burned.
The main contribution of the industry is the metal smelting process.7 This is because many of the ores that are used to produce metals – such as pyrite – contain large amounts of sulfur, which is released when they are roasted at high temperatures.
Oil also contains sulfur, which is why road transport, shipping, and aviation all contribute. Shipping emissions have received a lot of attention in the last few years because they dropped by more than 70% in 2020 after the introduction of tight regulations on maritime fuels.
You’ll notice that global emissions of SO2 peaked in 1979 and have almost halved since then, thanks to the introduction of pollution controls, particularly in Europe, North America, and China. SO2 can be removed from smokestacks in coal plants using technologies that filter or “scrub” the sulfur away before it’s emitted into the atmosphere. This, combined with a move away from coal in Europe and North America, has led to a rapid reduction in emissions.
Nitrogen oxides (NOₓ): the reason car exhaust fumes are so damaging
Nitrogen oxides (NOₓ) are a group of gases, mostly made up of nitric oxide (NO) and nitrogen dioxide (NO2). They are formed when fossil fuels are burned, causing nitrogen in the air — and, to a lesser extent, in the fuel itself — to react with oxygen.
Like sulfur dioxide, which we just looked at, NOₓ can cause acid rain, threatening wildlife and ecosystems. NOₓ has a particularly large impact on human health because it acts through all three mechanisms we looked at earlier. It can be acutely toxic, inflaming the lungs. It reacts with other gases to form particulate matter, and it also forms ozone. NOₓ, therefore, causes smog and the thick haze you often see in highly polluted cities.
Again, we don’t have exact estimates for how many deaths it contributes to. But, given that it’s a main source of ozone (which kills around half a million) and a substantial fraction of particulate matter (which kills several million), it’s reasonable to expect that NOₓ is linked to over a million deaths yearly.
Since coal, oil, and gas all contain nitrogen, NOₓ is produced in various sectors, as the chart below shows. The biggest source is transport — mostly from road vehicles — where NOₓ is emitted from the exhaust of cars and trucks. This is almost matched by the burning of coal and gas for electricity production, shown as “energy” in the chart. Like road transport, burning fuel for shipping emits significant amounts of NOₓ, making it a leading source, too.
And industrial processes such as metal smelting, cement production, and petroleum refining contribute a lot.
A smaller but still important source is agriculture. When nitrogen is applied to crops as synthetic fertilizer or manure, some of this nitrogen is converted to nitrogen oxides (and ammonia, which we’ll come on to later) in the soil.8 While emissions of NOₓ from processes such as transport and electricity production have declined a lot globally, progress on agriculture has been much slower: emissions have flatlined but have not fallen much.
Some countries have been successful in drastically reducing emissions of NOₓ – with huge benefits for human health. Moving away from fossil fuels – particularly coal in electricity production – has led to a large decline in “energy” emissions (have a look at the United Kingdom as an example). Setting pollution control standards for automakers has also played a crucial role in reducing emissions from road transport. NOₓ emissions from exhausts can be dramatically reduced through the use of catalytic converters, which are devices that split the NOₓ compounds into nitrogen and oxygen before they are released into the atmosphere.
Black carbon: the soot that fills our skies and lungs
Black carbon (BC) are the small particles that many of us know as “soot”.
As most of us know from experience — such as lighting a bonfire — soot is formed when we burn materials such as wood and biomass or fossil fuels like coal. It’s the incomplete combustion of these materials that leads to the formation of these BC particles.
These particles are black because they absorb light, and this absorption of sunlight contributes to climate change. However, when it comes to health, it contributes through its direct toxicity and the formation of small particulates.
Black carbon can be a major issue for household and outdoor particulate matter and probably contributes to several million deaths per year.
In the charts below, you can see the sources of black carbon globally.
Buildings are a major source because many households in low- and middle-income countries still cook and heat with wood, charcoal, and other solid fuels. Even in richer countries, some households continue to burn wood for heating.
Road transport is another major contributor, since BC is formed from diesel engines and exhausts.
Energy production’s contribution mostly comes from coal and biomass burned for electricity and heat.
The open burning of waste plays a surprisingly large role, particularly in low-to-middle-income countries, where this is often used for waste disposal.
Some countries — particularly richer ones — have seen a huge drop in black carbon emissions over the last 50 years due to moving away from biomass and coal burning and introducing cleaner cars.
Methane: burping cows, rice paddies, and gas leaks
Methane (CH4) is a greenhouse gas, so it’s mostly discussed regarding contributions to climate change. However, methane can also affect health when it breaks down to form ozone, a gas that’s hazardous to human health. In fact, methane is the biggest precursor to ozone in many places.
It’s estimated that methane can lead to up to half a million premature deaths a year.9
The charts below show where it comes from.
Agriculture, specifically livestock and rice production, is the biggest source of methane. Ruminant livestock — mostly cows — produce methane in their digestive systems and release it into the atmosphere by burping. That’s why beef and lamb tend to have a high carbon footprint.10 Rice also produces methane because it’s often grown in flooded paddy fields with low oxygen levels. This means methane is produced rather than carbon dioxide. Eating less beef, lamb, and dairy could dramatically reduce emissions from agriculture. Finding innovative ways to reduce the amount of methane produced per cow by changing their diets could also help.
Energy generation is another large source of methane. Most of it comes from leaks — which we call “fugitive emissions” — from oil and gas wells. If these are not properly managed, some methane escapes into the atmosphere. Another key source is coal mining. Monitoring oil and gas wells for methane leaks and enforcing regulations to ensure that limits are not breached can reduce these emissions. New drone and satellite technologies are already being developed to provide a global map of where these leaks are coming from.
The third sector that contributes a lot is waste. Methane is produced when organic material — like food waste or paper — rots in conditions without much oxygen (like in a landfill). Securely sealing landfills or capturing this methane for energy can effectively reduce these emissions. Methane from waste has been falling in many richer countries — like the United Kingdom — that have implemented these strategies.
Ammonia (NH3): it’s all about farming
As the chart below shows, nearly all human emissions of ammonia (NH3) come from agriculture. When we add nitrogen to crops as synthetic fertilizers or manure, some of this nitrogen is converted into NH3 in the soil. Other smaller sources include decomposing organic waste in landfills and energy production.
Although NH3 doesn’t stay in the atmosphere for long — typically hours to days — it can react with other gases to form small particulates that harm human health.
Some studies suggest ammonia could drive several hundred thousand (up to 385,000) premature deaths from particulate matter.11
In the charts below, you can see that unlike most other air pollutants, where emissions have peaked globally, emissions of NH3 have continued to rise as livestock production and the use of synthetic fertilizers have increased.
Some countries — particularly those in Europe — have achieved small reductions in emissions because they use less fertilizers than a few decades ago.
Non-methane volatile organic compounds (NMVOCs)
Non-methane volatile organic compounds (NMVOCs) can threaten human health through all three of the pathways we looked at earlier: they can be directly toxic in high concentrations and mix with other gases to form ozone and small particulates.
You can see the global sources of NMVOCs in the chart below.
NMVOCs are produced by traditional pollution sources like burning fossil fuels and car exhausts. However, unlike most other pollutants, solvents such as paints, cleaning products, and chemical plants are also major sources.
In addition to switching to low-carbon energy and phasing out gasoline cars, we also need to reduce the use of volatile organic compounds (VOCs) in personal care products and solvents. Setting emission limits on the chemicals industry will also be key to lowering our exposure to non-methane VOCs (NMVOCs).
While pollution sources are diverse, the solutions are often not
Going through so many pollutants, one by one — as we just did — can seem overwhelming. We don’t need to just tackle one or two; we need to tackle more than six.12
The good news is that the solutions we need often cut across several gases at the same time.
Burning stuff for energy — whether that’s fossil fuels or biomass — is the root source for many of these gases. Moving to clean energy — deploying renewable or nuclear electricity, electrifying our cars, our industry, and home heating — and ensuring that people worldwide have access to modern energy sources would simultaneously cut many of these pollutants.
Reducing meat production and consumption by shifting to more plant-based diets would reduce methane and ammonia emissions at the same time, too.
These transitions come with large health benefits, just from reducing air pollution alone.
And we know that it can be done. Many countries have dramatically reduced levels of air pollution, and as you can see in the chart below, they’ve prevented hundreds of thousands of early deaths as a result.

Acknowledgments
Many thanks to Max Roser and Edouard Mathieu for their feedback and comments on this article.
Continue reading on Our World in Data
Endnotes
Here, we’re not talking about greenhouse gases that drive climate change — which we cover in great detail elsewhere — although we will include a few greenhouse gases, such as methane, which can also act as a precursor to local air pollutants.
Hoesly, R. M., Smith, S. J., Feng, L., Klimont, Z., Janssens-Maenhout, G., Pitkanen, T., ... & Zhang, Q. (2018). Historical (1750–2014) anthropogenic emissions of reactive gases and aerosols from the Community Emissions Data System (CEDS). Geoscientific Model Development, 11(1), 369-408.
World Health Organization (2021). WHO global air quality guidelines: particulate matter (PM2.5 and PM10), ozone, nitrogen dioxide, sulfur dioxide and carbon monoxide.
Note that we’re talking about ground-level, or tropospheric, ozone in the lower atmosphere. At this level, it’s considered a pollutant. This differs from stratospheric ozone, which is high in the atmosphere and crucial for protecting us from ultraviolet radiation. We cover this in our work on the Ozone Layer. Mar, K. A., Unger, C., Walderdorff, L., & Butler, T. (2022). Beyond CO2 equivalence: The impacts of methane on climate, ecosystems, and health. Environmental science & policy.
The Global Burden of Disease is published by the Institute for Health Metrics and Evaluation (IHME).
Note that when we add all of these individual risk factors — indoor particulates, outdoor particulates, and outdoor ozone — the total comes to 8.3 million, which is higher than the Global Burden of Disease reports on aggregate. This is because different risk factors can combine to increase health problems and the risk of premature death. In this article, our colleague, Saloni Dattani, examines how risk factors are estimated and why they can’t be summed up to give the total number of premature deaths.
Fioletov, V. E., McLinden, C. A., Krotkov, N., Li, C., Joiner, J., Theys, N., ... & Moran, M. D. (2016). A global catalogue of large SO2 sources and emissions derived from the Ozone Monitoring Instrument. Atmospheric Chemistry and Physics, 16(18), 11497-11519.
Pan, S. Y., He, K. H., Lin, K. T., Fan, C., & Chang, C. T. (2022). Addressing nitrogenous gases from croplands toward low-emission agriculture. Npj Climate and Atmospheric Science.
This estimate comes from the UN Environment Programme and Climate and Clean Air Coalition:
UNEP and Climate and Clean Air Coalition (2021) Global Methane Assessment: Benefits and Costs of Mitigating Methane Emissions.
Although this is not the only reason they have a high carbon footprint, even when we ignore methane, they still emit much carbon through land use and manure.
Wyer, K. E., Kelleghan, D. B., Blanes-Vidal, V., Schauberger, G., & Curran, T. P. (2022). Ammonia emissions from agriculture and their contribution to fine particulate matter: A review of implications for human health. Journal of Environmental Management, 323, 116285.
We included six of the big ones in this article, but it’s not a complete list.
Cite this work
Our articles and data visualizations rely on work from many different people and organizations. When citing this article, please also cite the underlying data sources. This article can be cited as:
Hannah Ritchie and Pablo Rosado (2025) - “Air pollution kills millions every year — where does it come from?” Published online at OurWorldinData.org. Retrieved from: 'https://archive.ourworldindata.org/20260727-182932/air-pollution-sources.html' [Online Resource] (archived on July 27, 2026).BibTeX citation
@article{owid-air-pollution-sources,
    author = {Hannah Ritchie and Pablo Rosado},
    title = {Air pollution kills millions every year — where does it come from?},
    journal = {Our World in Data},
    year = {2025},
    note = {https://archive.ourworldindata.org/20260727-182932/air-pollution-sources.html}
}
Reuse this work freely
All visualizations, data, and articles produced by Our World in Data are completely open access under the Creative Commons BY license. You have the permission to use, distribute, and reproduce these in any medium, provided the source and authors are credited.
The data produced by third parties and made available by Our World in Data is subject to the license terms from the original third-party authors. We will always indicate the original source of the data in our documentation, so you should always check the license of any such third-party data before use and redistribution.
All of our charts can be embedded in any site.