How effective are policies in reducing the environmental impacts of agriculture?
All countries now have policies, but not all work as intended. Some drive trade-offs or lead to spillover impacts elsewhere, but there are many examples of successful stories.
Agriculture is a difficult problem to solve. It feeds 8 billion people but is also one of the world’s most environmentally damaging sectors. It’s the leading driver of deforestation, biodiversity loss, land use, freshwater withdrawals, and water pollution.
The world will need effective governmental policies — called agro-environmental policies — and innovations in sustainable food technologies if we want to reduce these impacts while feeding 9 or 10 billion people.
You might think, then, that the obvious thing to do is to have more and more policies focused on reducing its environmental impacts. But this assumes that all policies are effective and don’t impose trade-offs with food production or socioeconomic outcomes. This is not always the case.
Sri Lanka is a particularly dramatic case showing how rash and poorly designed policies can lead to tragic consequences. In mid-2021, the government abruptly banned the import of chemical fertilizers. On an agri-environmental policy scorecard, this might have looked good. Fertilizer use — which can cause pollution — plummeted.
But it caused dramatic losses in the country’s food supplies. Rice production fell by almost 40% from 2021 to 2022. The production of key export crops, such as tea and rubber, also fell significantly. The country spiraled into an economic crisis. While this crisis is not entirely the result of its fertilizer ban — the import ban was partly in response to economic problems — it made things worse.1
The lack of planning or foresight made this policy so damaging. Farmers had no time to find nutrient alternatives or learn how to optimize organic production. It illustrates clearly that just because a country has a policy in place doesn’t mean it produces good outcomes.
I’ve written previously about how different national priorities are when it comes to food production. Farmers in most low-income countries don’t have access to fertilizers, pesticides, irrigation, or other vital inputs, and their yields suffer as a result. In middle- and high-income countries, farmers often overuse fertilizers and pesticides, causing lots of water pollution.
Effective policies must consider trade-offs and priorities, not just in terms of national outcomes but also the global environmental and socioeconomic impacts.
In this article, I look at global data on agricultural policies, some success stories, and what policymakers need to consider to prevent environmental damage from being offshored to other countries.
How are national agri-environmental policies distributed across the world?
Agri-environmental policies can target a range of outcomes: fertilizers, pesticides, soil health, forests, and biodiversity, to name a few. They can also be enacted in different ways: as legislation, regulation, payment schemes, or monitoring frameworks.
David Wuepper and his colleagues collected data on agri-environmental policies in 200 countries from 1960 to 2022. This database was published in a new paper in Nature Food.2
Unsurprisingly, the number of policies has increased over time, with the majority coming into action in the 2000s and 2010s.
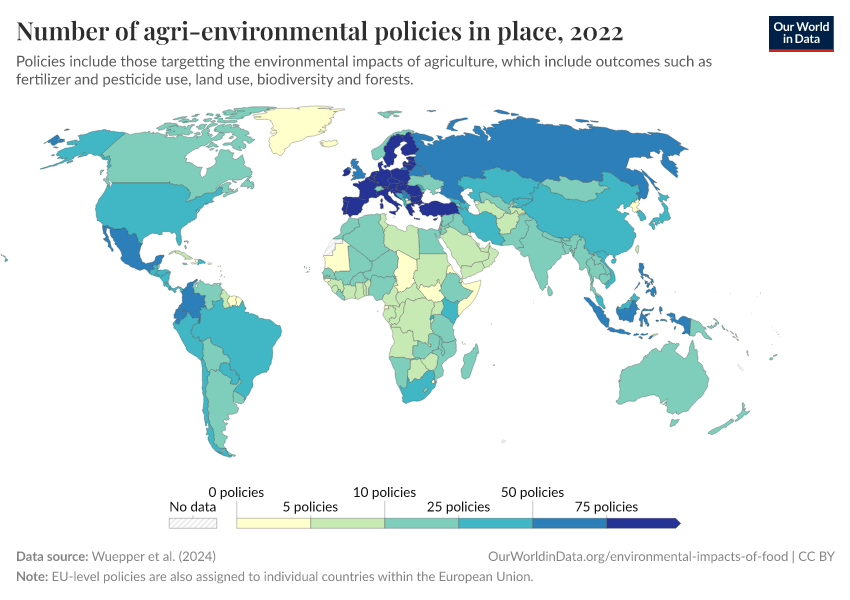
In the map below, we see the number of policies by country.3 Countries in the European Union tend to have the largest number of policies. Countries across Sub-Saharan Africa and some parts of Asia have far fewer. Most countries in the EU have more than 90 policies, compared to less than 20 across most of Africa.

The number of policies doesn’t tell us how strictly they’re enforced. A single well-implemented policy could be far more effective than 10 poor ones.
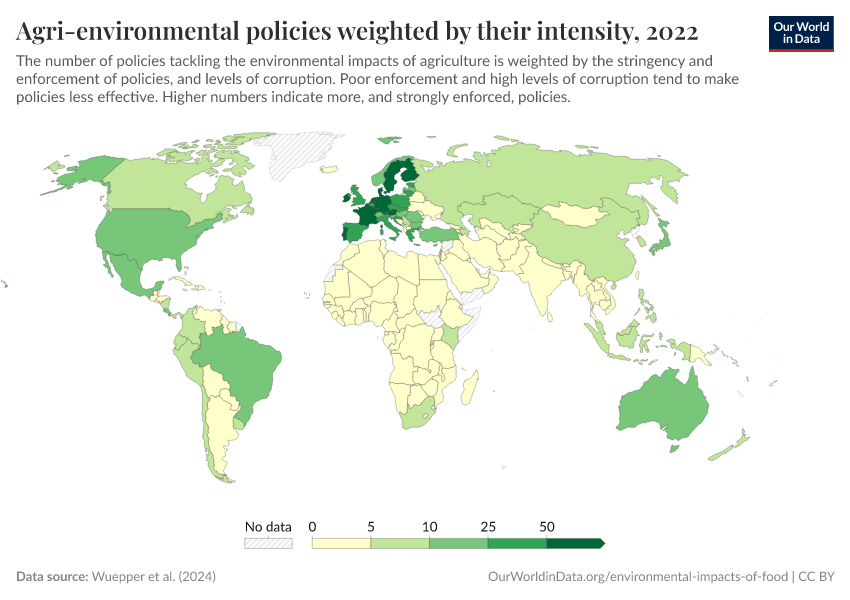
To account for this, the researchers developed an intensity-weighted metric. This weighs the number of policies by the levels of policy stringency and enforcement in a country and the levels of corruption they face.
This intensity-weighted metric is shown in the map below. The overall distribution is similar, which is not surprising. If anything, adjusting for intensity widens the gap between countries. That’s because the metrics are positively correlated, according to the researchers: countries with more policies also tend to have stronger enforcement and lower levels of corruption.

Richer countries tend to have more agri-environmental policies
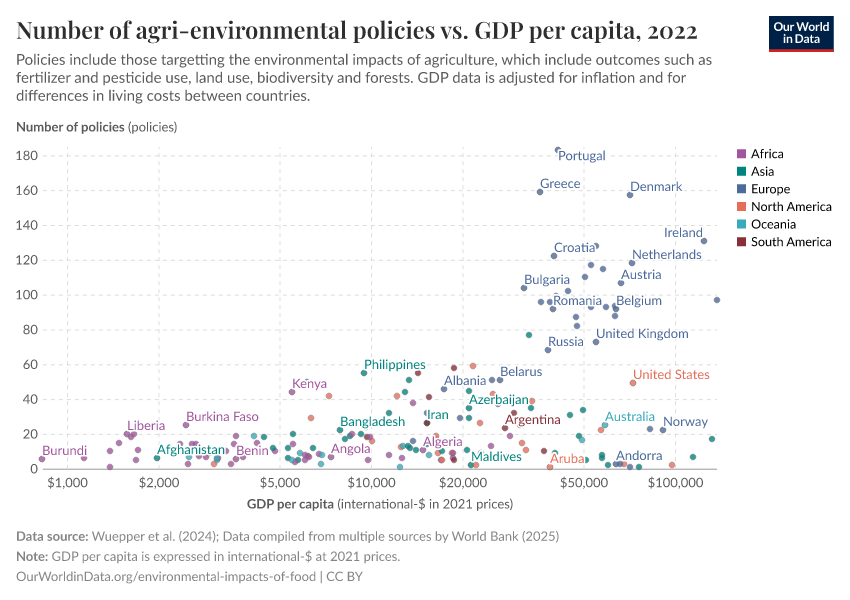
Both metrics — the number and intensity of policies — tend to be higher in richer countries. The chart below shows the number of policies measured against gross domestic product (GDP) per capita.
Most countries with large numbers of policies have a high average income. But being rich doesn’t guarantee that a country will put many policies in place. Some — such as Qatar, the United Arab Emirates, and Bahrain — have only a handful. You might think this is because their agricultural sector is small: farming makes up just a few percent of their GDP. But this is also true for most European countries. In the United Kingdom and Germany, it’s less than 1%. In France and Italy, less than 2%.

It’s worth noting that richer countries also tend to use more inputs such as fertilizers and pesticides, which are some of the most regulated parts of agriculture. It makes sense that they would have more targets and legislation to reduce it.
The European Union and the United States use about five times as much fertilizer per hectare as the African average. Within Africa, many countries use much less than this — as little as a few kilograms per hectare. Some lower-income countries use almost no fertilizers or pesticides and have little to regulate. This is shown in the chart below.

Are policies effective in reducing environmental impacts?
We’ll discuss some policy “failures” later. But let’s first examine some clear examples of policies that have effectively achieved their goals.
Countries across Europe have implemented policies to reduce fertilizer use. Many have been successful. As I mentioned earlier, a blanket ban on fertilizers, or even reduction policies in countries where farmers use very little, is likely detrimental. This is not the case in Europe: many farmers still overapply fertilizers, often with little benefit to yields.
In the chart below, you can see the change in total fertilizer consumption since 1990.4 Fertilizer use dropped steeply in the 1990s and the first decade of the 2000s due to reforms in the EU’s Common Agricultural Policy. Consumption dropped by at least one-third, with some countries seeing over 40% reductions. That’s despite most countries having seen an increase or maintenance of crop yields over the same period.

China has also managed to turn the tide on fertilizer use. As you can see in the chart below, fertilizer consumption was growing rapidly from the 1960s to the early 2000s. But it peaked around 2015 and is now falling.
China has focused on using fertilizers more efficiently. To achieve this, it introduced various subsidy programs for farmers; not subsidies for fertilizers, but support programs for machinery and precision technologies; larger farms, which tend to use inputs more efficiently, and farmer training. The result has been a reduction in nutrient inputs while yields continued to increase. Various scientific papers expect that these policies and the reduction of subsidies played a pivotal role.5

In 2015, China also introduced a “zero-growth pesticide policy” to reduce the overconsumption of pesticides. Again — as you can see from the chart below — it has achieved its goal. What’s impressive is how quickly this happened: use fell immediately, and in less than five years, it has seen an impressive drop. Various monitoring programs across the country have already noticed a reduction in the concentration of pesticides in rivers.6

I’ve picked only a few examples, but other cross-country studies find that environmental policies and practices matter. Researchers David Wuepper, Fiona Tang, and Robert Finger find that a third of the differences in pesticide pollution risk between countries can be attributed to their agricultural policies.7
When looking at the number and stringency of policies, they find that more than 40% of the differences in soil erosion rates across country borders can be explained by differences in policies.2 Policies also explain many differences in forest loss and restoration rates.8
Agri-environmental policies do matter. They can make the difference between unsustainable versus efficient use of fertilizers and pesticides, cut rates of soil erosion, and transform countries from net losers to net gainers of forest.
On the other hand, poorly designed policies can backfire when they don’t consider trade-offs with other environmental or socioeconomic problems.
Agri-environmental policies can have spillover impacts to other countries
Earlier, we saw the damaging effects of Sri Lanka's abrupt ban on chemical fertilizers. That’s just one example of where policy design — or lack thereof — can go wrong.
Policies can have negative impacts in a few ways. First, they might not consider trade-offs with other environmental issues. As David Wuepper and colleagues note in their study on pesticide reductions, promoting organic farming does lower the risk of pesticide pollution but can also reduce crop yields.7 That means farmers must use more land or displace food production to other countries that might use even more pesticides.
That brings us to the second point: policies in one country can have negative impacts that spill over to others.
In a study published in Nature Communications, researchers looked at what would happen to greenhouse gas emissions from agriculture if England and Wales went fully organic.9 Domestic emissions would fall; in this regard, it would be a policy “win”. But there would also be a significant shortfall in food supplies, requiring the two countries to import more food from elsewhere. When these agricultural emissions are included, total emissions would increase. What appears to be a “win” when only considering England and Wales is, in fact, a “loss” for the world — and climate — as a whole.
You can imagine similar examples for measures such as land use or forestry. Countries could reduce their farmland area and increase their forest cover while driving more land use and forest loss in other countries. And it’s not just about environmental spillovers: poor policies can also impact food prices, access, and security. Researchers note, for example, that a rise in organic farming in rich countries could raise food prices for consumers in poorer ones.10
If national policies can have global consequences, policymakers need to look at global data
Environmental impacts are mostly offshored when there are large differences in policies across countries. The European Union or the United States can’t offshore deforestation to Brazil if the latter has a zero-deforestation mandate. The United Kingdom can’t displace water pollution to India if it has tight controls on fertilizer and pesticide runoff. If every country had strict environmental policies, it would be hard for any country to offshore its burden elsewhere. The problem is that — as we saw earlier — there are vast differences in the number and enforcement of policies between countries.
What can richer countries — with stricter domestic policies — do to prevent their impacts from “leaking” elsewhere?
First, they can’t force other countries to adopt the same policies. In some cases, they would cause a lot of harm. Restricting fertilizer and pesticide use for farmers who can only afford small amounts can ruin their harvests and livelihoods for very little environmental benefit.
What they can do is measure the full impact of their policies and account for any spillovers to other countries. Researchers already do this for carbon dioxide (CO2) emissions from fossil fuels: they estimate “consumption-based emissions” which adjust for the CO2 embedded in the goods and services they import. This tells us how much of their emissions are being offshored and whether they are reducing their emissions when this is considered.
This is harder for metrics such as deforestation, land use, fertilizer, or pesticide consumption, but many organizations are making progress. Trase Earth, for example, uses trade and geospatial data to map deforestation in the supply chains of products such as beef, palm oil, soy, and cocoa. Countries and companies can then see where their products are coming from and whether they’ve increased the risk of deforestation.
Some countries are starting to implement policies that tackle international impacts. In 2018, for example, France launched its National Strategy against Imported Deforestation, which commits it to ending the imports of unsustainable products by 2030. Next year, the EU will ban the sale of seven imported commodities — beef, soy, palm oil, wood, cocoa, coffee, and rubber — if grown on recently deforested land. Even then, the total impacts are not straightforward: this could reduce environmental pressures but negatively impact smallholder farmers in other countries if they lose some of their export markets.
Effective commitments – that provide support for farmers who need to adapt to new policies – will be crucial to ensure that countries are not only improving the environment at home, but also contributing to more sustainable practices for the world as a whole.
Acknowledgements
Many thanks to Max Roser, Edouard Mathieu and David Wuepper for their valuable feedback and comments on this article.
Endnotes
Samarakoon, L. P. (2024). What broke the pearl of the Indian ocean? The causes of the Sri Lankan economic crisis and its policy implications. Journal of Financial Stability.
Wuepper, D., Wiebecke, I., Meier, L., Vogelsanger, S., Bramato, S., Fürholz, A., & Finger, R. (2024). Agri-environmental policies from 1960 to 2022. Nature Food.
Policies implemented by the European Union are also included in national totals for EU countries.
Official governmental statistics — for example, in the UK — confirm the same reduction in fertilizer use.
Yang, Y., Li, Z., & Jin, M. (2022). How do chemical fertilizer reduction policies work?—Empirical evidence from rural China. Frontiers in Environmental Science.
Van Wesenbeeck, C. F. A., Keyzer, M. A., Van Veen, W. C. M., & Qiu, H. (2021). Can China's overuse of fertilizer be reduced without threatening food security and farm incomes?. Agricultural Systems.
Fan, P., Mishra, A. K., Feng, S., & Su, M. (2023). The effect of agricultural subsidies on chemical fertilizer use: Evidence from a new policy in China. Journal of Environmental Management, 344, 118423.
Guo, Z., Ouyang, W., Chen, M., Tulcan, R. X. S., Wang, L., Lin, C., & He, M. (2023). Increasing precipitation deteriorates the progress of pesticide reduction policy in the vulnerable watershed. In npj Clean Water.
Wuepper, D., Tang, F. H., & Finger, R. (2023). National leverage points to reduce global pesticide pollution. Global Environmental Change.
Wuepper, D., Crowther, T., Lauber, T., Routh, D., Le Clec'h, S., Garrett, R. D., & Börner, J. (2024). Public policies and global forest conservation: Empirical evidence from national borders. Global Environmental Change.
Smith, L. G., Kirk, G. J., Jones, P. J., & Williams, A. G. (2019). The greenhouse gas impacts of converting food production in England and Wales to organic methods. Nature Communications.
Mérel, P., Qin, Z., & Sexton, R. J. (2023). Policy-induced expansion of organic farmland: implications for food prices and welfare. European Review of Agricultural Economics.
Cite this work
Our articles and data visualizations rely on work from many different people and organizations. When citing this article, please also cite the underlying data sources. This article can be cited as:
Hannah Ritchie (2024) - “How effective are policies in reducing the environmental impacts of agriculture?” Published online at OurWorldinData.org. Retrieved from: 'https://archive.ourworldindata.org/20260202-181317/effective-policies-reducing-environmental-impacts-agriculture.html' [Online Resource] (archived on February 2, 2026).BibTeX citation
@article{owid-effective-policies-reducing-environmental-impacts-agriculture,
    author = {Hannah Ritchie},
    title = {How effective are policies in reducing the environmental impacts of agriculture?},
    journal = {Our World in Data},
    year = {2024},
    note = {https://archive.ourworldindata.org/20260202-181317/effective-policies-reducing-environmental-impacts-agriculture.html}
}
Reuse this work freely
All visualizations, data, and code produced by Our World in Data are completely open access under the Creative Commons BY license. You have the permission to use, distribute, and reproduce these in any medium, provided the source and authors are credited.
The data produced by third parties and made available by Our World in Data is subject to the license terms from the original third-party authors. We will always indicate the original source of the data in our documentation, so you should always check the license of any such third-party data before use and redistribution.
All of our charts can be embedded in any site.