Access to Energy
Access to electricity and clean cooking fuels are vital for a good standard of living and good health.
This page was first published in September 2019. We made minor changes to the text in January 2024.
Access to electricity
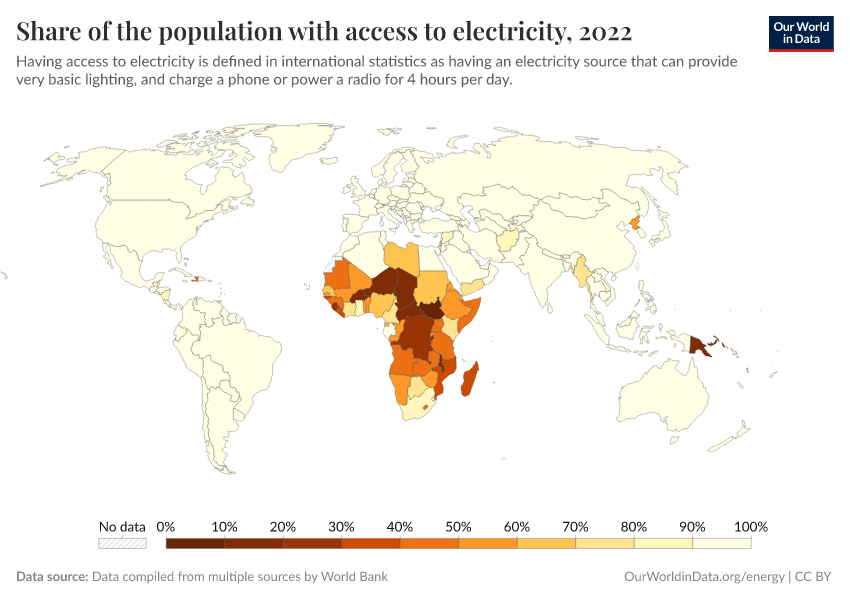
What share of people have access to electricity?
Electricity is crucial for poverty alleviation, economic growth, and improved living standards.1 Measuring the share of people with electricity access is, therefore, an important social and economic indicator. The concept of "access to electricity" doesn't have a universally accepted definition, but most interpretations revolve around the availability of electricity, safe cooking facilities, and a certain minimum level of consumption. According to the International Energy Agency (IEA), 'access to electricity' involves more than just electricity delivery to a household. It also includes a requirement for households to consume a certain minimum amount of electricity, which differs based on whether the household is in a rural or urban area, and this threshold increases over time. The minimum threshold is set lower for rural households and higher for urban households.2
At a global level, the share of people with access to electricity has been steadily increasing over the last few decades. In 2000, 2 in 10 people lacked access to electricity; this number has since decreased, with fewer than 1 in 10 lacking access in recent years.
Most of this increase has been driven by growth in low and middle-income economies. In many countries, this trend has been striking.
While this trend has been positive across most regions, there are still some countries where most of the people do not have access to electricity.
In the chart, you can explore electrification rates across the world.
How many people don't have access to electricity?
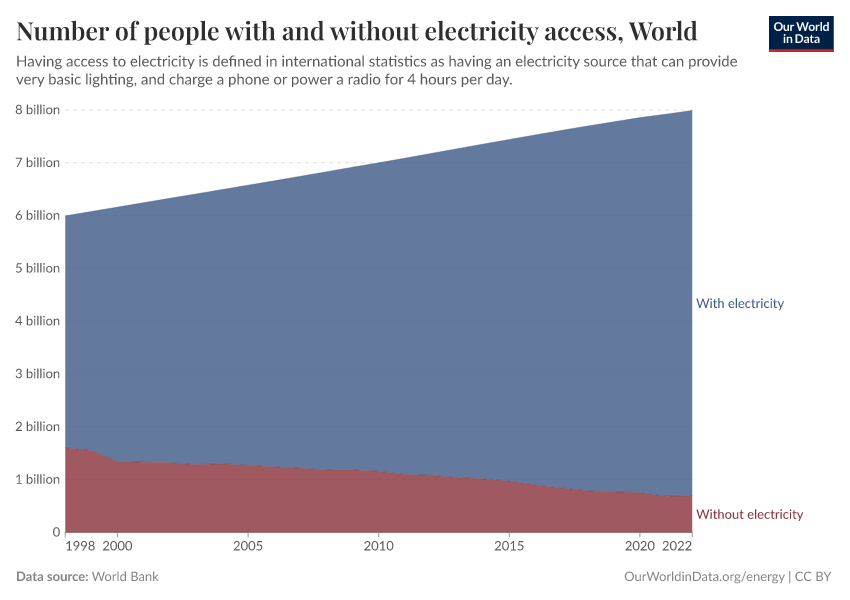
Global access to electricity has been steadily rising in recent decades.
This progress also holds when we look at the total number of people without electricity access. In 2015, the total number without electricity fell below one billion for the first time in decades, very likely the first time in our history of electricity production.3
The chart shows that in 1998, more than 1.5 billion people didn't have electricity; by 2015, this had fallen below one billion, and it has continued to fall since then.
If we calculate the number of people that have gained access to electricity on any average day since the millennium, it comes to around 334,000 people.
This figure is still unacceptably high, and gains in access are moving much too slowly to reach our goal of universal access by 2030. This is particularly true for Sub-Saharan Africa — despite the share of the population with electricity rising steadily, population growth meant that the total number of people without access was on the rise until 2016. Accelerated progress will be needed to ensure this number continues to fall.
The number of people without access to electricity by region and country
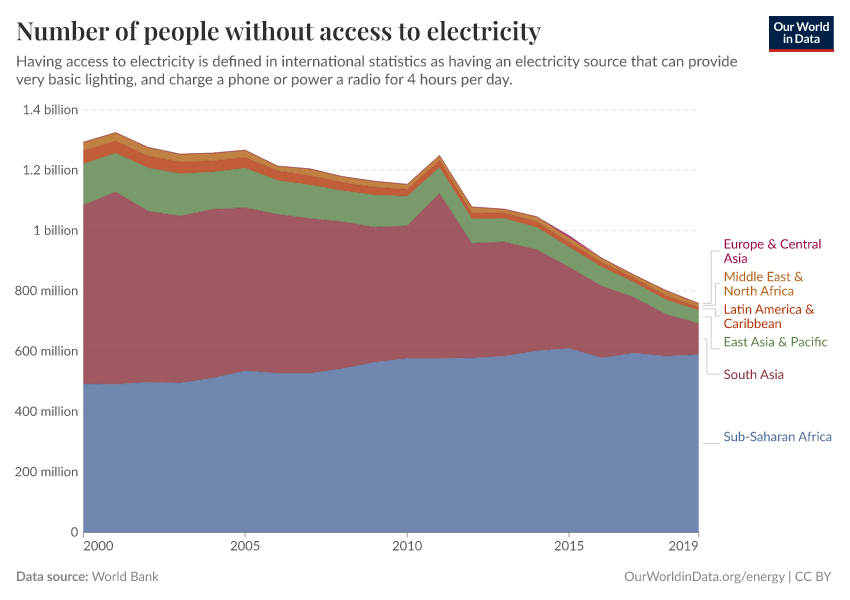
The chart shows the total number of people without access to electricity, grouped by world region.
We see a regional shift in electricity access over the past few decades: in 2000, nearly half of the world's people without access lived in South Asia. However, this figure has dramatically decreased in recent years. Taking its place is Sub-Saharan Africa, home to three-quarters of the world's population without access to electricity.

Access to clean fuels for cooking
What share of people have access to clean fuels for cooking?
Using solid fuels for cooking is a significant risk factor for deaths and morbidity from indoor air pollution.
The obvious way to avoid indoor air pollution from solid fuel burning is for households to transition from traditional ways of cooking and heating towards more modern, cleaner methods. This can, for example, involve transitioning to non-solid fuels such as natural gas, ethanol, or even electric technologies.
In 2020, approximately two-thirds of the world's population had access to clean fuels for cooking, representing a significant increase from about half of the global population in 2000. This improvement underscores the substantial progress over two decades in enhancing access to more sustainable and healthier cooking options worldwide.
The map shows the share of households with access to clean fuels and technologies for cooking across the world. This share has been increasing for most countries with low-to-middle incomes; however, rates of increase vary by country and region.
Access to clean fuels is still very low across Sub-Saharan Africa. Progress has been much more significant in South and East Asia over the last decade.

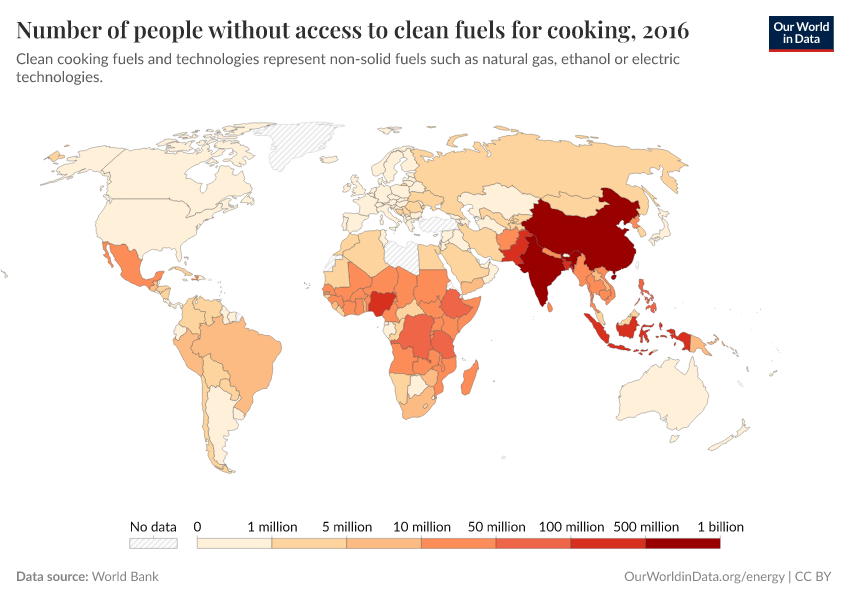
How many people do not have access to clean fuels for cooking?
In the visualizations here, we see the number of people globally with and without clean cooking fuels and a world map of the number without access.
The total number of people globally without clean cooking fuels has slowly declined since 2000.

What share of people use solid fuels for cooking?
The burning of solid fuels fills the houses and huts in poorer countries with smoke that kills the world’s poor by causing pneumonia, stroke, heart disease, chronic obstructive pulmonary disease, and lung cancer. The solid fuels responsible for this include wood, crop residues, dung, charcoal, and coal. The solution to this problem is straightforward: shift from solid fuels to modern energy sources.
And the following chart shows that the world is progressing in this direction. In 1980, nearly two-thirds of the global population relied on solid fuels. Three decades later, this proportion has decreased, with less than half of the world's population using solid fuels. The chart also shows that it is a problem associated with poverty. In wealthier Europe and North America, the share is much lower than in the rest of the world, and in high-income countries, the use of solid fuels is entirely a thing of the past.
The use of solid fuels is declining in all of the world’s regions. However, the success of rapidly developing Southeast Asia is particularly impressive. Here, there has been a remarkable decline in the use of solid fuels, shifting from nearly all of the population to just over half.

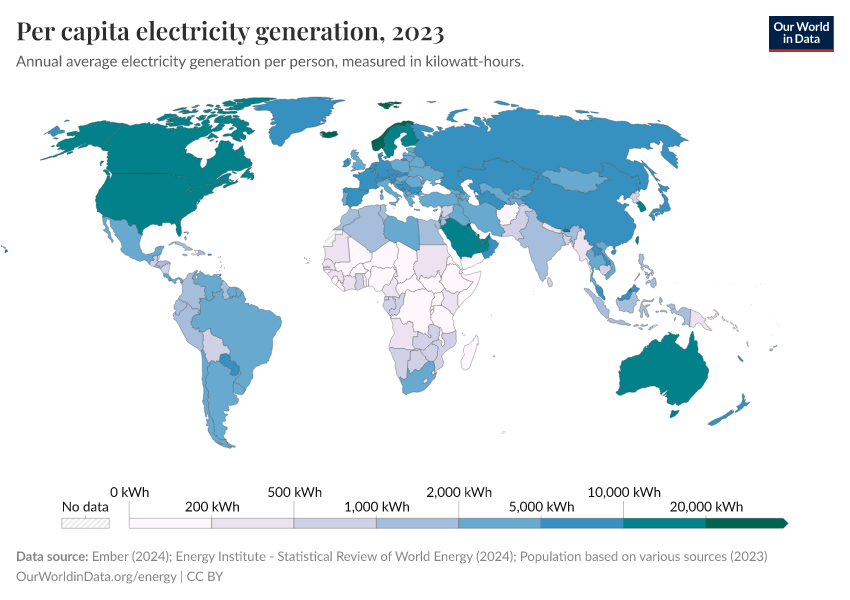
How does per capita electricity generation vary across the world?
While access to electricity is an important metric to monitor, it is insufficient to measure energy equity. Besides the fact that electricity is only one dimension of energy consumption, access metrics don’t tell us about the amount of electricity generated or used.
It doesn’t tell us much about electricity or energy affordability at the individual or household level. Indeed, many households may only consume the minimum threshold of electricity usage necessary to be considered 'electrified' due to personal finance constraints.4
The map shows the differences in average per capita electricity generation across the world.
What becomes clear is the significant inequalities that exist between countries. In many low-income countries, per capita electricity generation is more than 100-fold lower than in the wealthiest countries.
How does per capita energy consumption vary across the world?
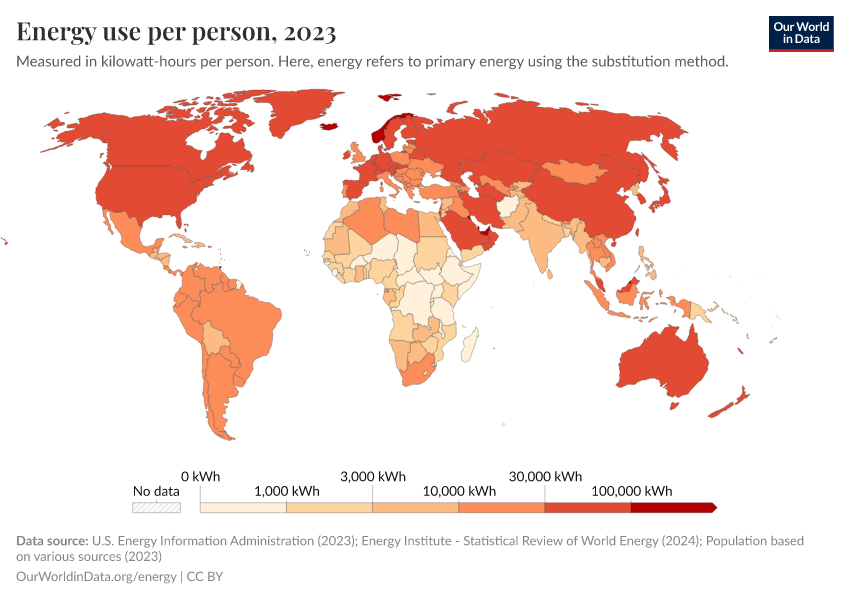
The map shows differences in per capita energy use, which includes all energy dimensions (electricity plus transport and heating). There are several important points to note.
Firstly, significant disparities in energy consumption exist between countries. For example, the average energy use in the United States surpasses that of the average Indian by more than tenfold, is four to five times greater than that of a Brazilian, and more than double that of a Chinese citizen. The contrast is even more pronounced when comparing high-income countries to very low-income nations, where the latter can consume over 30 times less energy.
Secondly, global average per capita energy consumption has been consistently increasing.
However, this growth in per capita energy consumption does vary significantly between countries and regions. Most of the growth over the last few decades has been driven by increased consumption in transitioning middle-income countries, such as China, India, and Brazil.
While global energy growth is growing from developing economies, the trend for many high-income nations is notably declining.
What determines levels of energy access?
Low-income households lack access to electricity and clean fuels
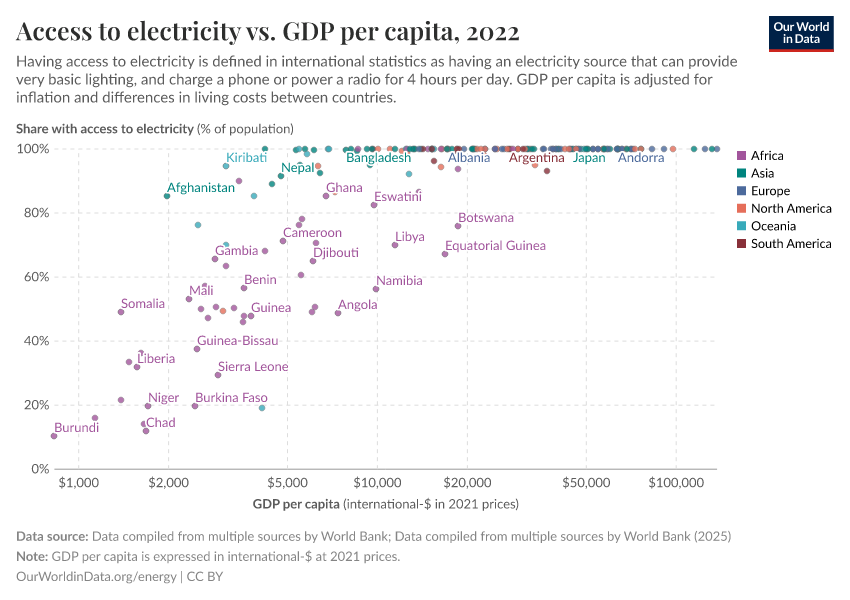
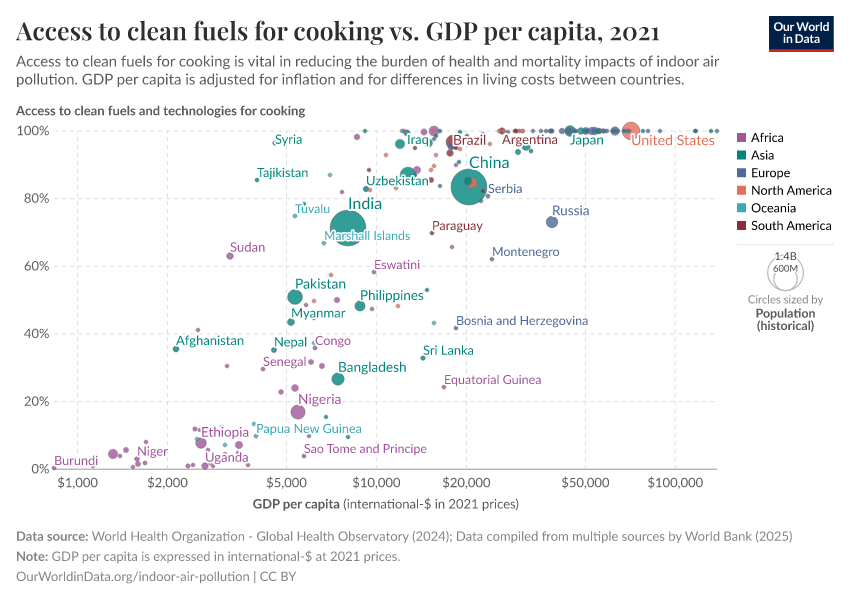
The availability (and affordability) of electricity and clean fuels for cooking is strongly related to income. Poor energy access is strongly tied to having a low income.
The scatterplots show the relationship between access to electricity and access to clean cooking fuels measured against average income (GDP per capita). Both metrics show a strong positive correlation: energy access is low in poorer countries and increases as incomes increase.
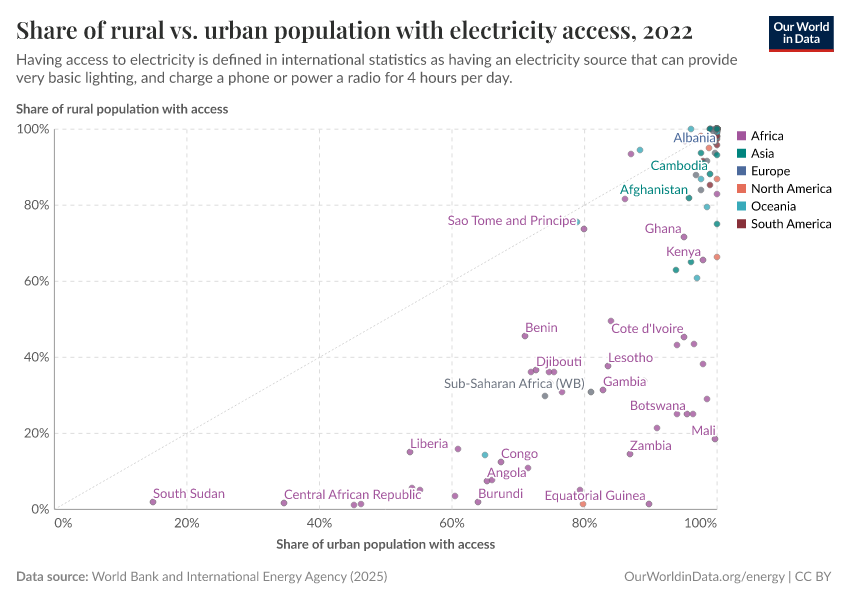
Rural households lag in energy access
Access to electricity has been increasing globally, with most of this increase coming from low-to-middle-income economies. However, access to electricity is not equally distributed between rural and urban demographics.
In the chart, we have plotted the percentage of the rural population with electricity access (on the y-axis) versus the percentage of the urban population with access (on the x-axis).
Countries below the grey line have lower access for rural populations than urban areas. Nearly all of these lines lie below this line, meaning that electricity access in urban areas is higher for most nations than in rural regions.
Endnotes
Panos, E., Densing, M., Volkart, K. (2016). Access to electricity in the World Energy Council's global energy scenarios: An outlook for developing regions until 2030. Energy Strategy Reviews, 9, 28-49. Available online.
IEA (2016). World Energy Outlook 2016 – Methodology for Energy Access Analysis. Available online.
Although global electricity access data does not extend back to 1990, I hypothesize that 2015 was the first year since the dawn of industrial electricity production that less than a billion have been without access. The global population was already over 1.4 billion by the time of the first power plant (1882). Asia (the world's most populous region) was approaching one billion at the end of the 19th century. The rapid development of the world's most populous regions has been focused on the most recent decades in the late 20th and early 21st century. Although the data is not available to confirm this, I would estimate that between 1882 and 1990, there have always been at least one billion people in the world without electricity access.
The minimum consumption levels necessary to be considered as having electricity access based on the International Energy Agency (IEA) methodology is 250kWh per year for rural households and 500kWh per year for urban households. IEA methodology and definitions are available online.
Cite this work
Our articles and data visualizations rely on work from many different people and organizations. When citing this topic page, please also cite the underlying data sources. This topic page can be cited as:
Hannah Ritchie, Pablo Rosado, and Max Roser (2019) - “Access to Energy” Published online at OurWorldinData.org. Retrieved from: 'https://ourworldindata.org/energy-access' [Online Resource]BibTeX citation
@article{owid-energy-access,
    author = {Hannah Ritchie and Pablo Rosado and Max Roser},
    title = {Access to Energy},
    journal = {Our World in Data},
    year = {2019},
    note = {https://ourworldindata.org/energy-access}
}
Reuse this work freely
All visualizations, data, and code produced by Our World in Data are completely open access under the Creative Commons BY license. You have the permission to use, distribute, and reproduce these in any medium, provided the source and authors are credited.
The data produced by third parties and made available by Our World in Data is subject to the license terms from the original third-party authors. We will always indicate the original source of the data in our documentation, so you should always check the license of any such third-party data before use and redistribution.
All of our charts can be embedded in any site.