Population Growth
Explore global and national data on population growth, demography, and how they are changing.
Population growth is one of the most important topics we cover on Our World in Data.
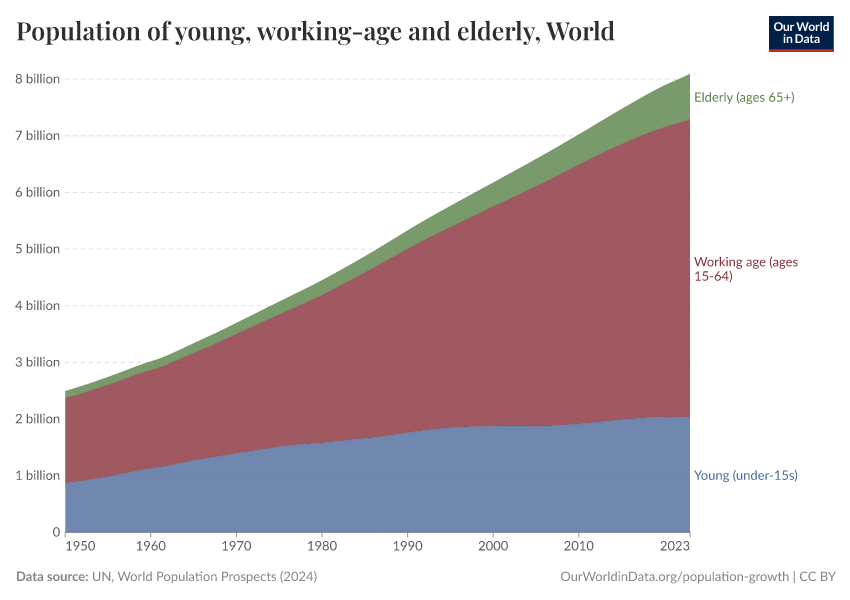
For most of human history, the global population was a tiny fraction of what it is today. Over the last few centuries, the human population has gone through an extraordinary change. In 1800, there were one billion people. Today there are more than 8 billion of us.
But after a period of very fast population growth, demographers expect the world population to peak by the end of this century.
On this page, you will find all of our data, charts, and writing on changes in population growth. This includes how populations are distributed worldwide, how this has changed, and what demographers expect for the future.
Key insights on Population Growth
Population cartograms show us where the world’s people are
Geographical maps show us where the world's landmasses are; not where people are. That means they don't always give us an accurate picture of how global living standards are changing.
One way to understand the distribution of people worldwide is to redraw the world map – not based on the area but according to population.
This is shown here as a population cartogram: a geographical presentation of the world where the size of countries is not drawn according to the distribution of land but by the distribution of people. It’s shown for the year 2018.
As the population size rather than the territory is shown in this map, you can see some significant differences when you compare it to the standard geographical map we’re most familiar with.
Small countries with a high population density increase in size in this cartogram relative to the world maps we are used to – look at Bangladesh, Taiwan, or the Netherlands. Large countries with a small population shrink in size – look for Canada, Mongolia, Australia, or Russia.
You can find more details on this cartogram in our article about it:
What you should know about this data
- This map is based on the United Nation’s 2017 World Population Prospects report. Our interactive charts show population data from the most recent UN revision. This means there may be minor differences between the figures shown on the map and the latest estimates in our other charts.
The world population has increased rapidly over the last few centuries
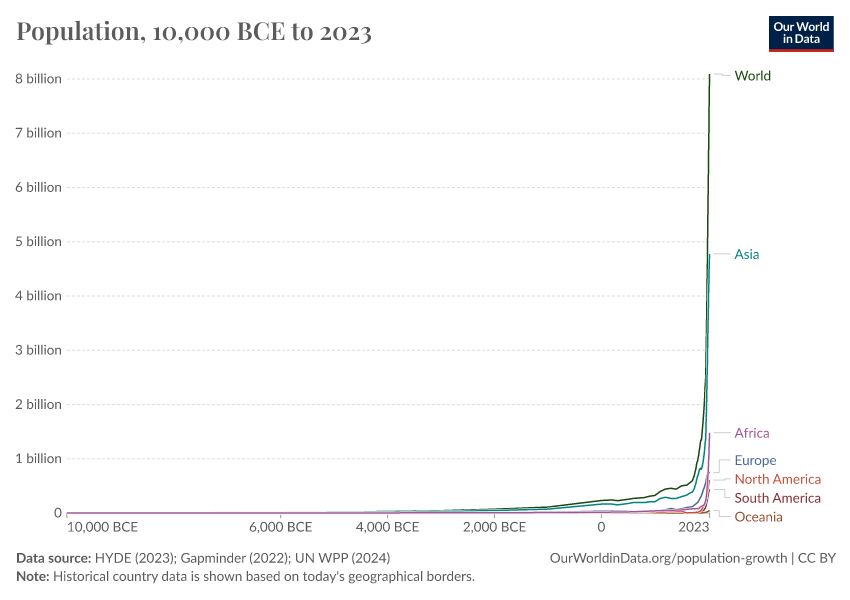
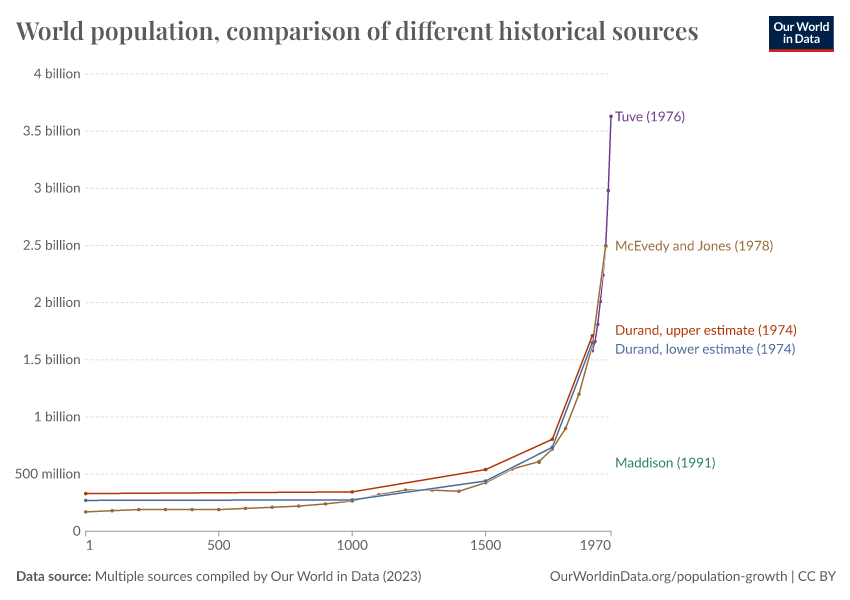
The speed of global population growth over the last few centuries has been staggering. For most of human history, the world population was well under one million.1
As recently as 12,000 years ago, there were only 4 million people worldwide.
The chart shows the rapid increase in the global population since 1700.
The one-billion mark wasn’t broken until the early 1800s. It was only a century ago that there were 2 billion people.
Since then, the global population has quadrupled to eight billion.
Around 108 billion people have ever lived on our planet. This means that today’s population size makes up 6.5% of the total number of people ever born.2
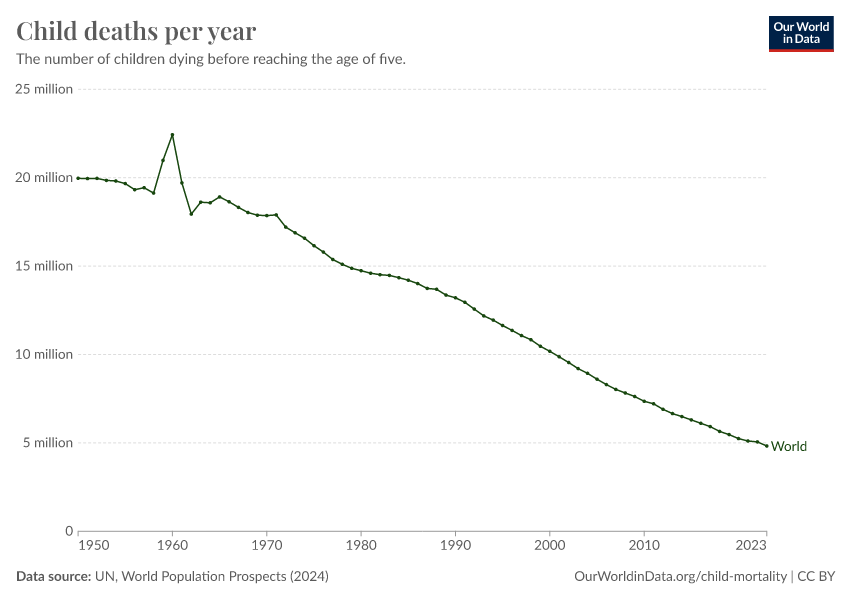
This increase has been the result of advances in living conditions and health that reduced death rates – especially in children – and increases in life expectancy.
What you should know about this data
- This data comes from a combination of sources, all detailed in our sources article for our long-term population dataset.
Population growth is no longer exponential – it peaked decades ago
There’s a popular misconception that the global population is growing exponentially. But it’s not.
While the global population is still increasing in absolute numbers, population growth peaked decades ago.
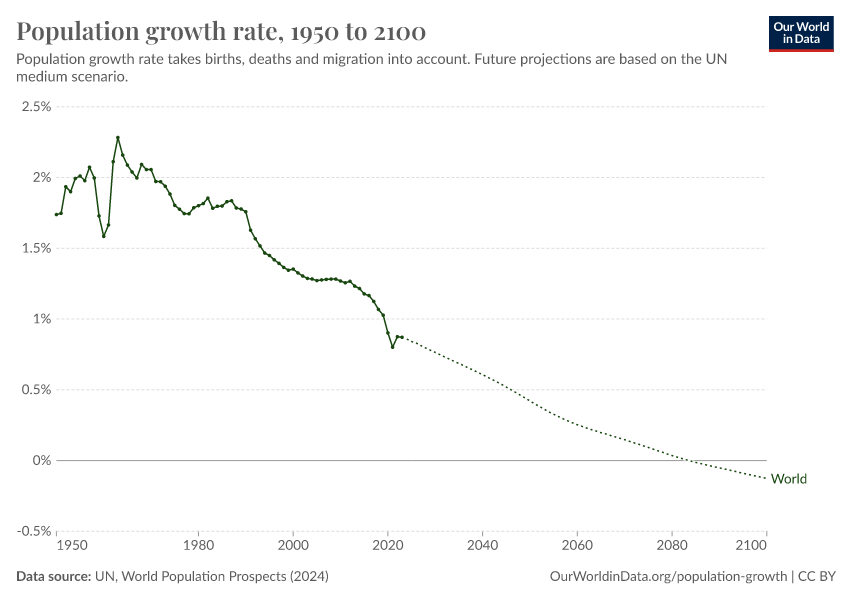
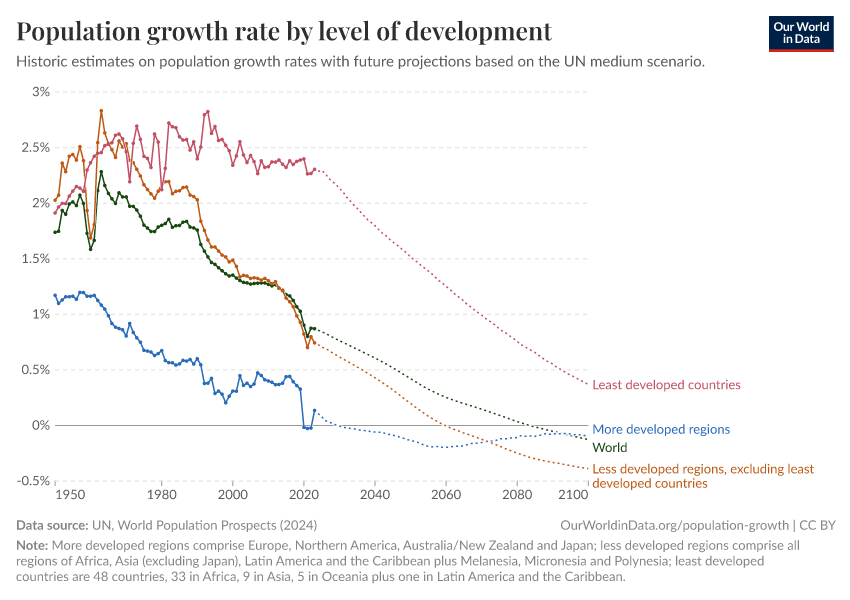
In the chart, we see the global population growth rate per year. This is based on historical UN estimates and its medium projection to 2100.
Global population growth peaked in the 1960s at over 2% per year. Since then, rates have more than halved, falling to less than 1%.
The UN expects rates to continue to fall until the end of the century. In fact, towards the end of the century, it projects negative growth, meaning the global population will shrink instead of grow.
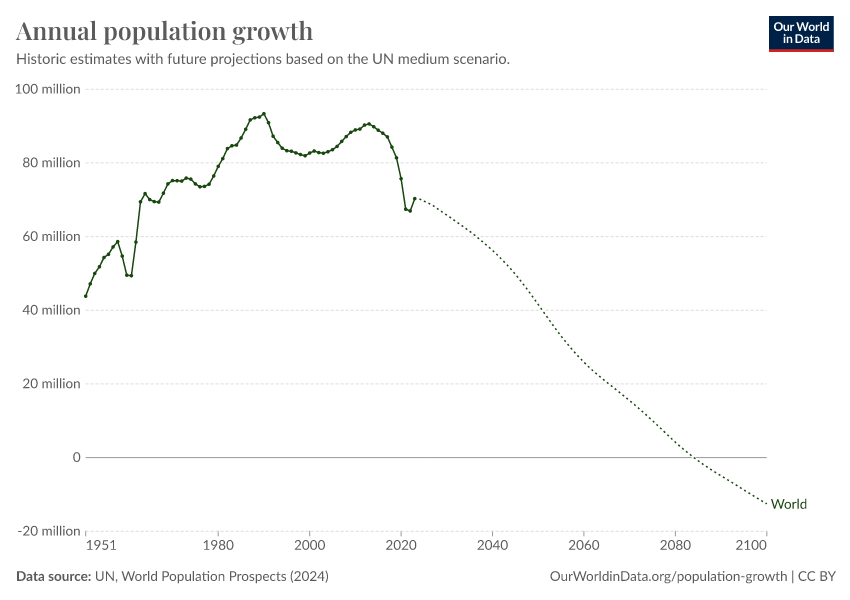
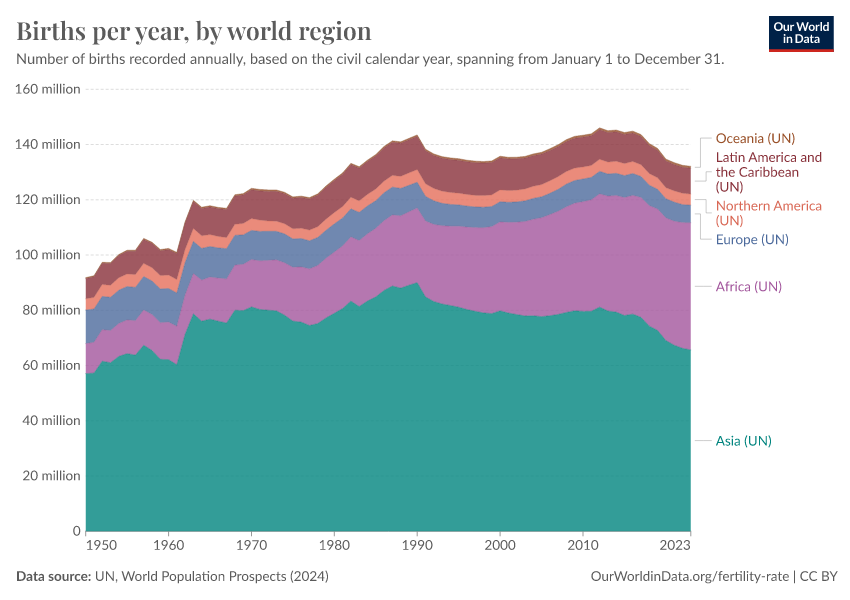
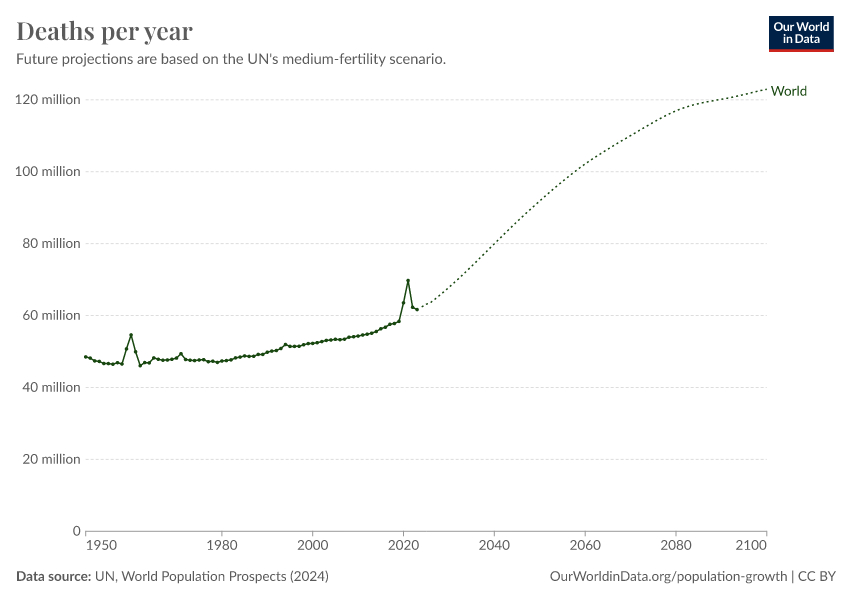
Global population growth, in absolute terms – which is the number of births minus the number of deaths – has also peaked. You can see this in our interactive chart:
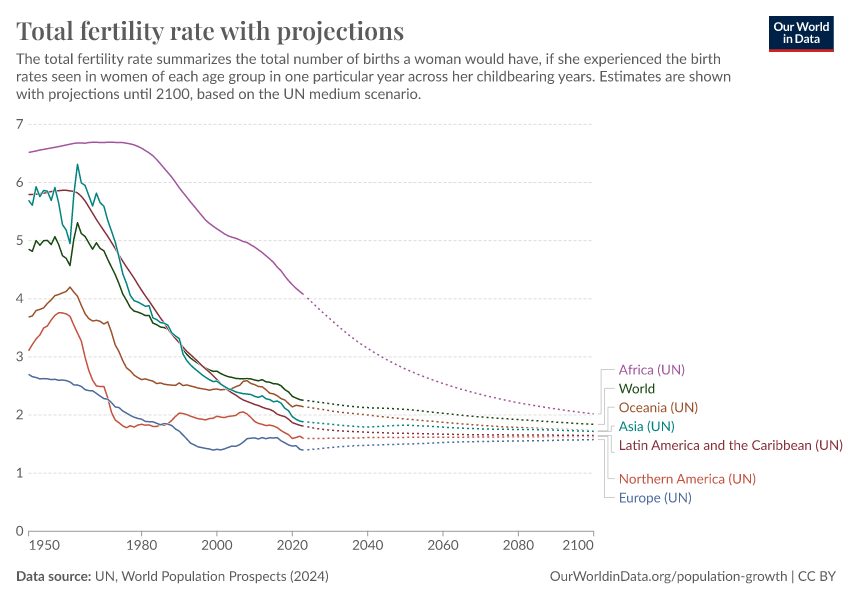
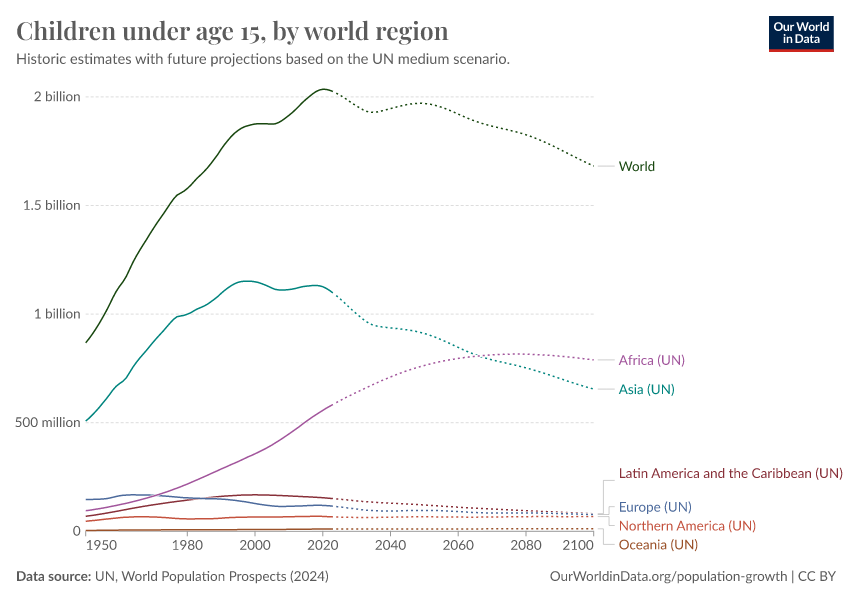
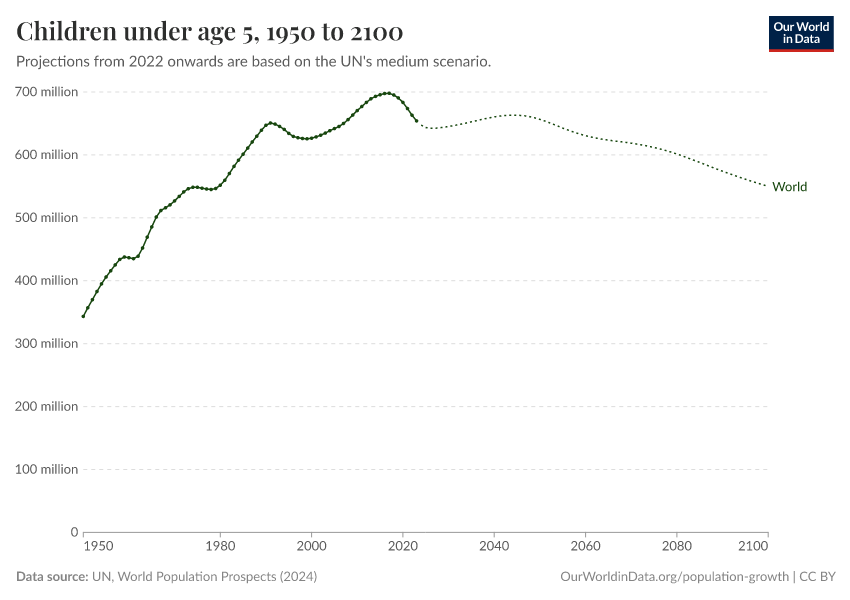
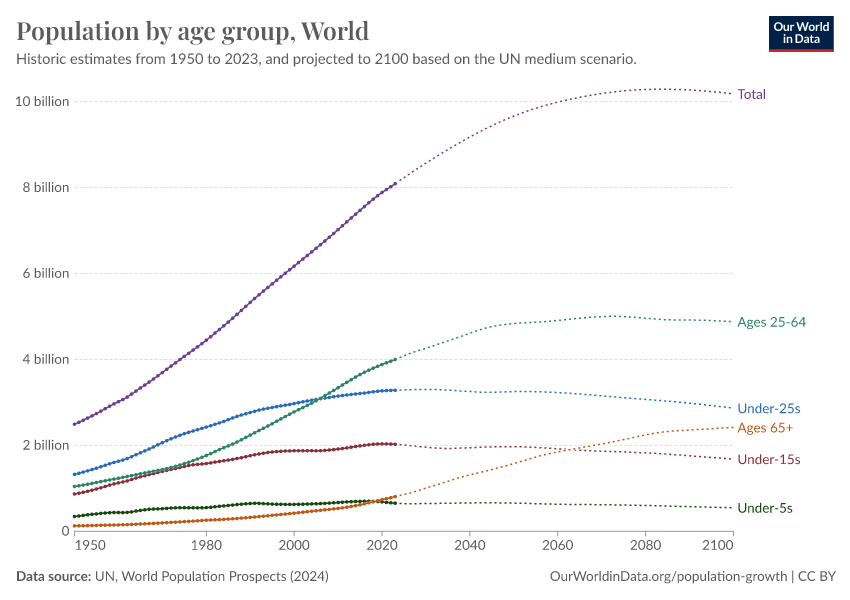
The world has passed "peak child"
Hans Rosling famously coined the term "peak child" for the moment in global demographic history when the number of children stopped increasing.
According to the UN data, the world has passed "peak child", which is defined as the number of children under the age of five.
The chart shows the UN’s historical estimates and projections of the number of children under five.
It estimates that the number of children in the world peaked in 2017. For the coming decades, demographers expect a decades-long plateau before the number will decline more rapidly in the second half of the century.
What you should know about this data
- These projections are sensitive to the assumptions made about future fertility rates worldwide. Find out more from the UN World Population Division.
- Other sources and scenarios in the UN’s projections suggest that the peak was reached slightly earlier or later. However, most indicate that the world is close to "peak child" and the number of children will not increase in the coming decades.
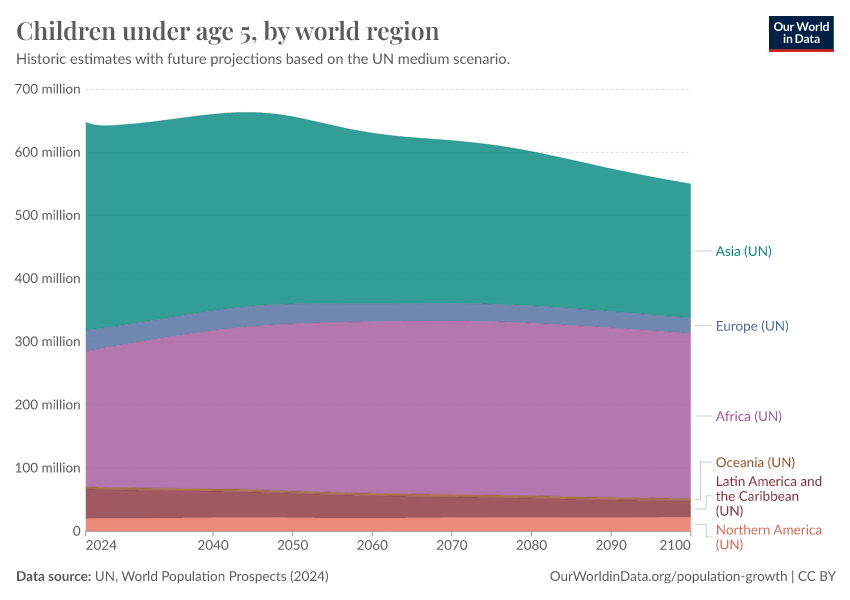
- The 'ups and downs' in this chart reflect generational effects and 'baby booms' when there are large cohorts of women of reproductive age, and high fertility rates. The timing of these transitions varies across the world.

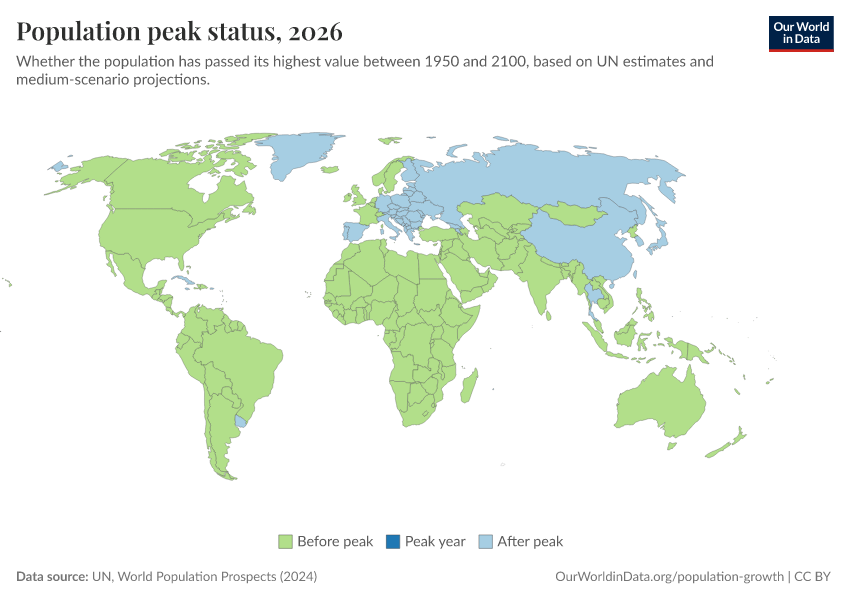
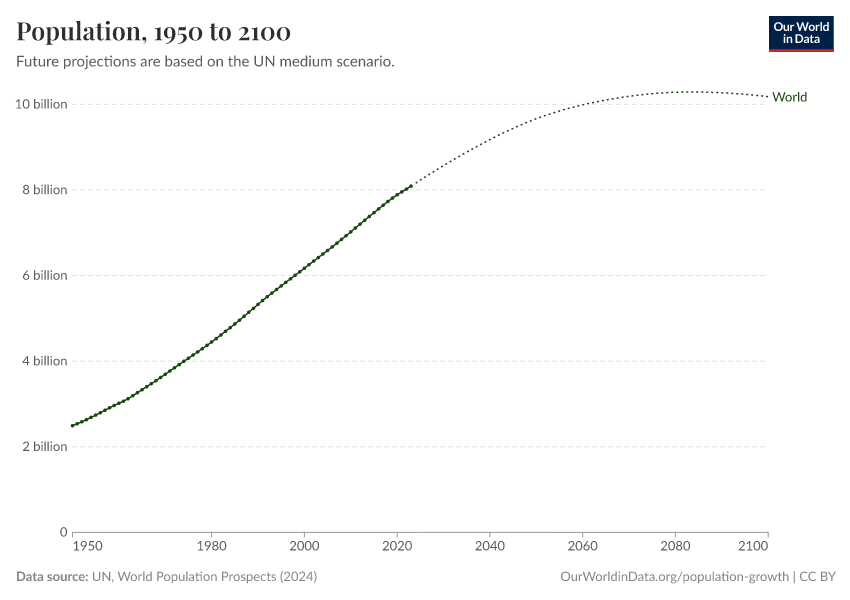
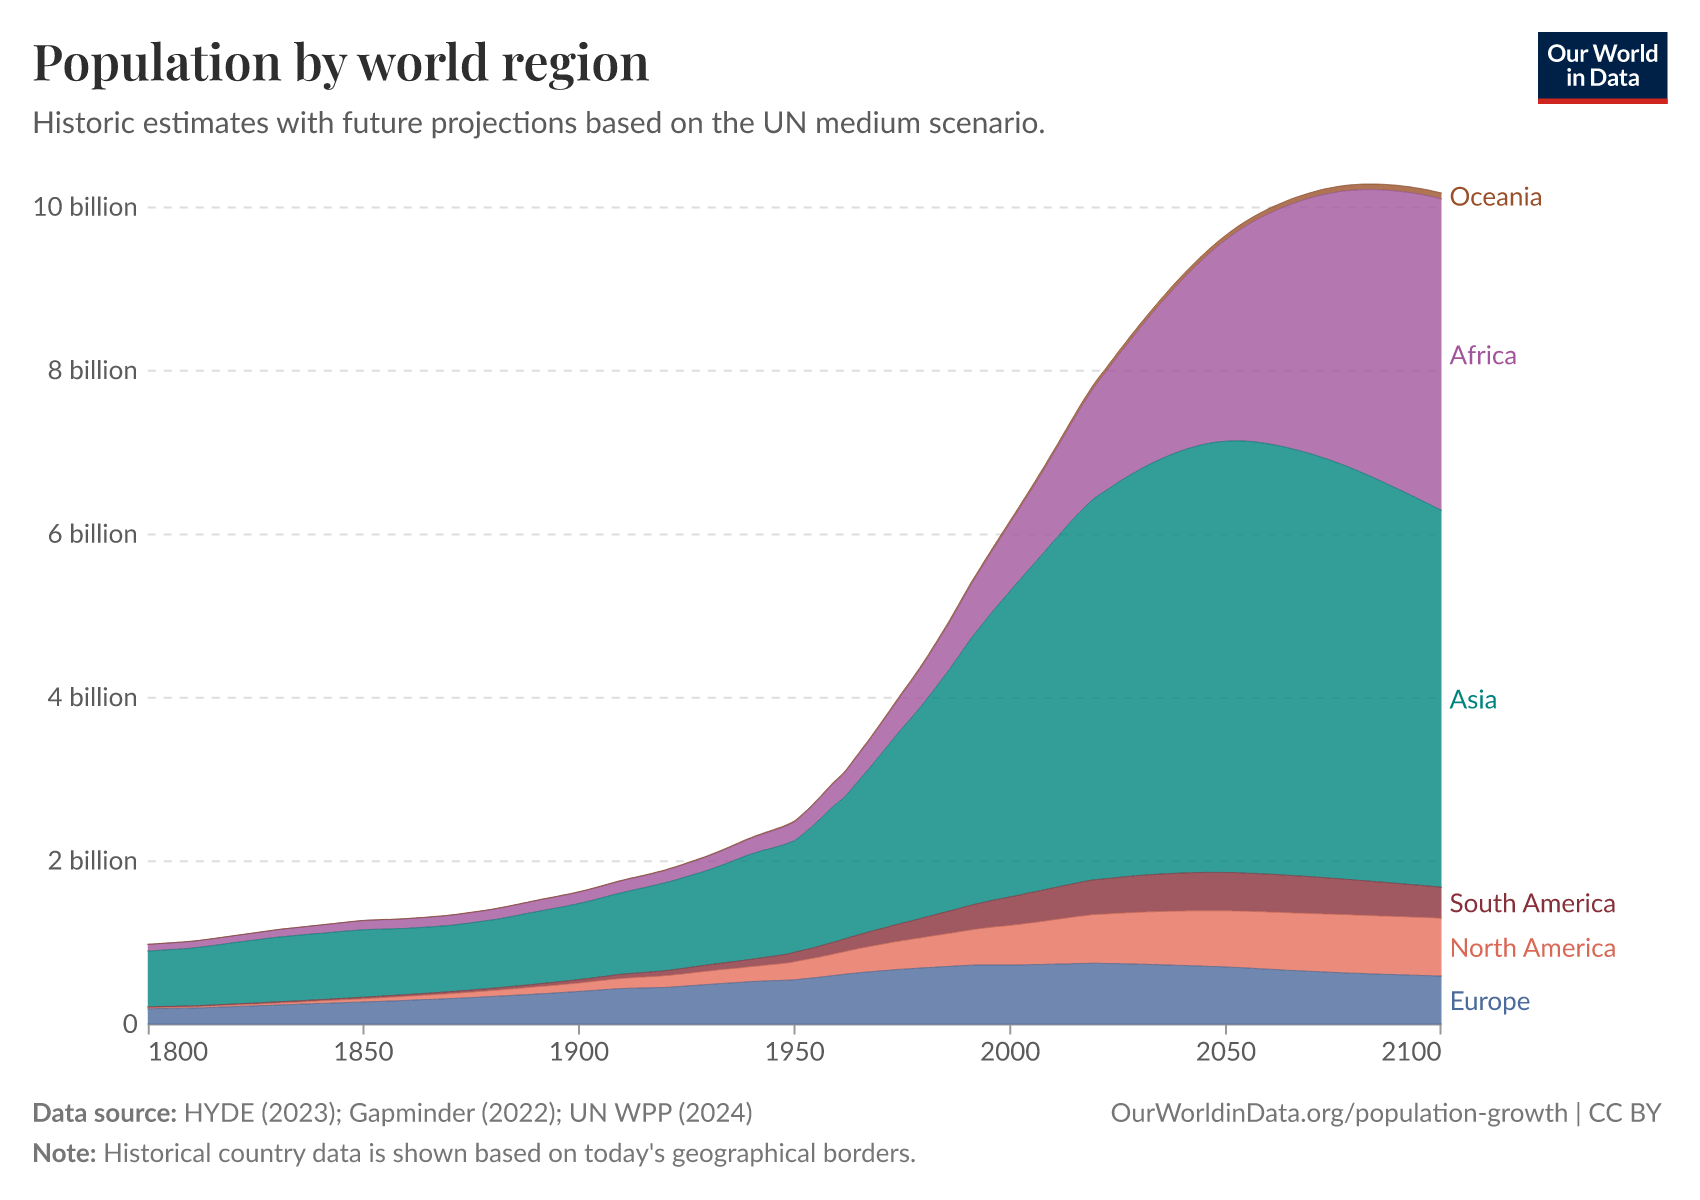
The UN expects the global population to peak by the end of the century
When will population growth come to an end?
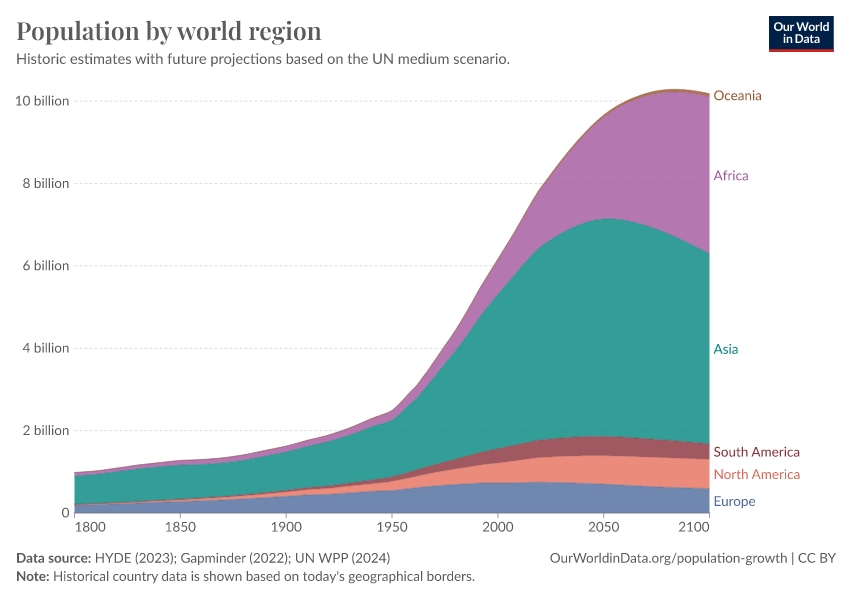
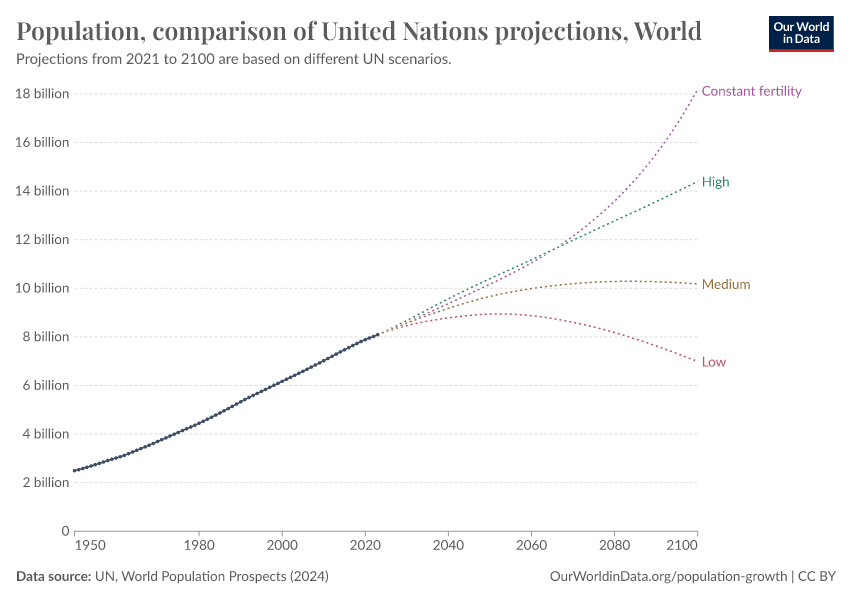
The UN’s historical estimates and latest projections for the global population are shown in the chart.
The UN projects that the global population will peak before the end of the century – in 2086, at just over 10.4 billion people.
What you should know about this data
- These projections are sensitive to the assumptions made about future fertility and mortality rates worldwide. Find out more from the UN World Population Division.
- Other sources and scenarios in the UN’s projections can produce a slightly earlier or later peak. Most demographers, however, expect that by the end of the century, the global population will have peaked or slowed so much that population growth will be small.

Research & Writing
September 12, 2018
The map we need if we want to think about how global living conditions are changing
What would the world look like if each country's area was in proportion to its population?
May 18, 2026
Population tool: How will populations across the world change in the 21st century?
We created an interactive tool that lets you test how changes in fertility rates, life expectancy, and migration rates will change future populations.
May 18, 2026
South Korea’s population is set to shrink: what would it take to stop the decline?
How much would fertility rates, life expectancy, or migration rates need to change to stop the population from shrinking?
Demographic change
June 1, 2023
How has world population growth changed over time?
March 18, 2023
Two centuries of rapid global population growth will come to an end
July 15, 2019
More than 8 out of 10 people in the world will live in Asia or Africa by 2100
January 15, 2019
India's population growth will come to an end: the number of children has already peaked
April 18, 2019
The global population pyramid: How global demography has changed and what we can expect for the 21st century
June 2, 2023
Population momentum: if the number of children per woman is falling, why is the population still increasing?
June 1, 2023
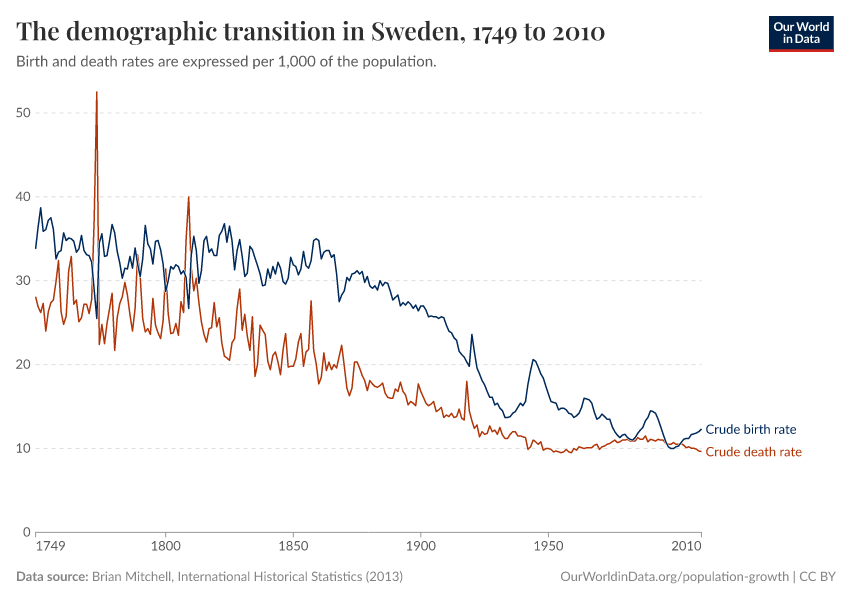
Demographic transition: Why is rapid population growth a temporary phenomenon?
Definitions and sources
February 8, 2022
What are the sources for Our World in Data's population estimates?
July 21, 2025
The Demographic and Health Surveys brought crucial data for more than 90 countries — without them, we risk darkness
June 20, 2023
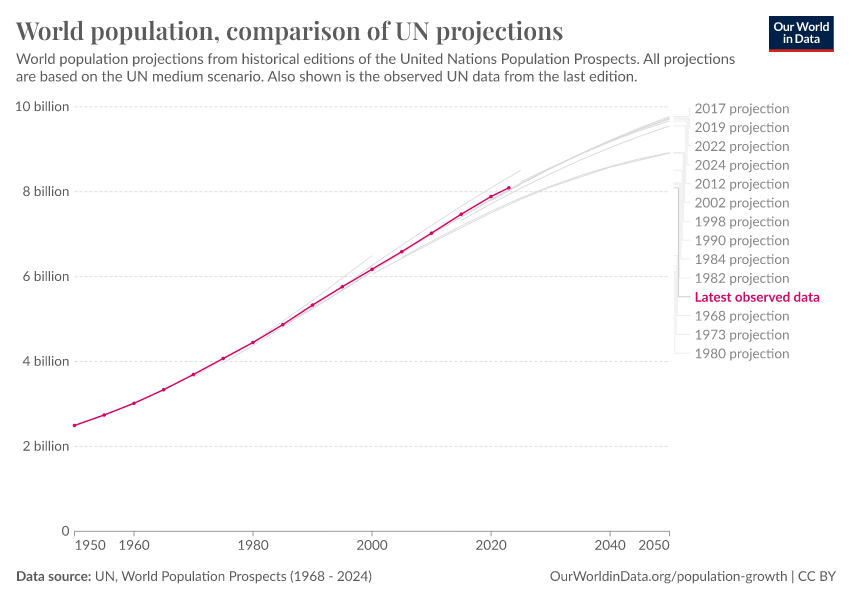
The UN has made population projections for more than 50 years – how accurate have they been?
Country Profiles
Explore the key metrics on population and demography for a country of your choice. How is the population size changing? What about key metrics such as fertility rate, life expectancy, and migration? And how might the population structure change in the future?


Key Charts on Population Growth
See all charts on this topic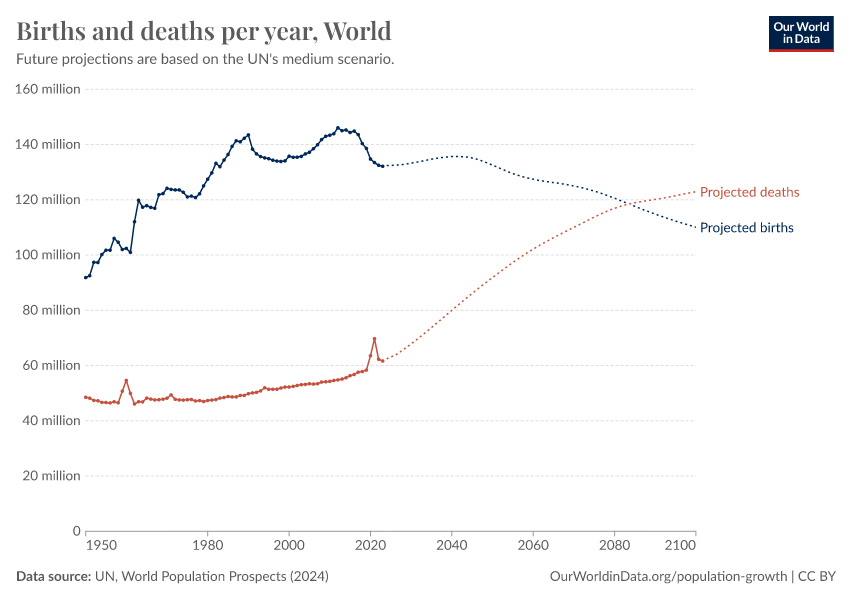


Featured Data on Population Growth
Endnotes
See, for example, Kremer (1993) – Population growth and technological change: one million BC to 1990. In the Quarterly Journal of Economics, Vol. 108, No. 3, 681-716.
As per 2011 estimates from Carl Haub (2011), “How Many People Have Ever Lived on Earth?” Population Reference Bureau.
Cite this work
Our articles and data visualizations rely on work from many different people and organizations. When citing this topic page, please also cite the underlying data sources. This topic page can be cited as:
Hannah Ritchie, Lucas Rodés-Guirao, Edouard Mathieu, Sophia Mersmann, Daniel Bachler, Saloni Dattani, Marcel Gerber, Esteban Ortiz-Ospina, Joe Hasell, and Max Roser (2023) - “Population Growth” Published online at OurWorldinData.org. Retrieved from: 'https://ourworldindata.org/population-growth' [Online Resource]BibTeX citation
@article{owid-population-growth,
    author = {Hannah Ritchie and Lucas Rodés-Guirao and Edouard Mathieu and Sophia Mersmann and Daniel Bachler and Saloni Dattani and Marcel Gerber and Esteban Ortiz-Ospina and Joe Hasell and Max Roser},
    title = {Population Growth},
    journal = {Our World in Data},
    year = {2023},
    note = {https://ourworldindata.org/population-growth}
}
Reuse this work freely
All visualizations, data, and articles produced by Our World in Data are completely open access under the Creative Commons BY license. You have the permission to use, distribute, and reproduce these in any medium, provided the source and authors are credited.
The data produced by third parties and made available by Our World in Data is subject to the license terms from the original third-party authors. We will always indicate the original source of the data in our documentation, so you should always check the license of any such third-party data before use and redistribution.
All of our charts can be embedded in any site.