
What you should know about this indicator
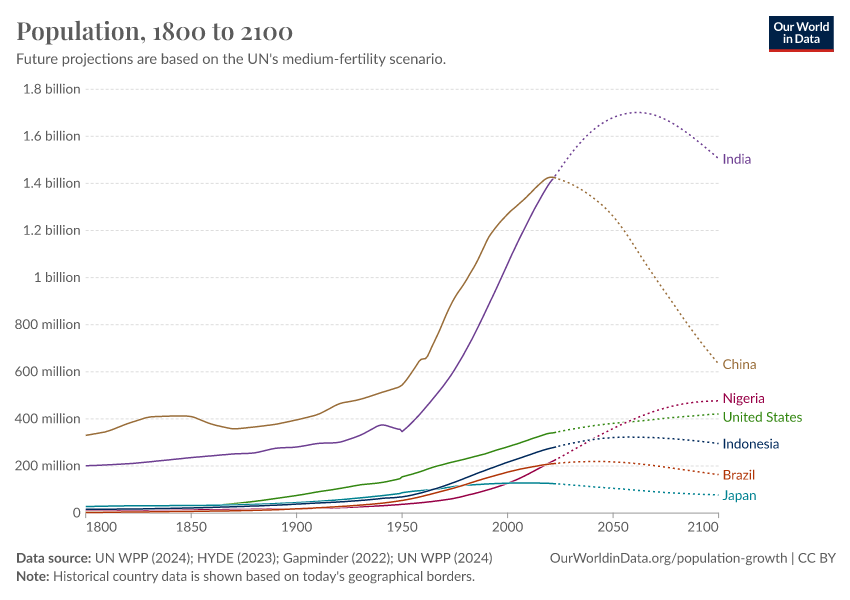
- Population is the most commonly used metric throughout Our World in Data. It is used directly to understand population growth over time, and indirectly to calculate per-capita indicators, making it easier to compare countries of different sizes.
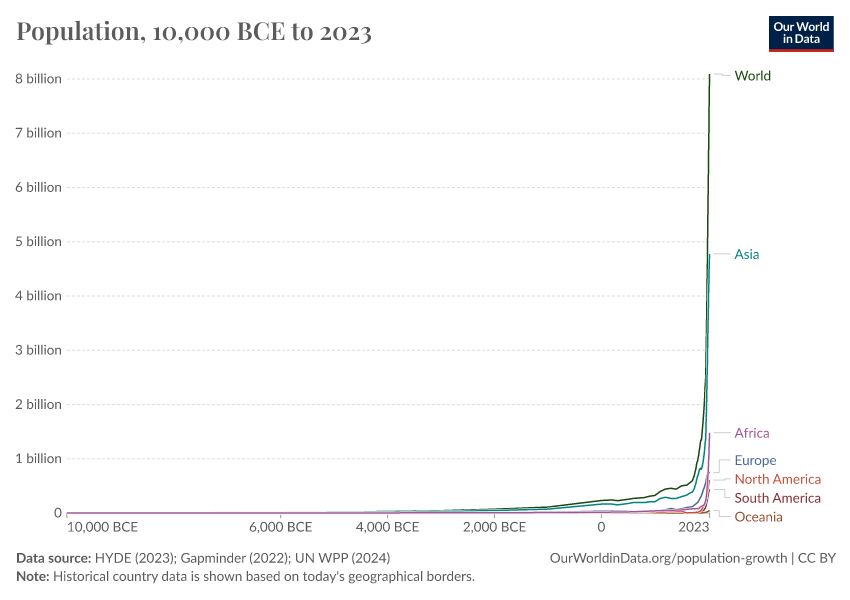
- We construct this indicator by combining multiple sources covering different periods.
- HYDE v3.3 (2023): historical estimates from 10,000 BCE to 1799.
- Gapminder v7 (2022): for 1800-1949.
- UN World Population Prospects (2024): for 1950 onwards, including 2100 projections.
- Gapminder Systema Globalis (2023): additional source for former countries (Yugoslavia, USSR, etc.)
- Breaks in the data may occur at the boundaries between sources due to their methodological differences.
- You can read more about the sources and methodology in our dedicated article. We also provide a table of sources showing the source we use for each country-year.
- We calculate geographical aggregates (continents, income groups, etc.) by summing individual country populations. For years before 1800, we rely directly on HYDE's values for continents to ensure historical consistency.
Related research and writing
Explore charts that include this data


More Data on Population Growth
Sources and processing
This data is based on the following sources
How we process data at Our World in Data
All data and visualizations on Our World in Data rely on data sourced from one or several original data providers. Preparing this original data involves several processing steps. Depending on the data, this can include standardizing country names and world region definitions, converting units, calculating derived indicators such as per capita measures, as well as adding or adapting metadata such as the name or the description given to an indicator.
At the link below you can find a detailed description of the structure of our data pipeline, including links to all the code used to prepare data across Our World in Data.
Notes on our processing step for this indicator
Combination of different sources
We construct our long-run population data by combining multiple sources:
-
10,000 BCE–1799: historical estimates by HYDE (v3.3).
-
1800–1949: historical estimates by Gapminder (v7).
-
1950–2023: population records from the United Nations World Population Prospects (2024 revision).
Geographical aggregates
- For most years, we calculate aggregates by summing the population of member countries.
- We do this based on our definition of continents and the World Bank’s income groups.
- The only exception is before 1800, where we use HYDE's estimates for continents (but not income groups).
For most of the years, we've estimated regional aggregates by summing the population of countries in each region. We've relied on our continents and World Bank income group definitions. The only exception is before 1800, where we've used HYDE's estimates on continents (but not income groups).
World
- Before 1800: we use data from HYDE.
- 1800-1950: we estimate the global population by summing all available countries in the dataset.
- After 1950, we rely on estimates from the United Nations World Population Prospects.
Reuse this work
Citations
How to cite this page
To cite this page overall, including any descriptions, FAQs or explanations of the data authored by Our World in Data, please use the following citation:
“Data Page: Population”, part of the following publication: Hannah Ritchie, Lucas Rodés-Guirao, Edouard Mathieu, Sophia Mersmann, Daniel Bachler, Saloni Dattani, Marcel Gerber, Esteban Ortiz-Ospina, Joe Hasell, and Max Roser (2023) - “Population Growth”. Data adapted from PBL Netherlands Environmental Assessment Agency, Gapminder, United Nations. Retrieved from https://archive.ourworldindata.org/20260727-181454/grapher/population-marimekko.html [online resource] (archived on July 27, 2026).How to cite this data
In-line citationIf you have limited space (e.g. in data visualizations), you can use this abbreviated in-line citation:
HYDE (2023); Gapminder (2022); UN WPP (2024) – with major processing by Our World in DataFull citation
HYDE (2023); Gapminder (2022); UN WPP (2024) – with major processing by Our World in Data. “Population – HYDE, Gapminder, UN – Long-run data” [dataset]. PBL Netherlands Environmental Assessment Agency, “History Database of the Global Environment 3.3”; Gapminder, “Population v7”; United Nations, “World Population Prospects”; United Nations, “World Population Prospects - Interim Update”; Gapminder, “Systema Globalis” [original data]. Retrieved July 28, 2026 from https://archive.ourworldindata.org/20260727-181454/grapher/population-marimekko.html (archived on July 27, 2026).Download
Quick download
Download the data shown in this chart as a ZIP file containing a CSV file, metadata in JSON format, and a README. The CSV file can be opened in Excel, Google Sheets, and other data analysis tools.
Data API
Use these URLs to programmatically access this chart's data and configure your requests with the options below. Our documentation provides more information on how to use the API, and you can find a few code examples below.
Data URL (CSV format)
https://ourworldindata.org/grapher/population-marimekko.csv?v=1&csvType=full&useColumnShortNames=falseMetadata URL (JSON format)
https://ourworldindata.org/grapher/population-marimekko.metadata.json?v=1&csvType=full&useColumnShortNames=falseExcel / Google Sheets
=IMPORTDATA("https://ourworldindata.org/grapher/population-marimekko.csv?v=1&csvType=full&useColumnShortNames=false")Python with Pandas
import pandas as pd
import requests

# Fetch the data.
df = pd.read_csv("https://ourworldindata.org/grapher/population-marimekko.csv?v=1&csvType=full&useColumnShortNames=false", storage_options = {'User-Agent': 'Our World In Data data fetch/1.0'})

# Fetch the metadata
metadata = requests.get("https://ourworldindata.org/grapher/population-marimekko.metadata.json?v=1&csvType=full&useColumnShortNames=false").json()
R
library(jsonlite)

# Fetch the data
df <- read.csv("https://ourworldindata.org/grapher/population-marimekko.csv?v=1&csvType=full&useColumnShortNames=false")

# Fetch the metadata
metadata <- fromJSON("https://ourworldindata.org/grapher/population-marimekko.metadata.json?v=1&csvType=full&useColumnShortNames=false")
Stata
import delimited "https://ourworldindata.org/grapher/population-marimekko.csv?v=1&csvType=full&useColumnShortNames=false", encoding("utf-8") clear