Interactive visualization requires JavaScript
Related research and data
Charts
- Average daily time spent by women on domestic work (paid and unpaid)
- Average usual weekly hours worked, women 15 years and older
- Criminal sanctions or compensation for workplace sexual harassment
- Employment discrimination based on gender prohibited
- Female employment vs. public spending on family benefits
- Female employment-to-population ratioNational estimates
- Female employment-to-population ratioModeled estimates
- Female employment-to-population ratio, 2023 vs. 1980
- Female labor force by age
- Female labor force participation rateILO
- Female labor force participation rate vs. GDP per capita
- Female labor force participation rate: 1980 vs. 2023
- Female labor force participation rates by family benefits public spending
- Female share of the labor force
- Female unemployment rateModeled estimates
- Female-to-male ratio of time devoted to unpaid care work
- Fertility rate versus female labor force participation rate
- Gender wage gap vs. GDP per capitaBy continent
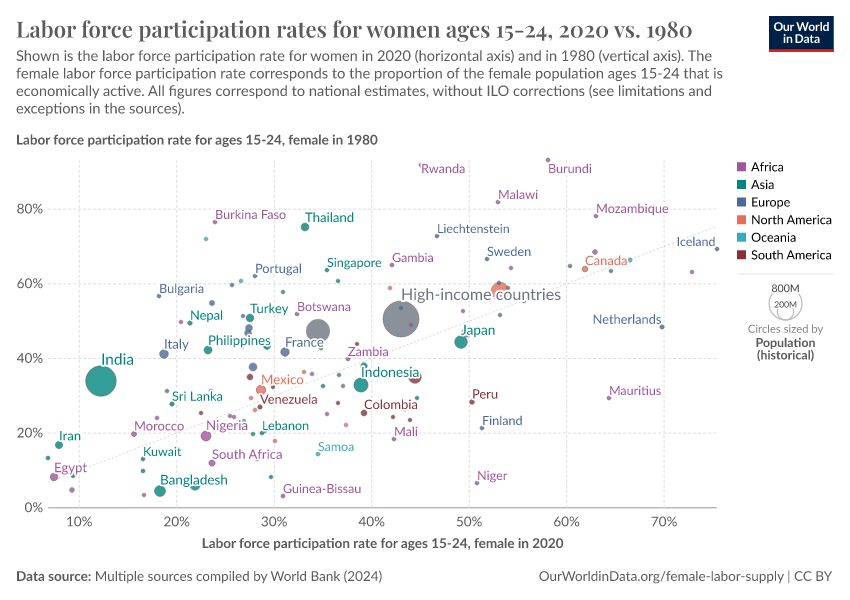
- Labor force participation, younger vs. older women
- Legislation on sexual harassment in employment
- Maternal mortality vs. female labor force participation, United States
- Proportion of women participating in the labor force
- Ratio of female to male labor force participation rates
- Share of day women spend on unpaid domestic and care work
- Share of employed women working in agriculture vs. GDP per capita
- Share of female employment by economic sector
- Share of female workers in informal employmentNational estimates
- Share of male vs. female employment in agriculture
- Share of male vs. female employment in industry
- Share of male vs. female employment in services
- Share of women in the workforceOECD & Long
- Share of workers in informal employment: male vs. female
- Share who agree with the statement 'when jobs are scarce, men should have more right to a job than women'
- Urban population vs. female labor force participation rate
- Weekly working hours
- What percentage of the US public approves of working wives?
- Women can take the same jobs as men