Interactive visualization requires JavaScript
Related research and data
Charts
- Average hourly earnings of male and female employees
- Borrowing to start or expand business, men vs. women
- Countries with gender-equal inheritance
- Employment-to-population ratio, men vs. women
- Equal rights to land ownership
- Female-to-male ratio of time devoted to unpaid care work
- Gender Inequality Index
- Gender wage gap
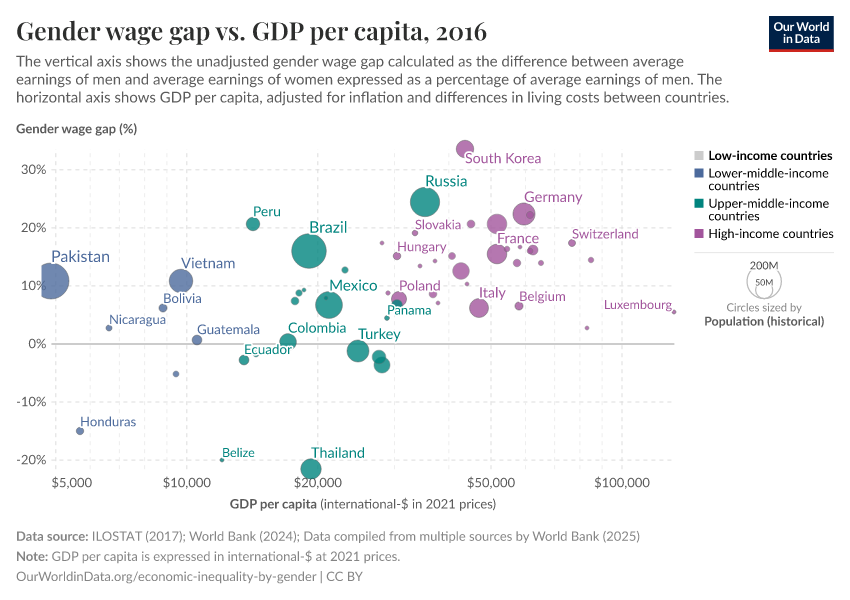
- Gender wage gap vs. GDP per capitaBy continent
- Gender wage gap vs. ratio of female-to-male labor force participation
- Gender wage gap: 2000 vs. 2025
- Historical Gender Equality Index
- Land ownership among men vs. women
- Legal frameworks addressing gender equality in employment and economic benefits
- Male-to-female ratio of high school courses in math and science
- Participation of women in major purchase decisions vs. GDP per capita
- Ratio of female-to-male median earnings by age, US
- Share of agricultural landowners who are women
- Share of agricultural population with land rights, by sex
- Share of firms with a female top manager
- Share of senior and middle management positions filled by women
- Share of women among low pay earners
- Share of women in low-wage occupations in the US
- Share of women in top income groups
- Systems tracking and making public allocations for gender equality and women's empowerment
- The gender wage ratio in different income percentiles
- The shrinking gender gap in high-level jobs and collective-bargaining coverage
- Time spent on unpaid care and domestic work by gender
- Time women and men spend on unpaid care and domestic work
- Unadjusted gender gap in median earnings
- Unadjusted gender wage gap including unemployed
- What percentage of the US public approves of working wives?
- Women and men have the same rights to own property
- Women can register a business on the same terms as men
- Women's Economic Opportunity Index