Gdoc/Admin

Popular pages

Research and data to make progress against the world’s largest problems.

13,209 charts across 120 topicsAll free: open access and open source

Our Mission

What do we need to know to make the world a better place?

To make progress against the pressing problems the world faces, we need to be informed by the best research and data.

Our World in Data makes this knowledge accessible and understandable, to empower those working to build a better world.

Read about our mission

We are a non-profit — all our work is free to use and open source. Consider supporting us if you find our work valuable.

Donate to support us
As seen on
Logos of the publications that have used our content. From left to right: Science, Nature, PNAS, BBC, Financial Times, The New York Times, The Guardian, The Atlantic, and The Washington Post

Daily Data Insights

Bite-sized insights on how the world is changing, published every weekday.

See all Daily Data Insights
A line chart showing the global average life expectancy from 1900 to 2023. The vertical axis represents life expectancy in years, ranging from 0 to 80, while the horizontal axis indicates the years from 1900 to 2023. While average life expectancy was 32.0 years in 1900, it was 73.2 years in 2023.

In 1770, the average life expectancy was only 28.5 years, depicted at the lower end of the graph. By 2023, it had risen to 73.2 years, noted at the upper portion. Key points on the graph highlight this change. 

Data sources cited include UN WPP (2024), HMD (2024), Zijdeman et al. (2015), and Riley (2005). The information can be further accessed at OurWorldinData.org/life-expectancy. The graph is labeled with the text "Global average life expectancy has more than doubled," emphasizing the significant increase over the centuries.

Global average life expectancy has more than doubled since 1900

We can expect to live more than twice as long as our ancestors in 1900.

As the chart shows, global average life expectancy was just 32 years at the beginning of the 20th century.

This was a short life by today’s standards: in 2023, the average life expectancy had increased to 73 years. That’s 41 years longer.

This remarkable increase is due to improved living standards, like better nutrition and sanitation, and advances in healthcare, such as antibiotics and vaccines.

While large declines in child mortality have been crucial, they have not been the only reason for the increase in life expectancy; it has increased across all ages.

Read more in our article “Twice as long – life expectancy around the world”

Continue reading
Bar chart showing the global lithium production by country in 2023. Australia leads with 48% of global production, followed by Chile at 24% and China at 18%. Argentina contributes 5.3%, Brazil 2.7%, Zimbabwe 1.9%, Canada 1.9%, and Portugal 0.21%. The chart highlights that Australia, China, and the "lithium triangle" (Chile, Argentina, and Bolivia) dominate lithium production.

The world’s lithium is mined in just a handful of countries

Lithium is a critical component in many industries, including pharmaceuticals, optics, ceramics, and glass. But it’s best known for its use in batteries. Most rechargeable batteries in mobile phones, laptops, and consumer electronics are made from lithium-ion chemistries.

It’s also receiving increasing attention as a critical mineral in batteries for electric cars and storage for renewable energy.

Just a handful of countries supply the world’s lithium. In the chart, you can see each country’s share of global mined production in 2023. Australia produced almost half. Combined with China, Chile, and Argentina, these four countries produced over 90% of the total.

Chile, Argentina, and Bolivia form the so-called “lithium triangle”, which are large lithium deposits that span across these three countries. While Bolivia has huge lithium resources, it has produced very little so far.

This data comes from the United States Geological Survey.

Explore which countries produce other critical minerals in our data explorer →

Continue reading
A line chart that shows the global increase in 4G network coverage from 2015 to 2023. The x-axis represents years (2015 and 2023), while the y-axis shows coverage percentages. In 2015, North America had the highest coverage at 99%, followed by Europe (76%), Latin America (58%), and Asia (40%). Sub-Saharan Africa had the lowest at 11%. By 2023, North America and Europe reached 99%, Asia increased to 94%, Latin America to 91%, and Sub-Saharan Africa to 63%. Globally, coverage rose from 44% in 2015 to 90% in 2023, indicating that nearly 9-in-10 people worldwide are now within range of a 4G network. A note clarifies that network coverage does not imply usage.

Nine in ten people in the world were in the range of a 4G network in 2023

Internet access has grown rapidly over the last few decades. It lets us connect with people across countries and continents, helps students learn and apply for jobs, and is even the primary mode of banking in some parts of the world.

But having access to fast internet also matters. This is also changing quickly.

In 2015, less than half — 44% — of the world population was in the range of a 4G network. That figure is now 90%. In the chart, you can see that this has increased quickly across many regions. This data comes from the International Telecommunication Union.

Note that being in the range of a 4G network doesn’t mean that someone is using it. If people don’t have a mobile, computer, or service to connect, they might be in the range of a network but not online.

Explore more charts on technological change across the world →

Continue reading
A world map visualizes the percentage of seats held by women in the lower or single chamber of parliaments for the year 2023. The map features various shades of blue, indicating different levels of female representation. Areas with no data are shown in white, while light yellow represents regions with more women than men in parliament. Countries highlighted specifically include Nicaragua, Cuba, and Rwanda, which are noted for having more women than men in their legislative bodies. The darker blue shades signify regions where men hold the majority of seats, with categories for "far more men" (over 75% male representation), "more men," "equal" representation, and "more women." The footer includes data sources credited to V-Dem (2024) and Our World in Data, labeled with a Creative Commons BY license.

Three countries had more women than men in parliament in 2023

Women’s representation in national politics has increased dramatically in the last century.

But men still hold more parliamentary seats in almost every country. There are three exceptions: Cuba, Nicaragua, and Rwanda.

You can see this in the map. Most countries are in blue, meaning they have a higher share of men; in many countries, they make up more than 75% of the seats (shown in darker blue).

Look closely enough, and you can see the three countries in red that have more women.

This data comes from V-Dem and is based on parliamentary seats in 2023.

Explore how the share of women in parliament has changed in other countries →

Continue reading
This chart titled "The most popular meats vary a lot across countries" shows the percentage of different types of meat consumption across five countries: Argentina, the United States, Japan, Germany, and Ethiopia. The meats are categorized as poultry, beef, sheep and goat, pork, other meats, and fish/seafood. For example, Argentina primarily consumes beef and poultry (both 40%), while Ethiopia consumes a significant portion of beef (45%) and sheep/goat meat (28%). Japan has high consumption of fish/seafood (44%), while Germany's diet is pork-heavy (48%). The chart uses color bars to represent each meat type with a clear legend at the top.

Meat preferences vary a lot across different countries

America’s most popular type of meat is chicken. In Argentina, chicken is tied with beef. And in Japan, it’s fish and seafood.

There are large differences in the popularity of meat types across the world.

In the chart above, you can see the share of supply that comes from different types of meat: poultry, beef, pork, goat, and seafood. I’ve picked just a selection of countries that highlight some of the variation across the world.

Of course, countries also eat very different amounts of meat; this chart focuses on the relative amounts in national diets.

This data comes from the Food and Agriculture Organization of the United Nations.

Explore the most popular types of meat in your country in the global dataset →

Continue reading
The image shows a series of six line graphs depicting the trends in global emissions of different pollutants from 1750 to 2022. The title reads "The world has passed 'peak pollution'," indicating that emissions of several pollutants have declined since their peak levels, except for ammonia.

The pollutants shown are:

- Sulphur dioxide (SO₂) – peaked in the mid-20th century and has since declined.
- Nitrogen oxide (NOx) – followed a similar pattern, peaking around the late 20th century and then dropping.
- Carbon monoxide (CO) – peaked mid-20th century and declined.
- Black carbon (BC) – shows a rise until recently, followed by a drop.
- Organic carbon (OC) – has risen steadily with a recent plateau.
- Ammonia (NH₃) – continues to rise without a recent decline.

The world has probably passed “peak air pollution”

Global emissions of local air pollutants have probably passed their peak.

The chart shows estimates of global emissions of pollutants such as sulphur dioxide (which causes acid rain), nitrogen oxides, and black and organic carbon.

These pollutants are harmful to human health and can also damage ecosystems.

It looks like emissions have peaked for almost all of these pollutants. Global air pollution is now falling, and we can save many lives by accelerating this decline.

The exception is ammonia, which is mainly produced by agriculture. Its emissions are still rising.

These estimates come from the Community Emissions Data System (CEDS).

Air pollution has not peaked everywhere in the world — explore the data for your country →

Continue reading
The visualization illustrates the distribution of international migrants based on the distance between their countries of origin and destination as of 2020. A horizontal axis represents the distance in kilometers, ranging from 0 to over 10,000. The vertical axis shows the share of all emigrants as a percentage.

There are data points indicating that the majority of international migrants come from neighboring countries, which are highlighted as the most common destinations. The largest share falls within the 0 to 500 kilometers distance range, with decreasing percentages as the distance increases. 

The source of the data is listed at the bottom, citing UN DESA (2020) and Natural Earth (2024). Additionally, there is a note explaining that the distances represent the shortest geographical distances between the borders of the origin and destination countries.

The most frequent international migration journeys are between neighboring countries

One way to understand how far international migrants move is to measure the shortest distance between the borders of their origin and destination countries.

The chart above shows these distances for all international migrant populations worldwide. It includes the total number of people living outside their home country rather than yearly migration flows.

Most migration journeys are short, with neighboring countries (shown as “0 km” on the chart) the most common destinations. Nearly half of all migrants — about 47% — move less than 500 kilometers, roughly the distance from the Netherlands to Switzerland. The median distance between origin and destination countries is just under 600 kilometers.

24% of migrants travel over 3,000 kilometers, about the distance from Ukraine to Portugal. Only a small fraction — less than 4% — move more than 10,000 kilometers, roughly equivalent to a journey from Madagascar to the United Kingdom.

Read our full article on how far migrants travel from their home countries

Continue reading

Get Daily Data Insights delivered to your inbox

Receive an email from us when we publish a Daily Data Insight (every weekday).

By subscribing you are agreeing to the terms of our privacy policy.

Explore our data

Featured data from our collection of 13,209 interactive charts.

See all our data

What share of children die before their fifth birthday?

What could be more tragic than the death of a young child? Child mortality, the death of children under the age of five, is still extremely common in our world today.

The historical data makes clear that it doesn’t have to be this way: it is possible for societies to protect their children and reduce child mortality to very low rates. For child mortality to reach low levels, many things have to go right at the same time: good healthcare, good nutrition, clean water and sanitation, maternal health, and high living standards. We can, therefore, think of child mortality as a proxy indicator of a country’s living conditions.

The chart shows our long-run data on child mortality, which allows you to see how child mortality has changed in countries around the world.

Explore and learn more about this data

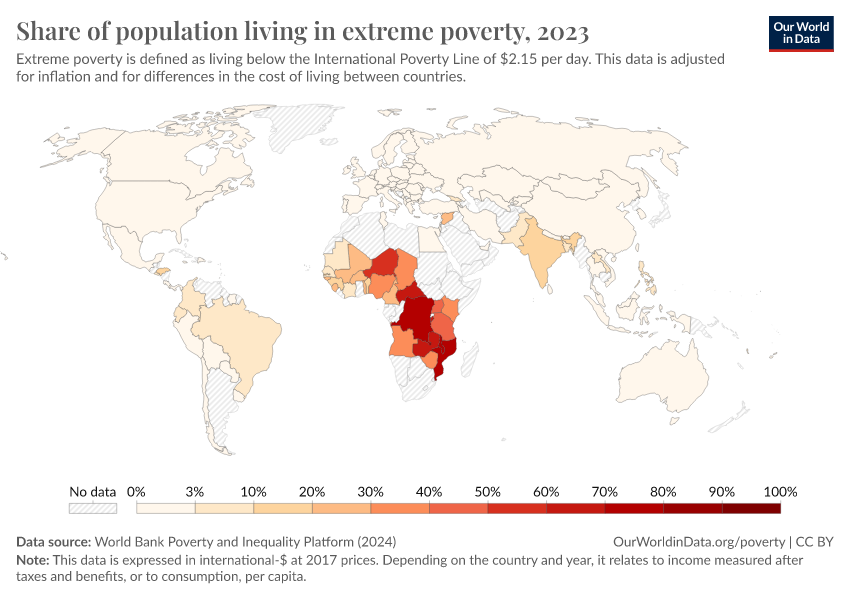
Share of population living in extreme povertyWorld Bank

Life expectancy at birthLong-run estimates collated from multiple sources by Our World in Data

Per capita CO₂ emissionsLong-run estimates from the Global Carbon Budget

GDP per capitaLong-run estimates from the Maddison Project Database

Share of people that are undernourishedFAO

Literacy rateLong-run estimates collated from multiple sources by Our World in Data

Share of the population with access to electricityWorld Bank

Data explorers

See all our Data Explorers

Interactive visualization tools to explore a wide range of related indicators.

Subscribe to our newsletters

Receive our latest work by email.
By subscribing you are agreeing to the terms of our privacy policy.

All our topics

All our data, research, and writing — topic by topic.

Population and Demographic Change

Health

Energy and Environment

Food and Agriculture

Poverty and Economic Development

Education and Knowledge

Innovation and Technological Change

Living Conditions, Community, and Wellbeing

Human Rights and Democracy

Violence and War