Gdoc/Admin

Popular pages

Research and data to make progress against the world’s largest problems.

12,821 charts across 118 topicsAll free: open access and open source

Our Mission

What do we need to know to make the world a better place?

To make progress against the pressing problems the world faces, we need to be informed by the best research and data.

Our World in Data makes this knowledge accessible and understandable, to empower those working to build a better world.

Read about our mission

We are a non-profit — all our work is free to use and open source. Consider supporting us if you find our work valuable.

Donate to support us
As seen on
Logos of the publications that have used our content. From left to right: Science, Nature, PNAS, BBC, Financial Times, The New York Times, The Guardian, The Atlantic, and The Washington Post

Daily Data Insights

Bite-sized insights on how the world is changing, published every weekday.

See all Daily Data Insights
Rail travel is more popular in Japan than in Europe, and vastly more common than in the United States

Rail travel is more prevalent in Japan than in Western Europe, and much more than in the United States

The chart shows how much people rely on rail versus road transport in 2021. The data comes from the OECD, and we recently updated our charts with the latest release.

Japan stands out with 28% of passenger kilometers traveled by rail. This contrasts sharply with New Zealand and the United States, where rail accounts for only 1.4% and 0.25% of passenger kilometers, respectively.

In Western European countries, rail transport is still in the minority, but less so. In France, 10% of passenger kilometers are traveled by rail, 6.4% in Germany, and 5% in the United Kingdom.

Countries with well-developed rail networks and high usage also tend to have lower domestic transport-related CO2 emissions.

Explore passenger kilometers traveled by road and rail in other countries →

Continue reading

Vaccines have reduced infant mortality by 40% over the last 50 years

Infant mortality rates have plummeted over the last 50 years. Globally, they’ve fallen by over two-thirds, from around 10% in 1974 to less than 3% today.

A recent study — published in The Lancet by Andrew Shattock and an international team of researchers — estimates that increased access to crucial vaccines has reduced infant mortality by 40%.

The chart shows the actual reduction in infant mortality rates with vaccination (in blue) and the researchers’ estimates for a hypothetical scenario in which vaccines wouldn’t have been rolled out (in red).

Based on these figures, vaccines are estimated to have saved 150 million children over the last 50 years.

Read our article on the role of vaccination in reducing infant mortality

Continue reading
Line chart titled 'Annual working hours per worker' depicting the decline in average annual working hours from 1870 to 2017 for seven countries: United States, Australia, United Kingdom, Sweden, Belgium, France, and Germany. All countries show a substantial downward trend in annual working hours. Data sources are Huberman & Minns (2007) and PWT 9.1 (2019).

Working hours in wealthy countries have been reduced by half over the last 150 years

The chart shows that the average worker in wealthy countries now works only about half as many hours per year as in the late 19th century.

Based on data from economic historians Michael Huberman and Chris Minns, the average worker used to work between 2,700 and 3,500 hours per year, which is about 50 to 70 hours each week.

Recently, using data from the Penn World Table, workers worked about half that amount, between 1,300 and 1,800 hours a year, or about 25 to 35 hours a week.

This decrease has come from working fewer hours each day, fewer days each week, and fewer weeks each year.

Read more in our article on whether we are working more than ever →

Continue reading
The chart titled "Global HIV/AIDS deaths averted by antiretroviral therapy" shows the annual number of deaths from HIV/AIDS and the estimated number of deaths averted by antiretroviral therapy (ART) from 1990 to 2022. The chart features a stacked area plot with two key data areas: deaths due to HIV/AIDS in red and deaths averted due to ART in blue. The total number of deaths rose steadily from 1990, peaking around 2004 at around 2 million per year. Following this peak, deaths began to decline, with a significant portion being averted by ART, as shown by the expanding blue area. By 2022, deaths had reduced to around 600,000, while deaths averted by ART were substantial. Data source: UNAIDS (2023).

HIV antiretroviral therapy saves over a million lives each year

Four decades ago, when HIV was first identified, it was an invariably fatal disease: nearly 100% of those infected died, typically within a few years.

The virus spread rapidly around the world — especially in Africa, where almost two million were dying every year by the millennium.

Thankfully, medical advances and global public health efforts have entirely changed this course. Modern antiretroviral therapy is very effective in both treating HIV — returning people with HIV to near-normal life expectancy — and preventing the virus from spreading to others.

The chart above shows this impact based on data from UNAIDS. Over a million people's lives are now saved by antiretroviral therapy each year.

Recent medical advances could take this progress even further.

Read more on how antiretroviral therapy has changed the lives of people with HIV

Continue reading
Scatterplot showing the share of calories from staples vs. GDP per capita. People in poorer countries get a higher share of energy from these crops.

People in poorer countries get more of their calories from staple crops

Cereals, roots, and tuber crops — such as cassava or potatoes — are some of the cheapest options for getting enough calories. In poorer countries, people get much of their daily energy from these crops.

The chart shows the share of calories that the average person gets from these staples, measured against gross domestic product (GDP) per capita. This data comes from the Food and Agriculture Organization of the United Nations and the World Bank.

People in some of the world’s poorest countries get two-thirds to three-quarters of their calories from cereals and other staples, compared to around one-third in the richest countries.

This means those on low incomes have less diverse diets and often miss out on key nutrients from legumes, fruit and vegetables, meat and dairy, and other foods.

Explore the data

Continue reading
Investment in generative AI has surged recently

Investment in generative AI has surged recently

Generative AI is a type of artificial intelligence that can create various media, including text, images, and music. It learns from existing data to generate novel outputs. Examples include language models like GPT-4 and Claude, which can write essays or answer questions, and image generation models like Midjourney and DALL·E, which can create artwork based on textual descriptions.

In 2023, funding for generative AI soared to $22.4 billion, nearly nine times more than in 2022 and about 25 times the amount from 2019. This surge occurred despite overall investment in AI declining since its 2021 peak.

The data is produced by Quid and made available through the AI Index Report. Quid analyzes investment data from over 8 million companies, using natural language processing to uncover patterns and insights from vast datasets. We have recently updated our charts on Our World in Data with the report's latest edition.

Read more on how investment in AI has been changing over time here →

Continue reading
Bar chart titled 'Homelessness by gender, 2023' showing the percentage of people affected by homelessness by gender across various countries. The chart shows data for women in red and men in blue. The data indicates that homelessness rates are higher for men in most countries. Data source: OECD (2024).

Men are more likely to be homeless in most countries, but there are exceptions

This chart shows the gender breakdown of people affected by homelessness.

In most countries, men tend to be more likely to experience homelessness than women. In many, women make up 20% to 40% of the homeless population.

But this ratio varies a lot by country. In Colombia and Costa Rica, men are much more likely to be affected by homelessness, with only around one in ten being women.

In the United Kingdom and New Zealand, it’s even the opposite: more women experience homelessness than men.

This data comes from the OECD’s Affordable Housing Database and only includes countries that count people experiencing homelessness on a single night of the year.

Explore our updated and expanded topic page on homelessness

Continue reading

Get Daily Data Insights delivered to your inbox

Receive an email from us when we publish a Daily Data Insight (every weekday).

By subscribing you are agreeing to the terms of our privacy policy.

Explore our data

Featured data from our collection of more than 12,800 interactive charts.

See all our data

What share of children die before their fifth birthday?

What could be more tragic than the death of a young child? Child mortality, the death of children under the age of five, is still extremely common in our world today.

The historical data makes clear that it doesn’t have to be this way: it is possible for societies to protect their children and reduce child mortality to very low rates. For child mortality to reach low levels, many things have to go right at the same time: good healthcare, good nutrition, clean water and sanitation, maternal health, and high living standards. We can, therefore, think of child mortality as a proxy indicator of a country’s living conditions.

The chart shows our long-run data on child mortality, which allows you to see how child mortality has changed in countries around the world.

Explore and learn more about this data

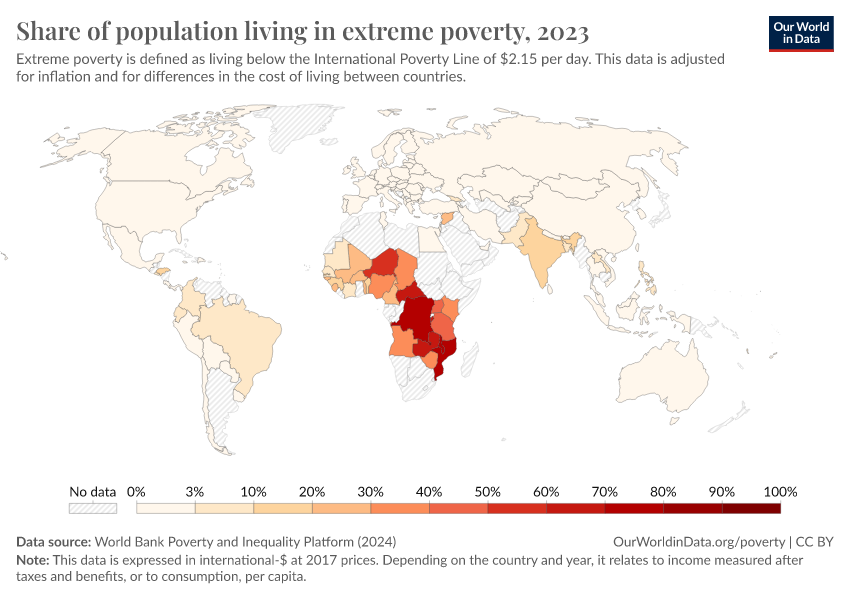
Share of population living in extreme povertyWorld Bank

Life expectancy at birthLong-run estimates collated from multiple sources by Our World in Data

Per capita CO₂ emissionsLong-run estimates from the Global Carbon Budget

GDP per capitaLong-run estimates from the Maddison Project Database

Share of people that are undernourishedFAO

Literacy rateLong-run estimates collated from multiple sources by Our World in Data

Share of the population with access to electricityWorld Bank

Data explorers

See all our Data Explorers

Interactive visualization tools to explore a wide range of related indicators.

Subscribe to our newsletter

Receive our latest work by email.
By subscribing you are agreeing to the terms of our privacy policy.

All our topics

All our data, research, and writing — topic by topic.

Population and Demographic Change

Health

Energy and Environment

Food and Agriculture

Poverty and Economic Development

Education and Knowledge

Innovation and Technological Change

Living Conditions, Community, and Wellbeing

Human Rights and Democracy

Violence and War