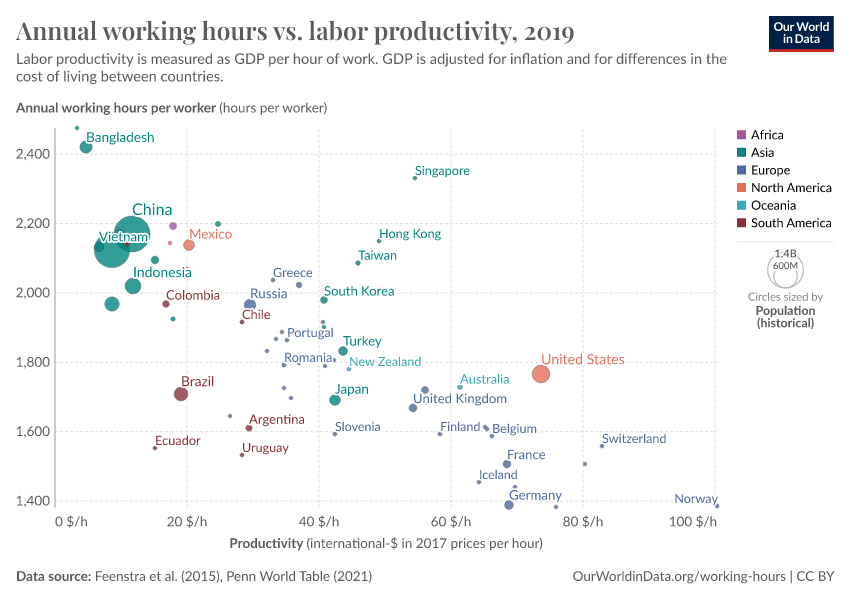
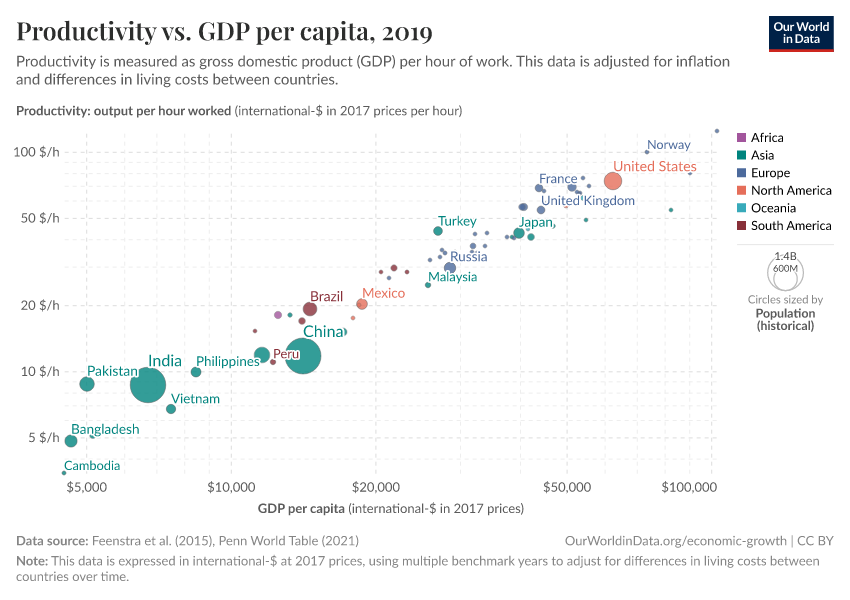
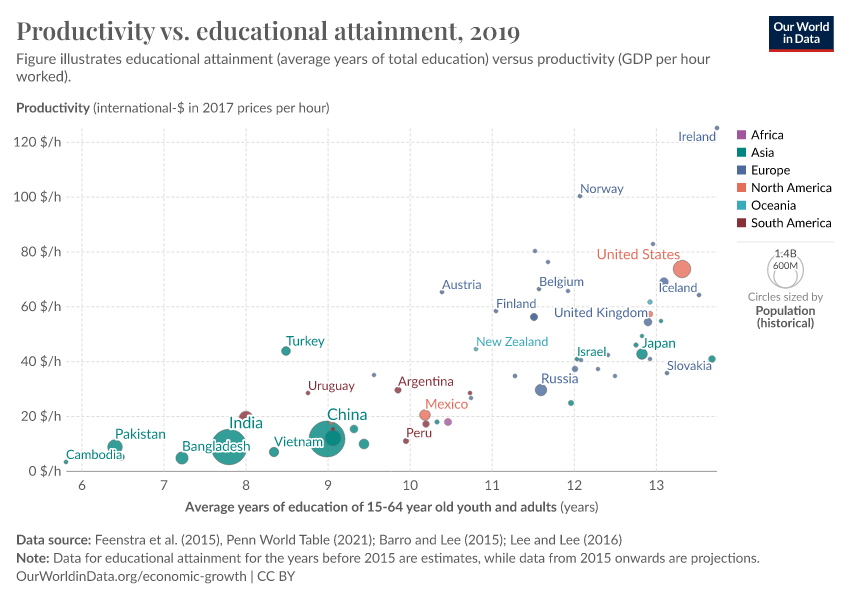
Productivity: output per hour worked

What you should know about this indicator
- This data is adjusted for inflation and differences in living costs between countries.
- This data is expressed in international-$ at 2021 prices, using a multiple benchmark approach that incorporates PPP estimates from all available benchmark years.
Related research and writing
What you should know about this indicator
- This data is adjusted for inflation and differences in living costs between countries.
- This data is expressed in international-$ at 2021 prices, using a multiple benchmark approach that incorporates PPP estimates from all available benchmark years.
Frequently Asked Questions
What are international-$ and why are they used to measure incomes?
Much of the economic data we use to understand the world, such as the incomes people receive or the goods and services firms produce and people buy, is recorded in the local currencies of each country. That means the numbers start out in rupees, US dollars, yuan, and many others, and without adjusting for inflation over time. This is known as being in “current prices” or “nominal” terms.
Sources and processing
This data is based on the following sources
How we process data at Our World in Data
All data and visualizations on Our World in Data rely on data sourced from one or several original data providers. Preparing this original data involves several processing steps. Depending on the data, this can include standardizing country names and world region definitions, converting units, calculating derived indicators such as per capita measures, as well as adding or adapting metadata such as the name or the description given to an indicator.
At the link below you can find a detailed description of the structure of our data pipeline, including links to all the code used to prepare data across Our World in Data.
Notes on our processing step for this indicator
We calculated productivity by dividing GDP (output side, multiple price benchmarks) by the number of people in work (employees and self-employed) and the average hours they work.
We excluded values considered outliers in the original dataset (i_outlier = "Outlier"), due to implausible relative prices (PPPs divided by exchange rates).
We replaced GDP values for Bermuda with different estimates (output side, single price benchmark) due to the unusual changes on prices in this country.
Reuse this work
- All data produced by third-party providers and made available by Our World in Data are subject to the license terms from the original providers. Our work would not be possible without the data providers we rely on, so we ask you to always cite them appropriately (see below). This is crucial to allow data providers to continue doing their work, enhancing, maintaining and updating valuable data.
- All data, visualizations, and code produced by Our World in Data are completely open access under the Creative Commons BY license. You have the permission to use, distribute, and reproduce these in any medium, provided the source and authors are credited.
Citations
How to cite this page
To cite this page overall, including any descriptions, FAQs or explanations of the data authored by Our World in Data, please use the following citation:
“Data Page: Productivity: output per hour worked”, part of the following publication: Max Roser, Bertha Rohenkohl, Pablo Arriagada, Joe Hasell, Hannah Ritchie, and Esteban Ortiz-Ospina (2023) - “Economic Growth”. Data adapted from Feenstra et al.. Retrieved from https://archive.ourworldindata.org/20251013-111729/grapher/labor-productivity-per-hour-pennworldtable.html [online resource] (archived on October 13, 2025).How to cite this data
In-line citationIf you have limited space (e.g. in data visualizations), you can use this abbreviated in-line citation:
Feenstra et al. - Penn World Table (2025) – with major processing by Our World in DataFull citation
Feenstra et al. - Penn World Table (2025) – with major processing by Our World in Data. “Productivity: output per hour worked – Penn World Table – In constant international-$” [dataset]. Feenstra et al., “Penn World Table 11.0” [original data]. Retrieved February 6, 2026 from https://archive.ourworldindata.org/20251013-111729/grapher/labor-productivity-per-hour-pennworldtable.html (archived on October 13, 2025).

