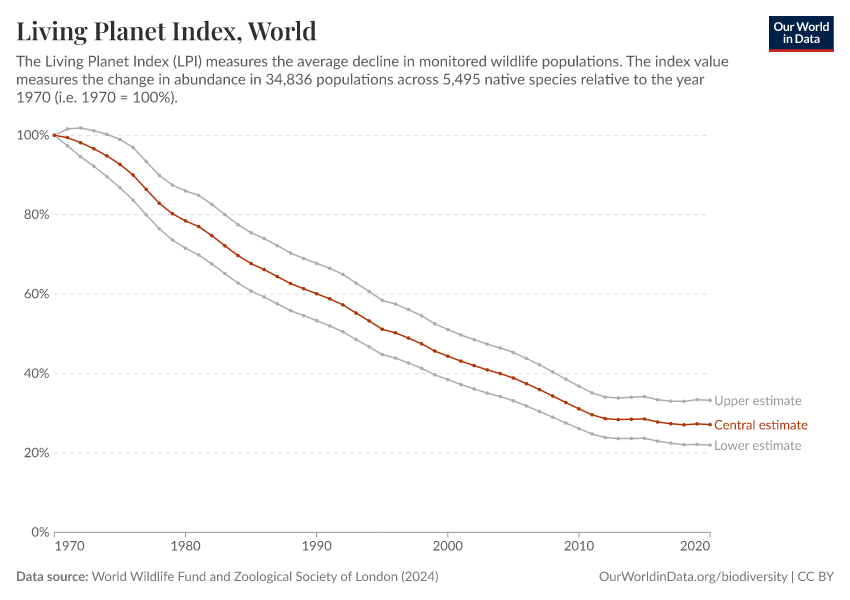
Interactive visualization requires JavaScript
Related research and data
- Biodiversity
- How does the Living Planet Index vary by region?
- Living Planet Index: what does it really mean?
- Sustainably manage forests, combat desertification, halt and reverse land degradation, halt biodiversity loss
- The 2024 Living Planet Index reports a 73% average decline in wildlife populations — what’s changed since the last report?
Charts
- African elephant carcass ratio
- Annual fish catch relative to mean catch
- Annual fish catch relative to mean catch by region
- Aquaculture production
- Black rhino population
- Capture fishery production
- Change in bird populations in the EU
- Change in total mangrove area
- Changes in UK butterfly populations
- Chlorophyll-a deviation from the global average
- Comparison of the Living Planet Index across reports
- Countries have a budget for invasive alien species management
- Countries that are party to the Nagoya Protocol
- Countries that have legislative measures reported to the Access and Benefit-Sharing Clearing-House
- Countries with more than 25 species at risk of losing more than 25% of their habitat by 2050
- Cumulative first records of alien species
- Day of the year with peak cherry tree blossom in Kyoto, Japan
- Drivers of recovery in European bird populations
- Endemic amphibian species
- Endemic bird species
- Endemic freshwater crab species
- Endemic mammal species
- Endemic reef-forming coral species
- Endemic shark and ray species
- Fish and seafood production
- Fish catch in the United Kingdom
- Fish discards
- Fish stocks and fishing intensity by group
- Fish stocks and fishing intensity by region
- Fishing intensity
- Fishing intensity by region
- Five centuries of cod catches in Eastern Canada
- Global aquaculture production and wild fish used for animal feed
- Global biomass vs. abundance of taxa
- Global first records of non-native species
- Global wildlife exports
- Health of fish stocks by fish group
- Health of fish stocks by region
- Indian rhino population
- Javan rhino population
- Living Planet Index by region
- Local animal breeds with conserved genetic material
- Material footprint per capita
- Material footprint per gross domestic product
- Member countries of the International Treaty on Plant Genetic Resources for Food and Agriculture
- Mountain Green Cover Index
- National biodiversity strategy and action plan targets align with Aichi Biodiversity Target 9
- National progress towards Aichi Biodiversity Target 2
- Northern white rhino population
- Number of African elephants
- Number of Asian elephants
- Number of animal species losing habitat due to cropland expansion by 2050
- Number of coral bleaching events
- Number of coral bleaching events by stage of the ENSO cycle
- Number of described species
- Number of parties in multilateral environmental agreements
- Number of rhinos poached
- Number of severe coral bleaching events by stage of the ENSO cycle
- Number of species evaluated for their level of extinction risk
- Number of species threatened with extinction
- Number of threatened endemic mammal species
- Number of unique plant genetic samples in conservation facilities
- Number of whales killed
- Number of whales killed globally per decade
- Projected changes in cropland
- Proportion of local livestock breeds at risk of extinction
- Protected area coverage of marine key biodiversity areas
- Protected area coverage of mountain key biodiversity areas
- Recorded species extinctions since 1500
- Red List Index
- Seafood production: wild fish catch vs. aquacultureLine chart
- Seafood production: wild fish catch vs. aquacultureStacked area chart
- Share of Caribbean reefs with Acropora corals present or dominant
- Share of described species that have been evaluated for their extinction risk
- Share of fish stocks that are overexploited
- Share of forest area within protected areas
- Share of freshwater Key Biodiversity Areas that are protected
- Share of land area that is protected
- Share of land covered by forest
- Share of marine territorial waters that are protected
- Share of ocean area that is protected
- Share of populations increasing, stable or declining in the Living Planet Index
- Share of species that are traded
- Share of species threatened with extinction
- Share of terrestrial Key Biodiversity Areas that are protected
- Southern white rhino population
- Species represented in the Living Planet Index
- Status of the world's fish stocks
- Sumatran rhino population
- The decline of global whale biomass
- The decline of global whale populations
- Threatened bird species
- Threatened endemic bird species
- Threatened endemic reef-forming coral species
- Threatened fish species
- Threatened mammal species
- Total amount donated for biodiversity conservation in developing countries
- Total donations received for biodiversity conservation
- Transboundary animal breeds with conserved genetic material
- Weight of seized rhino horns
- What is wild fish catch used for?
- Which countries are members of the International Whaling Commission?
- Wild fish catch by gear typeStacked area chart
- Wild fish catch by gear typeLine chart
- Wild fish catch from bottom trawling