12 key metrics to understand the state of the world
Our World in Data is home to thousands of charts. But some metrics are core to our work: here we present 12 that help us understand the state of the world.
At Our World in Data, our mission is to present research and data to make progress against the world’s largest problems. These problems are broad and varied, ranging from poverty to health, education, environment, conflict, and human rights.
Therefore, we present many charts — now more than 10000 — across many topics. All of these represent a piece in the jigsaw that gives us a perspective on the state of the world and how to make progress against the problems we face. However, some metrics stand out: they are core to our work and understanding of the world. You will find them appearing again and again throughout Our World in Data.
We have tried to distill this list down to 12 core metrics. Making these choices isn’t easy– all the indicators we cover matter to understanding global development. As with everything else on Our World in Data, we update our content as new data becomes available so you can keep coming back and seeing how the world is changing. It is also worth mentioning that we make sure that links to us don’t break — if you embed one of these visualizations, you can be sure it will remain available for many years.
To make them more easily findable, we have gathered them together here in a single place:
(1) Extreme Poverty
(2) GDP per capita
(3) Population
(4) Child Mortality
(5) Fertility Rate
(6) Life Expectancy
(7) Hunger and Undernourishment
(8) Education – years of schooling and literacy
(9) Improved water sources and sanitation
(10) Energy Access
(11) Energy Use
(1) Extreme Poverty
Ending global poverty is surely one of the world’s most pressing problems. Leaving the worst poverty behind is critical to so many other aspects of development we cover — ranging from hunger and malnutrition to health, education, and access to basic resources.
Extreme poverty — indeed a very extreme poverty line — is defined by the “International Poverty Line,” which is living on less than $3 per day. This line is set by the World Bank and used by the UN to monitor extreme poverty worldwide. In these measurements, statisticians adjust for inflation and price differences between countries. You can read more about this adjustment in our article here.
The visualization shows the share of people living in extreme poverty in recent decades. This provides the most up-to-date estimates of extreme poverty from the World Bank. You can find estimates of global extreme poverty over the past two centuries here.
As we emphasize, the international poverty line is very low — well below what would be required to live a healthy and comfortable life. In the following chart, we also show data on the share (or you can switch to absolute numbers in the Settings using the “Display relative values” toggle) of the population living above or below higher poverty lines.
You can find more data, research, and writing on our topic page on Poverty.


(2) GDP per capita
Lifting people out of poverty — relative to the most extreme poverty line and higher thresholds — relies on economic growth worldwide.
For most of human history, our ancestors were stuck in a world of poor health, hunger, and little access to formal education. Economic growth — particularly over the past few centuries — has allowed some of the world's population to break out of these conditions.
Economic growth is measured as an increase in the gross domestic product (GDP) per capita. Just as the poverty measure above, this metric is adjusted for price changes over time and price differences between countries.
The visualizations show our long-run (dating back to year 1) dataset on GDP per capita from the Maddison Project Database; and the World Bank that we rely on when focusing on the development over the last three decades.
You will find more research in our topic on Economic Growth.


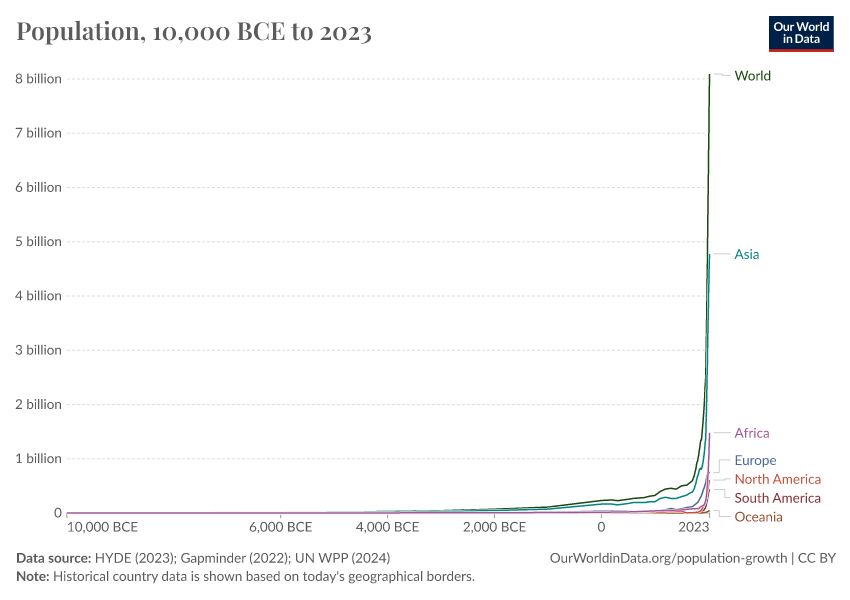
(3) Population
The size of the population is our most commonly used metric, either directly or indirectly. You will find that throughout Our World in Data, we present many metrics — ranging from poverty and income in the above examples to child mortality (below), electricity access, and CO2 emissions — in per capita terms and absolute numbers.
As we describe here in our post on the global population cartogram, knowing how people are distributed worldwide is key to understanding how living conditions are changing.
The visualization shows our long-run dataset on population. This provides data on global and regional populations dating back to 1800. In the related chart, you can find these estimates dating back to 10,000 BC.
You will find more research in our topic on Population Growth.

(4) Child Mortality
One of the best indicators of how a country is doing is a newborn’s chances of surviving childhood. How able societies are to protect their children from dying is a crucial benchmark, one that reflects many aspects of development: healthcare, nutrition, maternal health, disease prevention, and treatment. We can think of child mortality in some sense as an aggregate indicator of a country's living conditions.
Child mortality is measured as the share of newborns that die before age five.
We present our long- and short-run datasets on child mortality worldwide in the visualizations. The long-run estimates come from Gapminder and the UN Inter-agency Group for Child Mortality Estimation (UN IGME) data.
Our short-run and most up-to-date dataset on child mortality comes from the UN Inter-agency Group for Child Mortality Estimation (UN IGME).
You will find more research in our topic on Child & Infant Mortality.


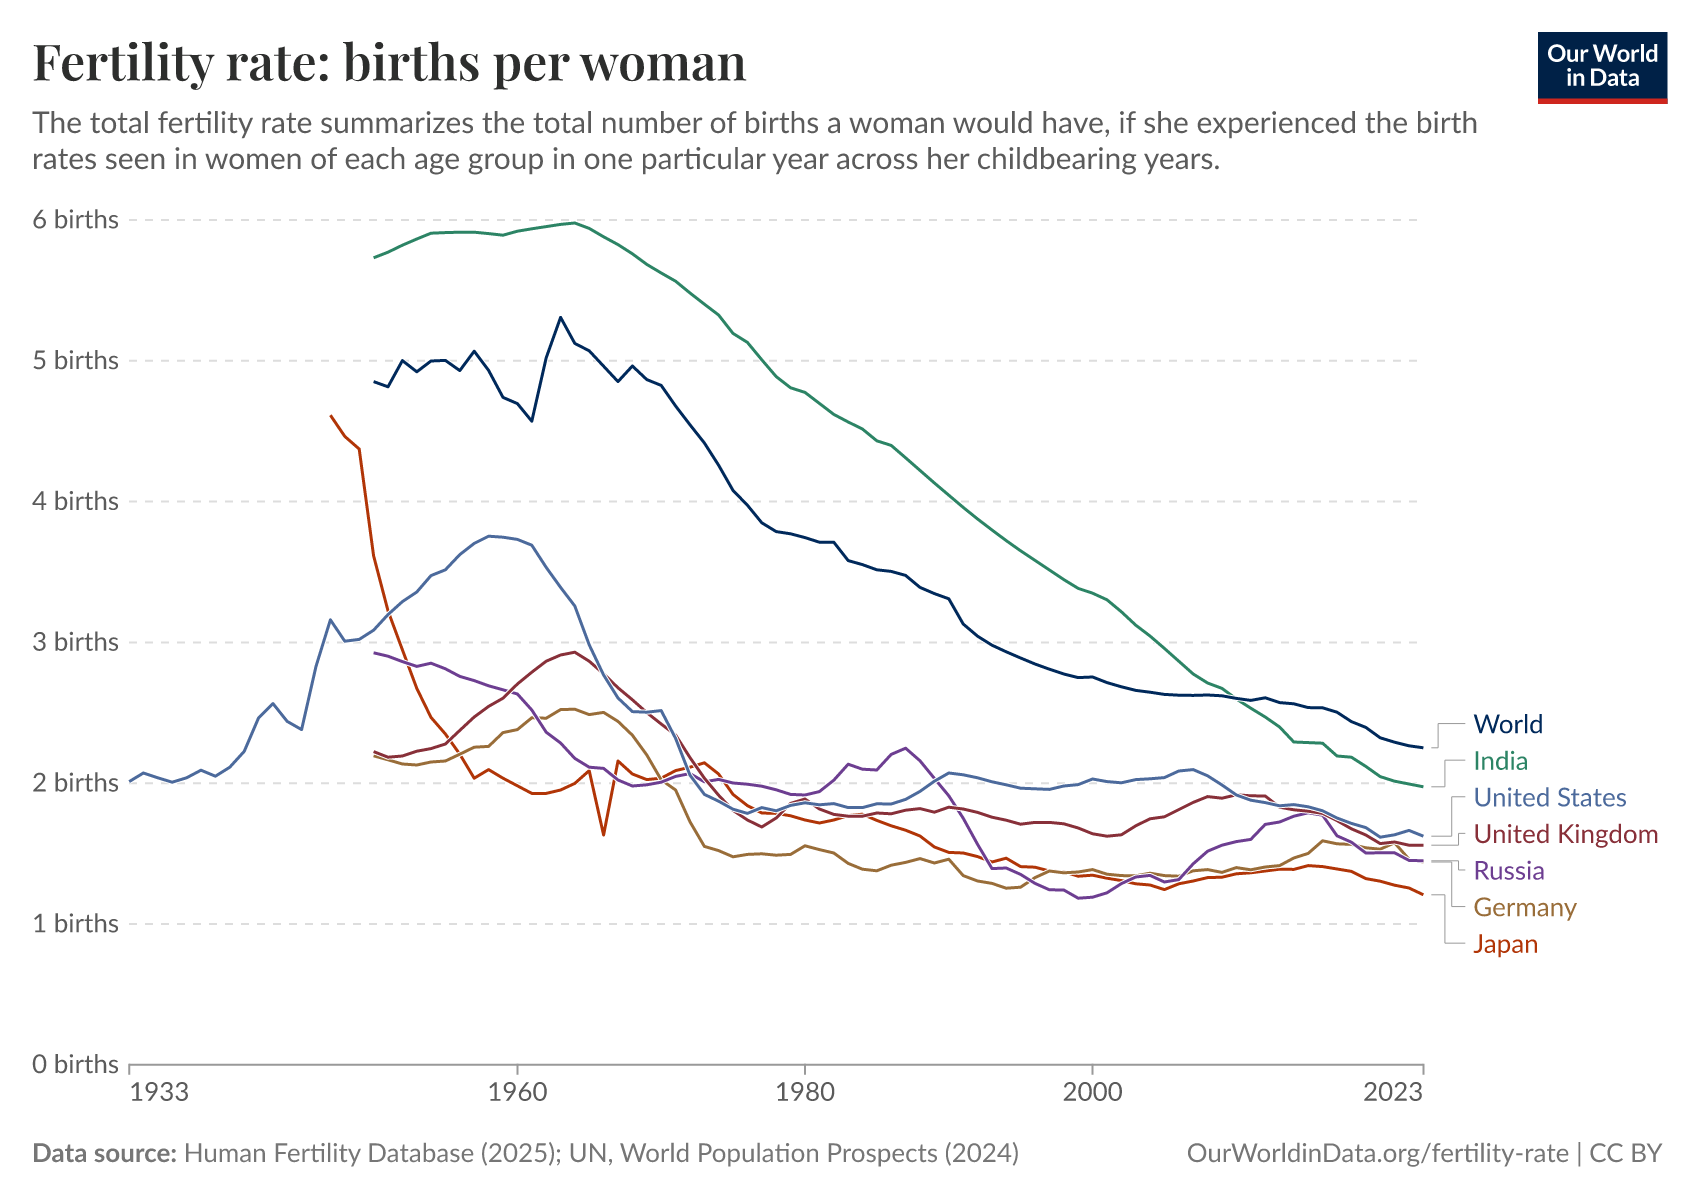
(5) Fertility Rate
Fertility rate — the average number of children per woman — is an important development indicator, not only in its impact on population and demographics but also as a proxy measure of other aspects of progress such as education, access to family planning and contraception, and child mortality.
The following visualization shows the long-run dataset on fertility rates based on estimates published by the UN Population Division and historical estimates that Gapminder has assembled. These historical estimates go back to the year 1541 for some countries.
In this dataset, we show only data backed up with published estimates within the academic literature or United Nations Population Division. Gapminder also publishes long-run estimates for all countries — but stresses that these estimates come with high uncertainty. The full dataset can be found here.
You will find more research in our topic on Fertility Rate.
(6) Life expectancy
Life expectancy is one of the most indicative metrics to evaluate our progress in improving health worldwide. It is not only reflective of increasing longevity and maximum lifespans but is also a strong reflection of child health and mortality.
We describe how life expectancy is measured in detail here.
Long-run estimates of life expectancy across the world are shown in the visualization. For countries where historical records are much more readily available — such as the UK — estimates can extend back to 1543 — click on the UK to see this long-run perspective. Global and regional estimates extend back to the year 1770.
This dataset is based on data from the Clio Infra project, the UN Population Division, and global estimates for world regions from James Riley (2005).1
You will find more research in our topic on Life Expectancy.

(7) Hunger and Undernourishment
Hunger has been a severe problem for humanity throughout most of our history. Growing enough food to feed one’s family was a constant struggle in daily life. Malnutrition and Famines were common around the world.
The visualization shows our dataset on hunger across the world. This data is sourced from the UN Food and Agriculture Organization (FAO).
Hunger — also often referred to as undernourishment — is defined as having a calorie (i.e. energy) intake which is below an individual’s minimum requirements to lead a healthy life. Energy requirements of course, vary depending on a person’s sex, weight, height, and activity levels, which is considered in national and global estimates.
Having enough food to eat in energy terms is not the only requirement for good nutrition and health. The quality and diversity of diets in terms of protein and micronutrient intake are also important. We cover micronutrient deficiencies across the world in our entry on that topic here.
You find more research in our topic on Hunger and Undernourishment.

(8) Education – years of schooling and literacy
Education has been one of global development's most integral drivers and outcomes.
Education provision is now viewed in most parts of the world as a basic right – with pressure on governments to ensure high-quality education for all.
We can use many metrics to assess education access, quality, and attainment — we cover many of them throughout our work on education. In this list of the most important metrics, we include two encompassing indicators: one as an educational input (the time adults over 25 have been in formal education) and an output variable (literacy rates).
The visualizations present these metrics over the long term:
- Mean years of schooling estimate the average number of years of total schooling adults aged 25 years and older have received. This data extends back to the year 1870 and is based on the combination of data from Lee and Lee (2016); Barro-Lee (2018); and the UN Development Programme.
- The literacy rate measures the share of the population older than 14 years who can read and write. It is based on a combination of sources from the World Bank, CIA Factbook, and additional academic sources. You can find more information on literacy here.
You find more research in our topics of Global Education and Literacy.


(9) Improved water sources and sanitation
Clean water and sanitation is a basic human need and right.
Unsafe water and poor sanitation are leading risk factors for death, particularly in low-income countries. This is especially true for children: around one million annual child deaths are attributed to unsafe water, sanitation, and poor hygiene.
In the visualizations, we present our datasets on the share of populations worldwide that use ‘improved’ drinking water and sanitation facilities.
An “improved” drinking water source is defined as piped water on premises (piped household water connection located inside the user’s dwelling, plot, or yard) or other improved drinking water sources (public taps or standpipes, tube wells or boreholes, protected dug wells, protected springs, and rainwater collection). “Improved” sanitation facilities include flush/pour flush (to a piped sewer system, septic tank, pit latrine), ventilated improved pit (VIP) latrine, pit latrine with slab, and composting toilet.
One caveat to these definitions is that they make it much more likely that the source is clean and safe, but do not guarantee it. Additional metrics are being developed which aim to assess more directly the availability of clean water and safe sanitation. These metrics are the basis of two Sustainable Development Goal targets, and we present this data in our SDG-Tracker (for water here, and sanitation here).
Unfortunately, there are still large gaps in data availability for these direct metrics for clean water and safe sanitation across the world — many countries have no estimates currently available. For this reason, we continue to present data on “improved” water sources and sanitation to provide a complete global picture. Once much wider data on safe drinking water and sanitation is available, we will adopt these as our core metrics.
You can find more research in our topic page on Water Use and Sanitation.


(10) Energy Access
Access to energy is a critical aspect of global development. It is enormously important to improve living conditions: through the freeing of time from household chores (for example, washing clothes or cooking); increased productivity; improved healthcare; and digital connections to local and global networks.
The lack of access to clean fuels for cooking is one of the most pressing environmental health problems: an estimated 1.6 million die from household air pollution every year because they do not have access to clean fuels for cooking and heating. Particularly in Africa and parts of Asia.
Basic energy access is measured through two indicators: access to electricity, and clean fuels for cooking. The visualizations show the data on these two metrics across the world.
You will find more research in our topic on Energy Access.


(11) Energy Use
Having access to electricity and clean cooking and heating fuels (as we look at above) is a basic requirement to having sufficient energy to live a productive and healthy life. But this doesn’t tell us a lot about the quantity of energy people use. Some households may have access to electricity but can afford to use only very little. This could be insufficient to meet their needs.
Energy use — the average per capita energy consumption — is, therefore, another important metric to monitor to understand global development. The visualization provides coverage of energy use per capita — from all sources, including biomass — worldwide.
Total energy consumption (and the sources of this energy mix) are also important to resource and environmental concerns. We cover these metrics in detail here.
You will find more research in our topic on Energy Access.

(12) CO2 emissions
Economic growth and improving living standards have come at the cost of environmental degradation. One of the key trade-offs between human development and the environment is rising carbon dioxide (CO2) emissions. We know that as people get richer, their CO2 emissions tend to increase.
CO2 emissions have increased rapidly in recent decades; globally, we now emit more than 36 billion tonnes each year.
There are many indicators we can use to look at CO2 emissions across the world: cumulative, annual, per capita, production vs. consumption-based, carbon intensity, sectorial or emissions embedded in trade. All of these metrics you can find in detail here.
The two core datasets we present are production-based per capita CO2 emissions. This is shown in the visualization. This data is sourced from the Global Carbon Project and the Carbon Dioxide Information Analysis Centre (CDIAC), with population from Gapminder and the UN Population Division used to calculate per capita figures.
You find more research in our topic on CO2 and Greenhouse Gas Emissions.

Endnotes
James C. Riley (2005) – Estimates of Regional and Global Life Expectancy, 1800–2001. Issue Population and Development Review. Population and Development Review. Volume 31, Issue 3, pages 537–543, September 2005.
Zijdeman, Richard; Ribeira da Silva, Filipa, 2015, "Life Expectancy at Birth (Total)", http://hdl.handle.net/10622/LKYT53, IISH Dataverse, V1.
United Nations, Department of Economic and Social Affairs, Population Division (2017). World Population Prospects: The 2019 Revision, DVD Edition.
Cite this work
Our articles and data visualizations rely on work from many different people and organizations. When citing this article, please also cite the underlying data sources. This article can be cited as:
Hannah Ritchie (2019) - “12 key metrics to understand the state of the world” Published online at OurWorldinData.org. Retrieved from: 'https://archive.ourworldindata.org/20260729-153957/12-key-metrics.html' [Online Resource] (archived on July 29, 2026).BibTeX citation
@article{owid-12-key-metrics,
    author = {Hannah Ritchie},
    title = {12 key metrics to understand the state of the world},
    journal = {Our World in Data},
    year = {2019},
    note = {https://archive.ourworldindata.org/20260729-153957/12-key-metrics.html}
}
Reuse this work freely
All visualizations, data, and articles produced by Our World in Data are completely open access under the Creative Commons BY license. You have the permission to use, distribute, and reproduce these in any medium, provided the source and authors are credited.
The data produced by third parties and made available by Our World in Data is subject to the license terms from the original third-party authors. We will always indicate the original source of the data in our documentation, so you should always check the license of any such third-party data before use and redistribution.
All of our charts can be embedded in any site.