Economic Inequality by Gender
How big are the inequalities in pay, jobs, and wealth between men and women? What causes these differences?
This page was first published in March 2018. We made changes to the text in March 2024.
On this page, you can find writing, visualizations, and data on how big the inequalities in pay, jobs, and wealth are between men and women, how they have changed over time, and what may be causing them
Although economic gender inequalities remain common and large, they are today smaller than they used to be some decades ago.
Related topics
See all interactive charts on economic inequality by gender ↓
How does the gender pay gap look like across countries and over time?
The 'gender pay gap' comes up often in political debates, policy reports, and everyday news. But what is it? What does it tell us? Is it different from country to country? How does it change over time?
Here we try to answer these questions, providing an empirical overview of the gender pay gap across countries and over time.
The gender pay gap measures inequality but not necessarily discrimination
The gender pay gap (or the gender wage gap) is a metric that tells us the difference in pay (or wages, or income) between women and men. It's a measure of inequality and captures a concept that is broader than the concept of equal pay for equal work.
Differences in pay between men and women capture differences along many possible dimensions, including worker education, experience, and occupation. When the gender pay gap is calculated by comparing all male workers to all female workers – irrespective of differences along these additional dimensions – the result is the 'raw' or 'unadjusted' pay gap. On the contrary, when the gap is calculated after accounting for underlying differences in education, experience, etc., then the result is the 'adjusted' pay gap.
Discrimination in hiring practices can exist in the absence of pay gaps – for example, if women know they will be treated unfairly and hence choose not to participate in the labor market. Similarly, it is possible to observe large pay gaps in the absence of discrimination in hiring practices – for example, if women get fair treatment but apply for lower-paid jobs.
The implication is that observing differences in pay between men and women is neither necessary nor sufficient to prove discrimination in the workplace. Both discrimination and inequality are important. But they are not the same.
In most countries, there is a substantial gender pay gap
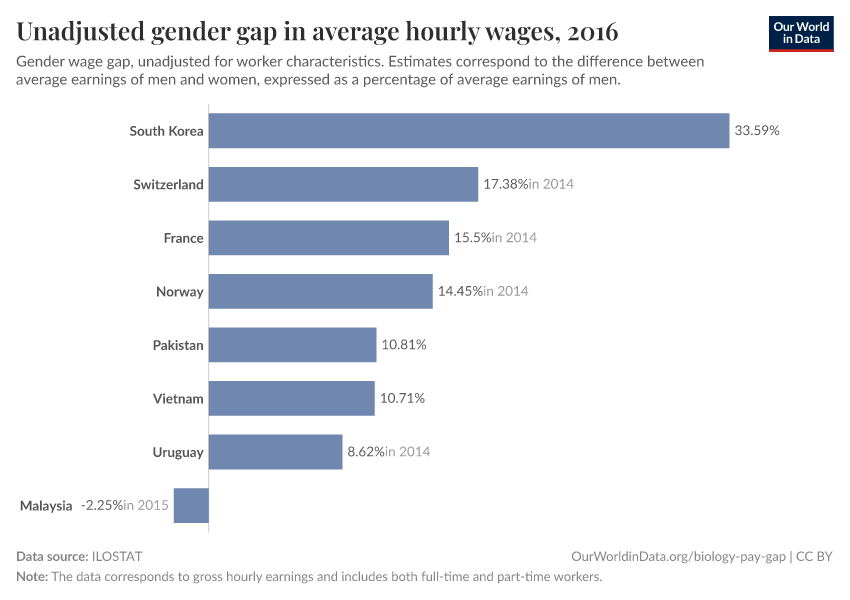
Cross-country data on the gender pay gap is patchy, but the most complete source in terms of coverage is the United Nation's International Labour Organization (ILO). The visualization here presents this data. You can add observations by clicking on the option 'add country' at the bottom of the chart.

The estimates shown here correspond to differences between the average hourly earnings of men and women (expressed as a percentage of average hourly earnings of men), and cover all workers irrespective of whether they work full-time or part-time.1
As we can see: (i) in most countries the gap is positive – women earn less than men, and (ii) there are large differences in the size of this gap across countries.2
In most countries, the gender pay gap has decreased in the last couple of decades
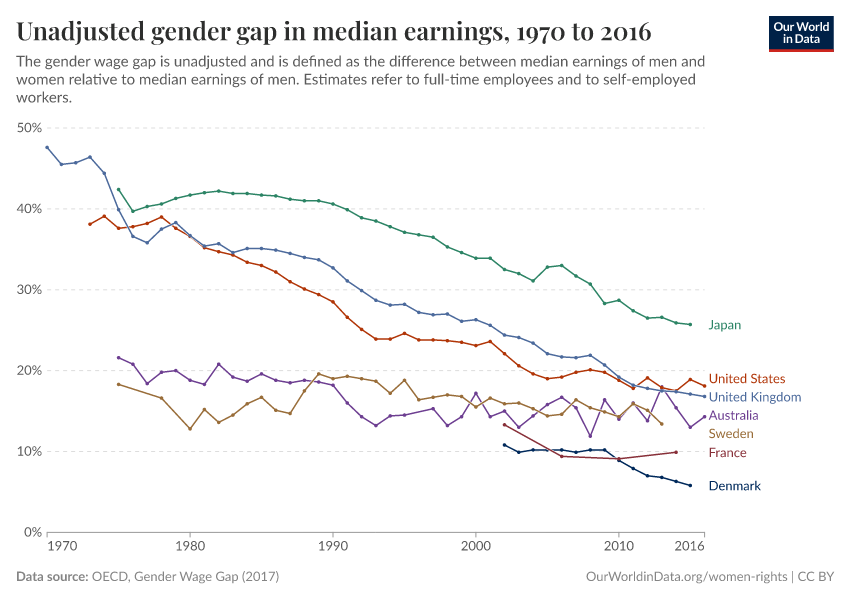
How is the gender pay gap changing over time? To answer this question, let's consider this chart showing available estimates from the OECD. These estimates include OECD member states, as well as some other non-member countries, and they are the longest available series of cross-country data on the gender pay gap that we are aware of.

Here we see that the gap is large in most OECD countries, but it has been going down in the last couple of decades. In some cases the reduction is remarkable. In the United States, for example, the gap declined by more than half.
These estimates are not directly comparable to those from the ILO, because the pay gap is measured slightly differently here: The OECD estimates refer to percent differences in median earnings (i.e. the gap here captures differences between men and women in the middle of the earnings distribution), and they cover only full-time employees and self-employed workers (i.e. the gap here excludes disparities that arise from differences in hourly wages for part-time and full-time workers).
However, the ILO data shows similar trends.
The conclusion is that in most countries with available data, the gender pay gap has decreased in the last couple of decades.
The gender pay gap is larger for older workers
The United States Census Bureau defines the pay gap as the ratio between median wages – that is, they measure the gap by calculating the wages of men and women at the middle of the earnings distribution, and dividing them.
By this measure, the gender wage gap is expressed as a percent (median earnings of women as a share of median earnings of men) and it is always positive. Here, values below 100% mean that women earn less than men, while values above 100% mean that women earn more. Values closer to 100% reflect a lower gap.
The next chart shows available estimates of this metric for full-time workers in the US, by age group.

First, we see that the series trends upwards, meaning the gap has been shrinking in the last couple of decades. Secondly, we see that there are important differences by age.
The second point is crucial to understanding the gender pay gap: the gap is a statistic that changes during the life of a worker. In most rich countries, it’s small when formal education ends and employment begins, and it increases with age. As we discuss in our analysis of the determinants below, the gender pay gap tends to increase when women marry and when/if they have children.
The gender pay gap is smaller in middle-income countries – which tend to be countries with low labor force participation of women
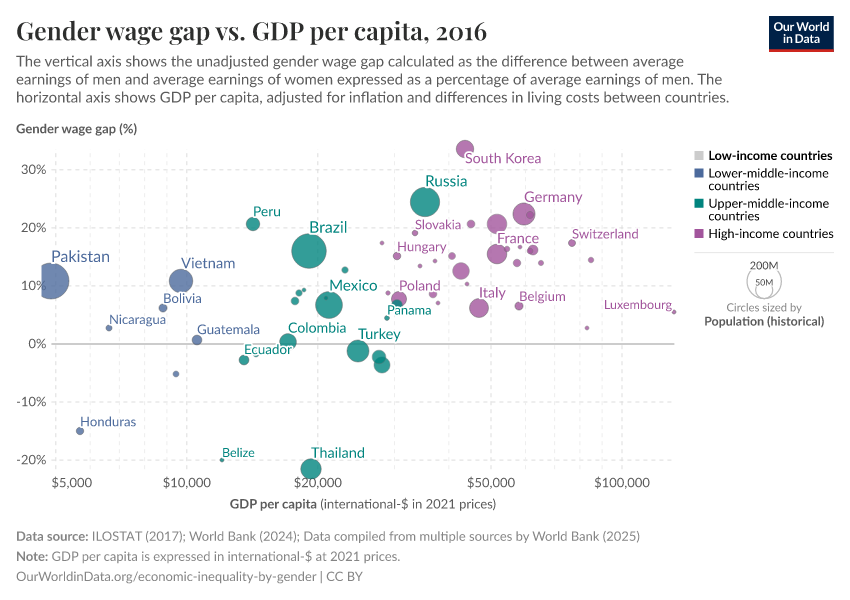
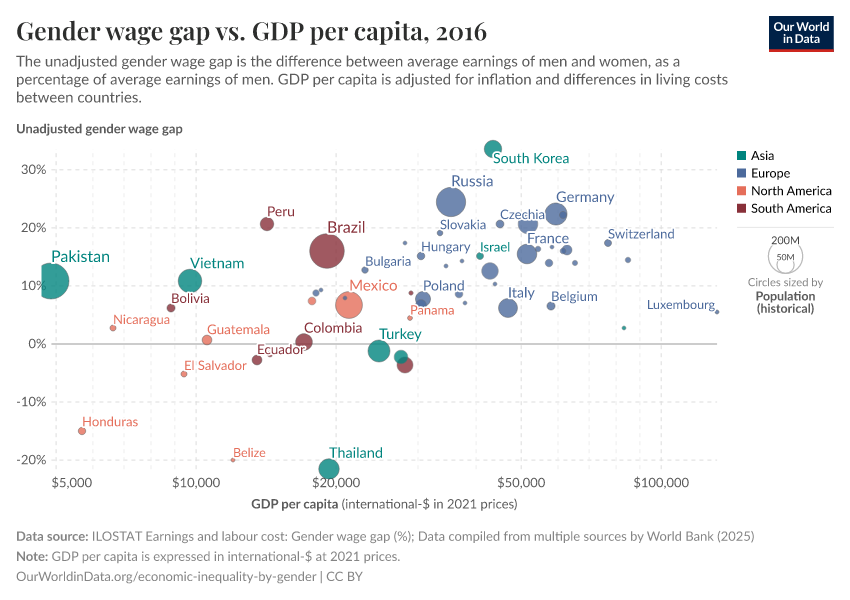
The chart here plots available ILO estimates on the gender pay gap against GDP per capita. As we can see there is a weak positive correlation between GDP per capita and the gender pay gap. However, the chart shows that the relationship is not really linear. Actually, middle-income countries tend to have the smallest pay gap.

The fact that middle-income countries have low gender wage gaps is, to a large extent, the result of selection of women into employment. Olivetti and Petrongolo (2008) explain it as follows: “[I]f women who are employed tend to have relatively high‐wage characteristics, low female employment rates may become consistent with low gender wage gaps simply because low‐wage women would not feature in the observed wage distribution.”3
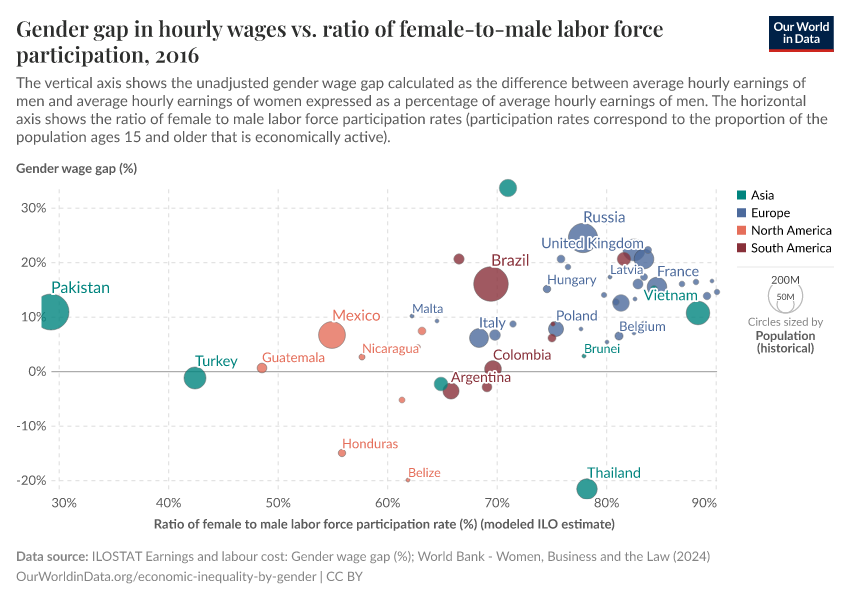
Olivetti and Petrongolo (2008) show that this pattern holds in the data: unadjusted gender wage gaps across countries tend to be negatively correlated with gender employment gaps. That is, the gender pay gaps tend to be smaller where relatively fewer women participate in the labor force.
So, rather than reflect greater equality, the lower wage gaps observed in some countries could indicate that only women with certain characteristics – for instance, with no husband or children – are entering the workforce.
Why is there a gender pay gap?
In almost all countries, if you compare the wages of men and women you find that women tend to earn less than men. These inequalities have been narrowing across the world. In particular, most high-income countries have seen sizeable reductions in the gender pay gap over the last couple of decades.
How did these reductions come about and why do substantial gaps remain?
Before we get into the details, here is a preview of the main points.
- An important part of the reduction in the gender pay gap in rich countries over the last decades is due to a historical narrowing, and often even reversal of the education gap between men and women.
- Today, education is relatively unimportant in explaining the remaining gender pay gap in rich countries. In contrast, the characteristics of the jobs that women tend to do, remain important contributing factors.
- The gender pay gap is not a direct metric of discrimination. However, evidence from different contexts suggests discrimination is indeed important to understand the gender pay gap. Similarly, social norms affecting the gender distribution of labor are important determinants of wage inequality.
- On the other hand, the available evidence suggests differences in psychological attributes and non-cognitive skills are at best modest factors contributing to the gender pay gap.
Differences in human capital
The adjusted pay gap
Differences in earnings between men and women capture differences across many possible dimensions, including education, experience, and occupation.
For example, if we consider that more educated people tend to have higher earnings, it is natural to expect that the narrowing of the pay gap across the world can be partly explained by the fact that women have been catching up with men in terms of educational attainment, in particular years of schooling.
Indeed, since differences in education partly contribute to explaining differences in wages, it is common to distinguish between 'unadjusted' and 'adjusted' pay differences.
When the gender pay gap is calculated by comparing all male and female workers, irrespective of differences in worker characteristics, the result is the raw or unadjusted pay gap. In contrast to this, when the gap is calculated after accounting for underlying differences in education, experience, and other factors that matter for the pay gap, then the result is the adjusted pay gap.
The idea of the adjusted pay gap is to make comparisons within groups of workers with roughly similar jobs, tenure, and education. This allows us to tease out the extent to which different factors contribute to observed inequalities.
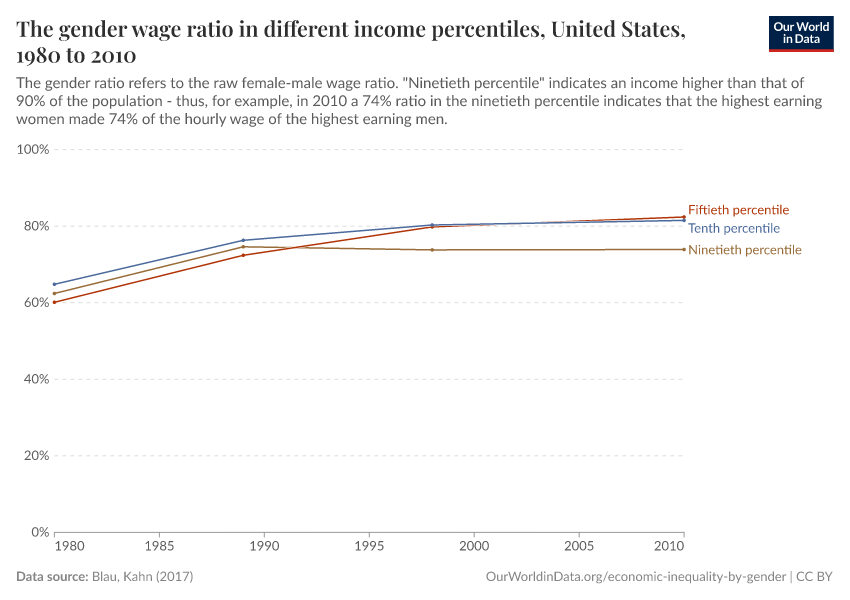
The chart here, from Blau and Kahn (2017) shows the evolution of the adjusted and unadjusted gender pay gap in the US.4
More precisely, the chart shows the evolution of female-to-male wage ratios in three different scenarios: (i) Unadjusted; (ii) Adjusted, controlling for gender differences in human capital, i.e. education and experience; and (iii) Adjusted, controlling for a full range of covariates, including education, experience, job industry, and occupation, among others. The difference between 100% and the full specification (the green bars) is the “unexplained” residual.5
Several points stand out here.
- First, the unadjusted gender pay gap in the US shrunk over this period. This is evident from the fact that the blue bars are closer to 100% in 2010 than in 1980.
- Second, if we focus on groups of workers with roughly similar jobs, tenure, and education, we also see a narrowing. The adjusted gender pay gap has shrunk.
- Third, we can see that education and experience used to help explain a very large part of the pay gap in 1980, but this changed substantially in the decades that followed. This third point follows from the fact that the difference between the blue and red bars was much larger in 1980 than in 2010.
- And fourth, the green bars grew substantially in the 1980s, but stayed fairly constant thereafter. In other words: Most of the convergence in earnings occurred during the 1980s, a decade in which the "unexplained" gap shrunk substantially.
Education and experience have become much less important in explaining gender differences in wages in the US
The next chart shows a breakdown of the adjusted gender pay gaps in the US, factor by factor, in 1980 and 2010.
When comparing the contributing factors in 1980 and 2010, we see that education and work experience have become much less important in explaining gender differences in wages over time, while occupation and industry have become more important.6
In this chart we can also see that the 'unexplained' residual has gone down. This means the observable characteristics of workers and their jobs explain wage differences better today than a couple of decades ago. At first sight, this seems like good news – it suggests that today there is less discrimination, in the sense that differences in earnings are today much more readily explained by differences in 'productivity' factors. But is this really the case?
The unexplained residual may include aspects of unmeasured productivity (i.e. unobservable worker characteristics that could not be accounted for in the study), while the "explained" factors may themselves be vehicles of discrimination.
For example, suppose that women are indeed discriminated against, and they find it hard to get hired for certain jobs simply because of their sex. This would mean that in the adjusted specification, we would see that occupation and industry are important contributing factors – but that is precisely because discrimination is embedded in occupational differences!
Hence, while the unexplained residual gives us a first-order approximation of what is going on, we need much more detailed data and analysis in order to say something definitive about the role of discrimination in observed pay differences.
Gender pay differences around the world are better explained by occupation than by education
The set of three maps here, taken from the World Development Report (2012), shows that today gender pay differences are much better explained by occupation than by education. This is consistent with the point already made above using data for the US: as education expanded radically over the last few decades, human capital has become much less important in explaining gender differences in wages.
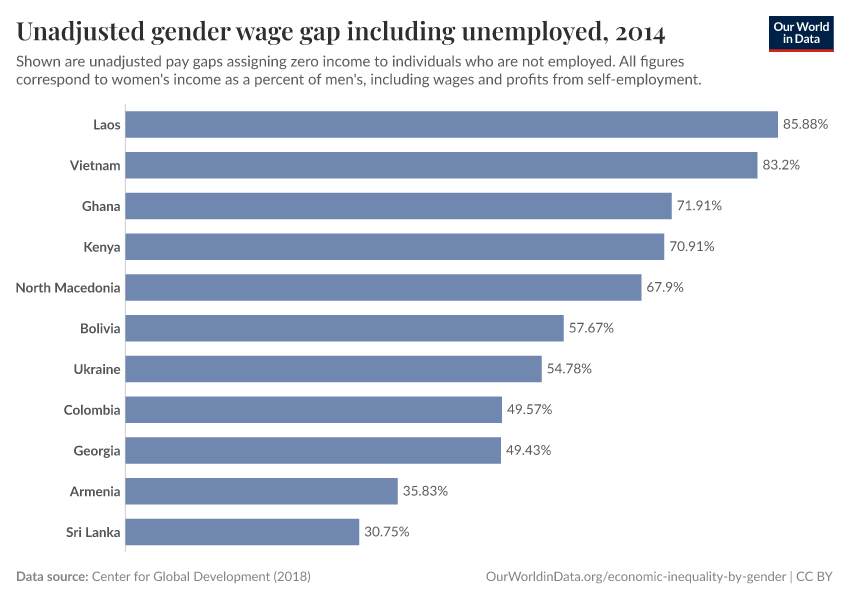
Justin Sandefur at the Center for Global Development shows that education also fails to explain wage gaps if we include workers with zero income (i.e. if we decompose the wage gap after including people who are not employed).
Looking beyond worker characteristics
Job flexibility
All over the world women tend to do more unpaid care work at home than men – and women tend to be overrepresented in low-paying jobs where they have the flexibility required to attend to these additional responsibilities.
The most important evidence regarding this link between the gender pay gap and job flexibility is presented and discussed by Claudia Goldin in the article 'A Grand Gender Convergence: Its Last Chapter', where she digs deep into the data from the US.8 There are some key lessons that apply both to rich and non-rich countries.
Goldin shows that when one looks at the data on occupational choice in some detail, it becomes clear that women disproportionately seek jobs, including full-time jobs, that tend to be compatible with childrearing and other family responsibilities. In other words, women, more than men, are expected to have temporal flexibility in their jobs. Things like shifting hours of work and rearranging shifts to accommodate emergencies at home. And these are jobs with lower earnings per hour, even when the total number of hours worked is the same.
The importance of job flexibility in this context is very clearly illustrated by the fact that, over the last couple of decades, women in the US increased their participation and remuneration in only some fields. In a recent paper, Goldin and Katz (2016) show that pharmacy became a highly remunerated female-majority profession with a small gender earnings gap in the US, at the same time as pharmacies went through substantial technological changes that made flexible jobs in the field more productive (e.g. computer systems that increased the substitutability among pharmacists).9
The chart here shows how quickly female wages increased in pharmacy, relative to other professions, over the last few decades in the US.
The motherhood penalty
Closely related to job flexibility and occupational choice is the issue of work interruptions due to motherhood. On this front, there is again a great deal of evidence in support of the so-called 'motherhood penalty'.
Lundborg, Plug, and Rasmussen (2017) provide evidence from Denmark – more specifically, Danish women who sought medical help in achieving pregnancy.10
By tracking women’s fertility and employment status through detailed periodic surveys, these researchers were able to establish that women who had a successful in vitro fertilization treatment, ended up having lower earnings down the line than similar women who, by chance, were unsuccessfully treated.
Lundborg, Plug, and Rasmussen summarise their findings as follows: "Our main finding is that women who are successfully treated by [in vitro fertilization] earn persistently less because of having children. We explain the decline in annual earnings by women working less when children are young and getting paid less when children are older. We explain the decline in hourly earnings, which is often referred to as the motherhood penalty, by women moving to lower-paid jobs that are closer to home."
The fact that the motherhood penalty is indeed about ‘motherhood’ and not ‘parenthood’, is supported by further evidence.
A recent study, also from Denmark, tracked men and women over the period 1980-2013 and found that after the first child, women’s earnings sharply dropped and never fully recovered. But this was not the case for men with children, nor the case for women without children.
These patterns are shown in the chart here. The first panel shows the trend in earnings for Danish women with and without children. The second panel shows the same comparison for Danish men.
Note that these two examples are from Denmark – a country that ranks high on gender equality measures and where there are legal guarantees requiring that a woman can return to the same job after taking time to give birth.
This shows that, although family-friendly policies contribute to improving female labor force participation and reducing the gender pay gap, they are only part of the solution. Even when there is generous paid leave and subsidized childcare, as long as mothers disproportionately take additional work at home after having children, inequities in pay are likely to remain.
Ability, personality, and social norms
The discussion so far has emphasized the importance of job characteristics and occupational choice in explaining the gender pay gap. This leads to obvious questions: What determines the systematic gender differences in occupational choice? What makes women seek job flexibility and take a disproportionate amount of unpaid care work?
One argument usually put forward is that, to the extent that biological differences in preferences and abilities underpin gender roles, they are the main factors explaining the gender pay gap. In their review of the evidence, Francine Blau and Lawrence Kahn (2017) show that there is limited empirical support for this argument.11
To be clear, yes, there is evidence supporting the fact that men and women differ in some key attributes that may affect labor market outcomes. For example, standardized tests show that there are statistical gender gaps in maths scores in some countries; and experiments show that women avoid more salary negotiations, and they often show particular predisposition to accept and receive requests for tasks with low promotion potential. However, these observed differences are far from being biologically fixed – 'gendering' begins early in life and the evidence shows that preferences and skills are highly malleable. You can influence tastes, and you can certainly teach people to tolerate risk, to do maths, or to negotiate salaries.
What's more, independently of where they come from, Blau and Kahn show that these empirically observed differences can typically only account for a modest portion of the gender pay gap.
In contrast, the evidence does suggest that social norms and culture, which in turn affect preferences, behavior, and incentives to foster specific skills, are key factors in understanding gender differences in labor force participation and wages. You can read more about this farther below.
Discrimination and bias
Independently of the exact origin of the unequal distribution of gender roles, it is clear that our recent and even current practices show that these roles persist with the help of institutional enforcement. Goldin (1988), for instance, examines past prohibitions against the training and employment of married women in the US. She touches on some well-known restrictions, such as those against the training and employment of women as doctors and lawyers, before focusing on the lesser known but even more impactful 'marriage bars' that arose in the late 1800s and early 1900s. These work prohibitions are important because they applied to teaching and clerical jobs – occupations that would become the most commonly held among married women after 1950. Around the time the US entered World War II, it is estimated that 87% of all school boards would not hire a married woman and 70% would not retain an unmarried woman who married.12
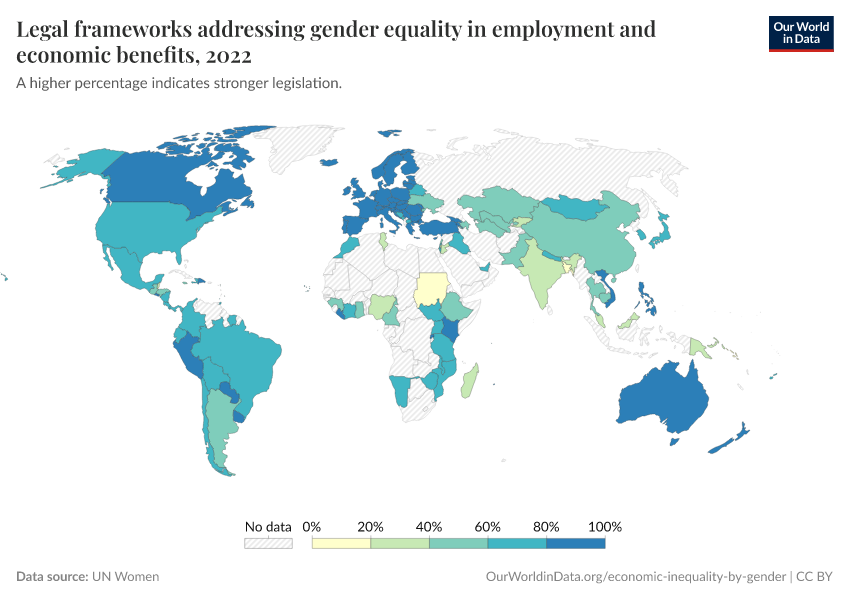
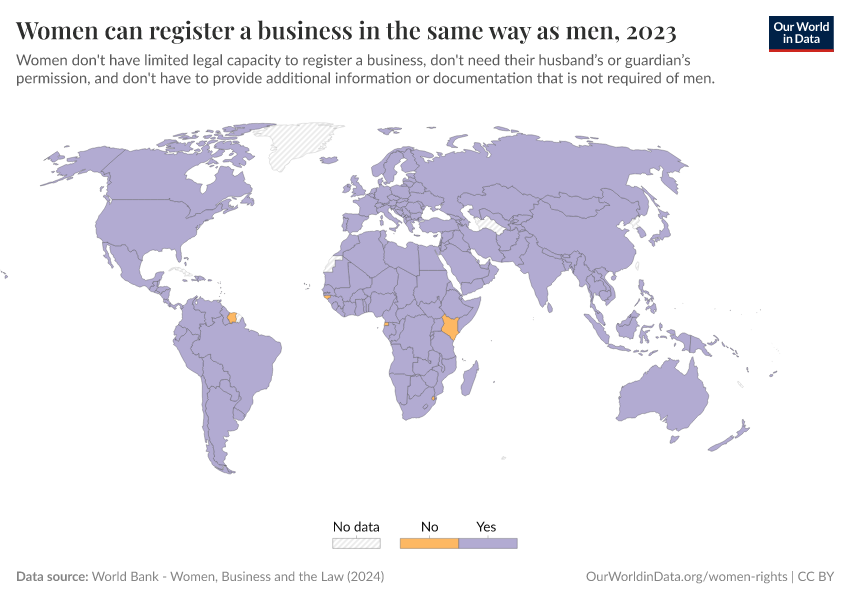
The map here highlights that to this day, explicit barriers limit the extent to which women are allowed to do the same jobs as men in some countries.13

However, even after explicit barriers are lifted and legal protections put in place, discrimination and bias can persist in less overt ways. Goldin and Rouse (2000), for example, look at the adoption of "blind" auditions by orchestras and show that by using a screen to conceal the identity of a candidate, impartial hiring practices increased the number of women in orchestras by 25% between 1970 and 1996.14
Many other studies have found similar evidence of bias in different labor market contexts. Biases also operate in other spheres of life with strong knock-on effects on labor market outcomes. For example, at the end of World War II only 18% of people in the US thought that a wife should work if her husband was able to support her. This obviously circles back to our earlier point about social norms.15
Strategies for reducing the gender pay gap
In many countries wage inequality between men and women can be reduced by improving the education of women. However, in many countries, gender gaps in education have been closed and we still have large gender inequalities in the workforce. What else can be done?
An obvious alternative is fighting discrimination. But the evidence presented above shows that this is not enough. Public policy and management changes on the firm level matter too: Family-friendly labor-market policies may help. For example, maternity leave coverage can contribute by raising women’s retention over the period of childbirth, which in turn raises women’s wages through the maintenance of work experience and job tenure.16
Similarly, early education and childcare can increase the labor force participation of women — and reduce gender pay gaps — by alleviating the unpaid care work undertaken by mothers.17
Additionally, the experience of women's historical advance in specific professions (e.g. pharmacists in the US), suggests that the gender pay gap could also be considerably reduced if firms did not have the incentive to disproportionately reward workers who work long hours, and fixed, non-flexible schedules.18
Changing these incentives is of course difficult because it requires reorganizing the workplace. But it is likely to have a large impact on gender inequality, particularly in countries where other measures are already in place.19
Implementing these strategies can have a positive self-reinforcing effect. For example, family-friendly labor-market policies that lead to higher labor-force attachment and salaries for women will raise the returns on women's investment in education – so women in future generations will be more likely to invest in education, which will also help narrow gender gaps in labor market outcomes down the line.20
Nevertheless, powerful as these strategies may be, they are only part of the solution. Social norms and culture remain at the heart of family choices and the gender distribution of labor. Achieving equality in opportunities requires ensuring that we change the norms and stereotypes that limit the set of choices available both to men and women. It is difficult, but as the next section shows, social norms can be changed, too.
How well do biological differences explain the gender pay gap?
Across the world, women tend to take on more family responsibilities than men. As a result, women tend to be overrepresented in low-paying jobs where they are more likely to have the flexibility required to attend to these additional responsibilities.
These two facts – documented above – are often used to claim that, since men and women tend to be endowed with different tastes and talents, it follows that most of the observed gender differences in wages stem from biological sex differences. But what’s the broader evidence for these claims?
In a nutshell, here's what the research and data shows:
- There is evidence supporting the fact that statistically speaking, men and women tend to differ in some key aspects, including psychological attributes that may affect labor-market outcomes.
- There is no consensus on the exact weight that nurture and nature have in determining these differences, but whatever the exact weight, the evidence does show that these attributes are strongly malleable.
- Regardless of the origin, these differences can only explain a modest part of the gender pay gap.
Some context regarding the gender distribution of labor
Before we get into the discussion of whether biological attributes explain wage differences via gender roles, let's get some perspective on the gender distribution of work.
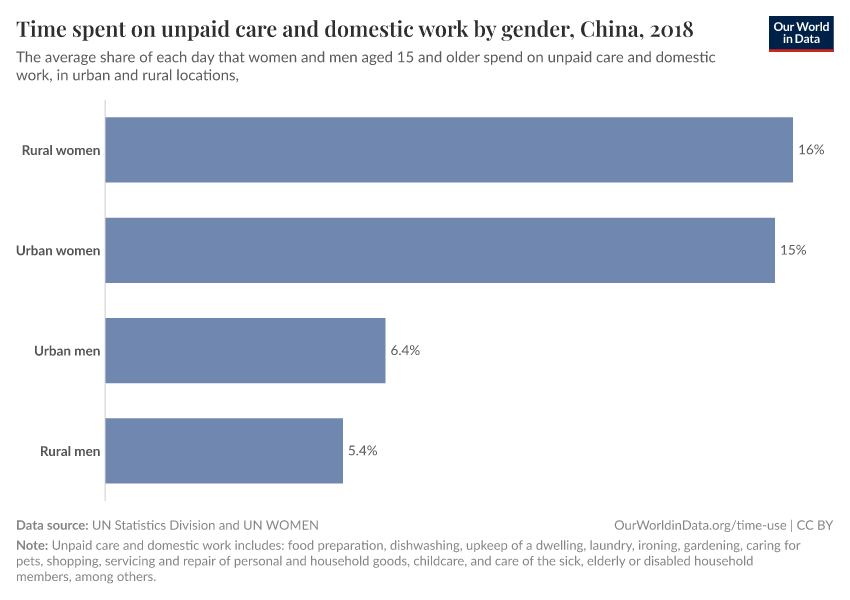
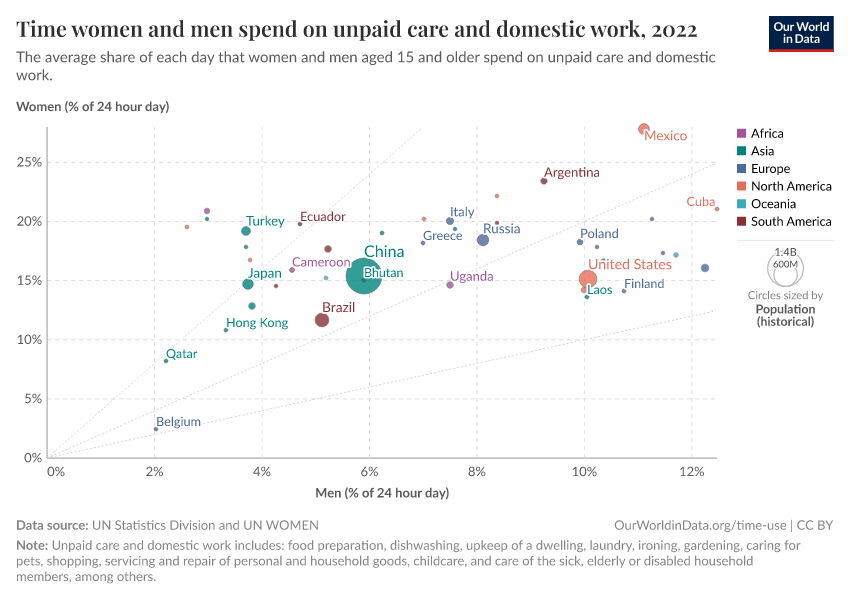
The following chart shows, by country, the female-to-male ratio of time devoted to unpaid care work, including tasks like taking care of children at home, housework, or doing community work. As can be seen, all over the world there is a radical unbalance in the gender distribution of labor – everywhere women take a disproportionate amount of unpaid work.

This is of course closely related to the fact that in most countries there are gender gaps in labor force participation and wages.
“Boys are better at maths”
Differences in biological attributes that determine our ability to develop 'hard skills', such as maths, are often argued to be at the heart of the gender pay gap.21 Do large gender differences in maths skills really exist? If so, is this because of differences in the attributes we are born with?
A common assumption is that boys consistently outperform girls in mathematics. But what does the data show?
If we look at the average standardized PISA math scores across countries, we find no consistent advantage for either gender. In some countries, boys perform better on average; in others, girls do. And in many cases, the differences are minimal. This suggests that, overall, gender differences in average math performance are small and vary widely depending on the country context.

Similarly, researchers have found that within countries there is also large geographic variation in gender gaps in test scores. So clearly these gaps in mathematical ability do not seem to be fully determined by biological endowments. 22
Indeed, research looking at the PISA cross-country results suggests that improved social conditions for women are related to improved math performance by girls.23
Not only do statistical gaps in test scores vary substantially across societies – they also vary substantially across time. This suggests that social factors play a large role in explaining differences between the sexes.
In the US, for example, the gender gap in mathematics has narrowed in recent decades.24 And this narrowing took place as high school curricula of boys and girls became more similar. The following chart shows this: In the US boys in 1957 took far more math and science courses than did girls; but by 1992 there was virtual parity in almost all science and math courses.

More importantly for the question at hand, gender gaps in 'hard skills' are not large enough to explain the gender gaps in earnings. In their review of the evidence, Blau and Kahn (2017) concludes that gaps in test scores in the US are too small to explain much of the gender pay at any point in time.25
So, taken together, the evidence suggests that statistical gaps in maths test scores are both relatively small and heavily influenced by social and environmental factors.
“It’s about personality”
Biological differences in tastes (e.g. preferences for 'people' over 'things'), psychological attributes (e.g. 'risk aversion'), and soft skills (e.g. the ability to get along with others) are also often argued to be at the heart of the gender pay gap.
There are hundreds of studies trying to establish whether there are gender differences in preferences, personality traits, and 'soft skills'. The quality and general relevance (i.e. the internal and external validity) of these studies is the subject of much discussion, as illustrated in the recent debate that ensued from the Google Memo affair.
A recent article from the 'Heterodox Academy', which was produced specifically in the context of the Google Memo, provides a fantastic overview of the evidence on this topic and the key points of contention among scholars.
For the purpose of this blog post, let's focus on the review of the evidence presented in Blau and Kahn (2017) – their review is particularly helpful because they focus on gender differences in the context of labor markets.
Blau and Kahn point out that, yes, researchers have found statistical differences between men and women that are important in the context of labor-market outcomes. For example, studies have found statistical gender differences in 'people skills' (i.e. ability to listen, communicate, and relate to others). Similarly, experimental studies have found that women more often avoid salary negotiations, and they often show a particular predisposition to accept and receive requests for tasks with low promotability. But are the origins of these differences mainly biological or are they social? And are they strong enough to explain pay gaps?
The available evidence here suggests these factors can only explain a relatively small fraction of the observed differences in wages.26 And they are anyway far from being purely biological – preferences and skills are highly malleable and 'gendering' begins early in life.27
Here is a concrete example: Leibbrandt and List (2015) did an experiment in which they assessed how men and women reacted to job advertisements.28 They found that although men were more likely to negotiate than women when there was no explicit statement that wages were negotiable, the gender difference disappeared and even reversed when it was explicitly stated that wages were negotiable. This suggests that it is not as much about 'talent', as it is about norms and rules.
“A man should earn more than his wife”
The experiment in which researchers found that gender differences in negotiation attitudes disappeared when it was explicitly stated that wages were negotiable, emphasizes the important role that social norms and culture play in labor-market outcomes.
These concepts may seem abstract: What do social norms and culture actually look like in the context of the gender pay gap?
The reproduction of stereotypes through everyday positive enforcement can be seen in a range of aspects: A study analyzing 124 prime-time television programs in the US found that female characters continue to inhabit interpersonal roles with romance, family, and friends, while male characters enact work-related roles.29 In the realm of children’s books, a study of 5,618 books found that compared to females, males are represented nearly twice as often in titles and 1.6 times as often as central characters.30 Qualitative research shows that even in the home, parents are often enforcers of gender norms – especially when it comes to fathers endorsing masculinity in male children.31
Of particular relevance in the context of labor markets, social norms also often take the form of specific behavioral prescriptions such as "a man should earn more than his wife".
The following chart depicts the distribution of the share of the household income earned by the wife, across married couples in the US.
Consistent with the idea that "a man should earn more than his wife", the data shows a sharp drop at 0.5, the point where the wife starts to earn more than the husband.
Distribution of income share earned by the wife across married couples in the US – Bertrand, Kamenica, and Pan (2015)32
This is the result of two factors. First, it is about the matching of men and women before they marry – 'matches' in which the woman has higher earning potential are less common. Second, it is a result of choices after marriage – the researchers show that married women with higher earning potential than their husbands often stay out of the labor force, or take 'below-potential' jobs.33
The authors of the study from which this chart is taken explored the data in more detail and found that in couples where the wife earns more than the husband, the wife spends more time on household chores, so the gender gap in unpaid care work is even larger; and these couples are also less satisfied with their marriage and are more likely to divorce than couples where the wife earns less than the husband.
The empirical exploration in this study highlights the remarkable power that gender norms and identity have on labor-market outcomes.
Why do gender norms and identity matter?
Does it actually matter if social norms and culture are important determinants of gender roles and labor-market outcomes? Are social norms in our contemporary societies really less fixed than biological traits?
The available research suggests that the answers to these questions are yes and yes. There is evidence that social norms can be actively and rapidly changed.
Here is a concrete example: Jensen and Oster (2009) find that the introduction of cable television in India led to a significant decrease in the reported acceptability of domestic violence towards women and son preference, as well as increases in women’s autonomy and decreases in fertility.34
Of course, TV is a small aspect of all the big things that matter for social norms. But this study is important for the discussion because it is hard to study how social norms can be changed. TV introduction is a rare opportunity to see how a group that is exposed to a driver of social change actually changes.
As Jensen and Oster point out, most popular cable TV shows in India feature urban settings where lifestyles differ radically from those in rural areas. For example, many female characters on popular soap operas have more education, marry later, and have smaller families than most women in rural areas. And, similarly, many female characters in these tv shows are featured working outside the home as professionals, running businesses, or are shown in other positions of authority.
The bar chart below shows how cable access changed attitudes toward the self-reported preference for their child to be a son. As the authors note, "reported desire for the next child to be a son is relatively unchanged in areas with no change in cable status, but it decreases sharply between 2001 and 2002 for villages that get cable in 2002, and between 2002 and 2003 (but notably not between 2001 and 2002) for those that get cable in 2003. For both measures of attitudes, the changes are large and striking, and correspond closely to the timing of introduction of cable."
To conclude: The evidence suggests that biological differences are not a key driver of gender inequality in labor-market outcomes; while social norms and culture – which in turn affect preferences, behavior, and incentives to foster specific skills – are very important.
This matters for policy because social norms are not fixed – they can be influenced in a number of ways, including through intergenerational learning processes, exposure to alternative norms, and activism such as that which propelled the women's movement.35
How are women represented across jobs?
Representation of women at the top of the income distribution
Despite having fallen in recent decades, there remains a substantial pay gap between the average wages of men and women.
But what does gender inequality look like if we focus on the very top of the income distribution? Do we find any evidence of the so-called 'glass ceiling' preventing women from reaching the top? How did this change over time?
Answers to these questions are found in the work of Atkinson, Casarico and Voitchovsky (2018). Using tax records, they investigated the incomes of women and men separately across nine high-income countries. As such, they were restricted to those countries in which taxes are collected on an individual basis, rather than as couples.36
In addition to wages they also take into account income from investments and self-employment.
Whilst investment income tends to make up a larger share of the total income of rich individuals in general, the authors found this to be particularly marked in the case of women in top-income groups.
The two charts present the key figures from the study.
One chart shows the proportion of women out of all individuals falling into the top 10%, 1%, and 0.1% of the income distribution. The open circle represents the share of women in the top income brackets back in 2000; the closed circle shows the latest data, which is from 2013.
The other chart shows the data over time for individual countries. You can explore data for other countries using the 'Change country' button on the chart.

The two charts allow us to answer the initial questions:
- Women are greatly under-represented in top income groups – they make up much less than 50% across each of the nine countries. Within the top 1% women account for around 20% and there is surprisingly little variation across countries.
- The proportion of women is lower the higher you look up the income distribution. In the top 10% up to every third income-earner is a woman; in the top 0.1% only every fifth or tenth person is a woman.
- The trend is the same in all countries of this study: Women are now better represented in all top-income groups than they were in 2000.
- But improvements have generally been more limited at the very top. With the exception of Australia, we see a much smaller increase in the share of women amongst the top 0.1% than amongst the top 10%.
Overall, despite recent inroads, we continue to see remarkably few women making it to the top of the income distribution today.
Representation of women in management positions
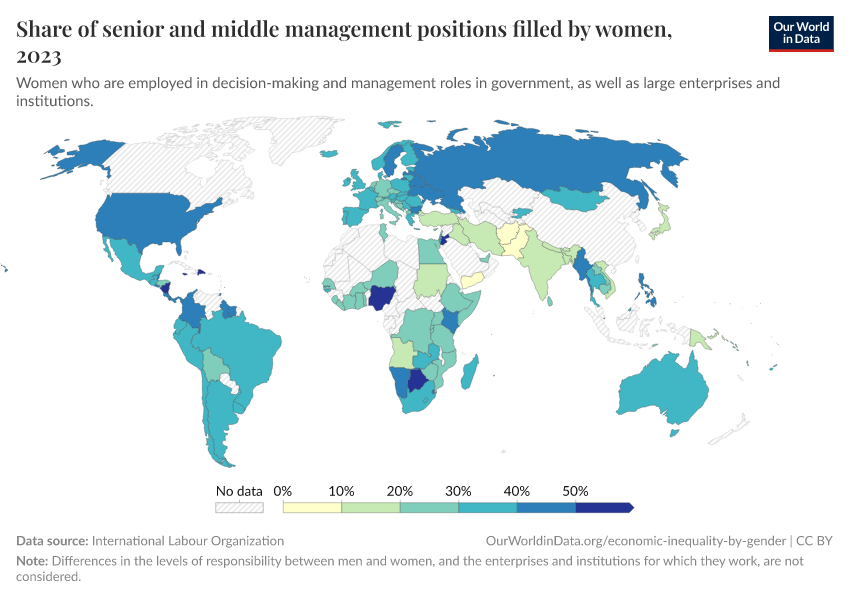
The chart here plots the proportion of women in senior and middle management positions around the world. It shows that women all over the world are underrepresented in high-profile jobs, which tend to be better paid.

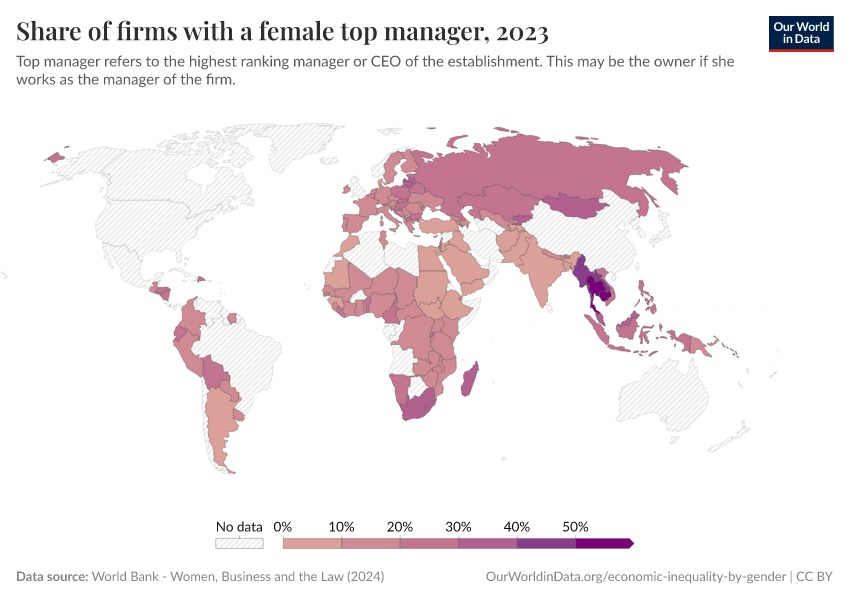
The next chart provides an alternative perspective on the same issue. Here we show the share of firms that have a woman as manager. We highlight world regions by default, but you can remove them and add specific countries.
As we can see, all over the world firms tend to be managed by men. And, globally, only about 18% of firms have a female manager.
Firms with female managers tend to be different to firms with male managers. For example, firms with female managers tend to also be firms with more female workers.

Representation of women in low-paying jobs
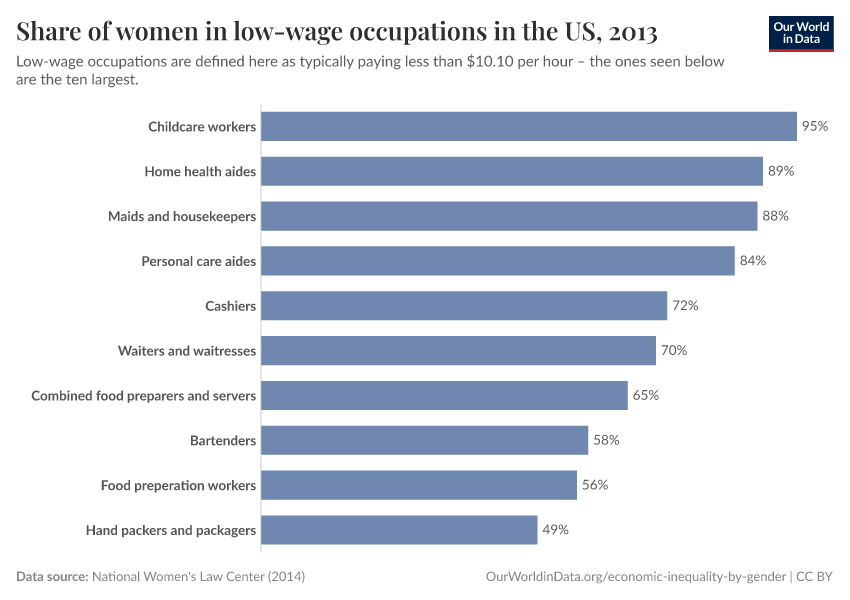
Above we show that women all over the world are underrepresented in high-profile jobs, which tend to be better paid. As it turns out, in many countries women are at the same time overrepresented in low-paying jobs.
This is shown in the chart here, where 'low-pay' refers to workers earning less than two-thirds of the median (i.e. the middle) of the earnings distribution.
A share above 50% implies that women are 'overrepresented', in the sense that among those with low wages, there are more women than men.

The fact that women in rich countries are overrepresented in the bottom of the income distribution goes together with the fact that working women in these countries are overrepresented in low-paying occupations. The chart shows this for the US.

How much control do women have over household resources?
Women often have no control over their personal earned income
The next chart plots cross-country estimates of the share of women who are not involved in decisions about their own income. The line shows national averages, while the dots show averages for rich and poor households (i.e. averages for women in households within the top and bottom quintiles of the corresponding national income distribution).
As we can see, in many countries, particularly in Sub-Saharan Africa and Asia, a large fraction of women are not involved in household decisions about spending their personal earned income. And this pattern is stronger among low-income households within low-income countries.
Percentage of women not involved in decisions about their own income – World Development Report (2012)38
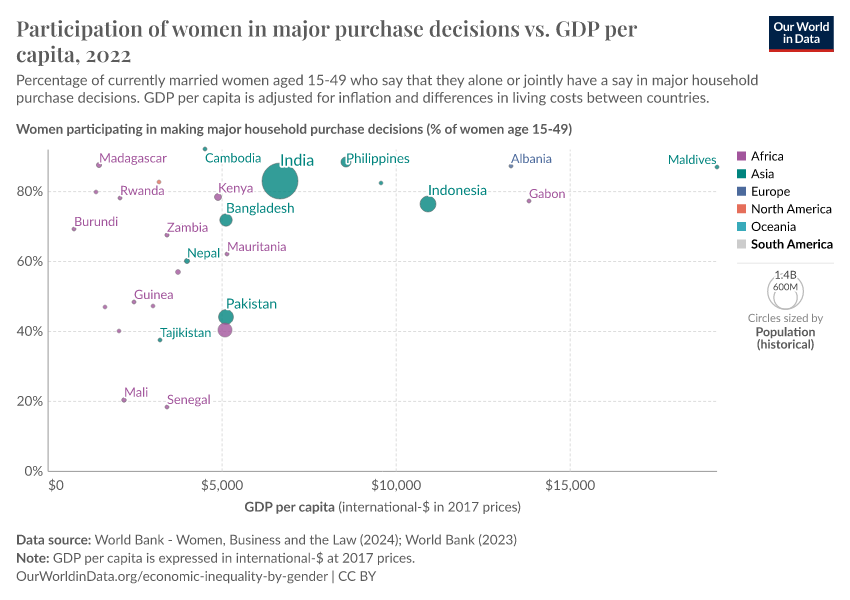
In many countries, women have limited influence over important household decisions
Above we focus on whether women get to choose how their own personal income is spent. Now we look at women's influence over total household income.
In this chart, we plot the share of currently married women who report having a say in major household purchase decisions, against national GDP per capita.
We see that in many countries, notably in Sub-Saharan Africa and Asia, an important number of women have limited influence over major spending decisions.

The chart above shows that women’s control over household spending tends to be greater in richer countries. In the next chart, we show that this correlation also holds within countries: Women’s control is greater in wealthier households. Household wealth is shown by the quintile in the wealth distribution on the x-axis – the poorest households are in the lowest quintiles (Q1) on the left.
There are many factors at play here, and it's important to bear in mind that this correlation partly captures the fact that richer households enjoy greater discretionary income beyond levels required to cover basic expenditure, while at the same time, in richer households women often have greater agency via access to broader networks as well as higher personal assets and incomes.
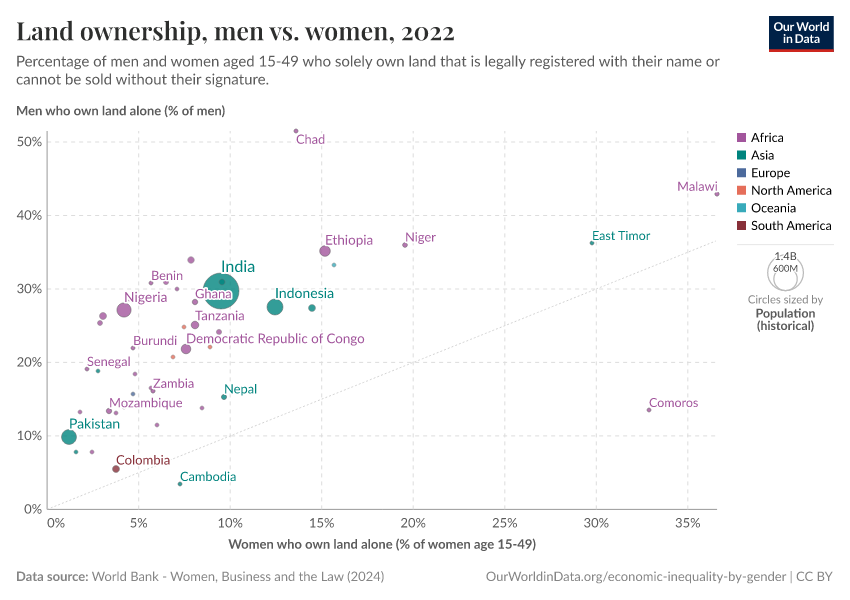
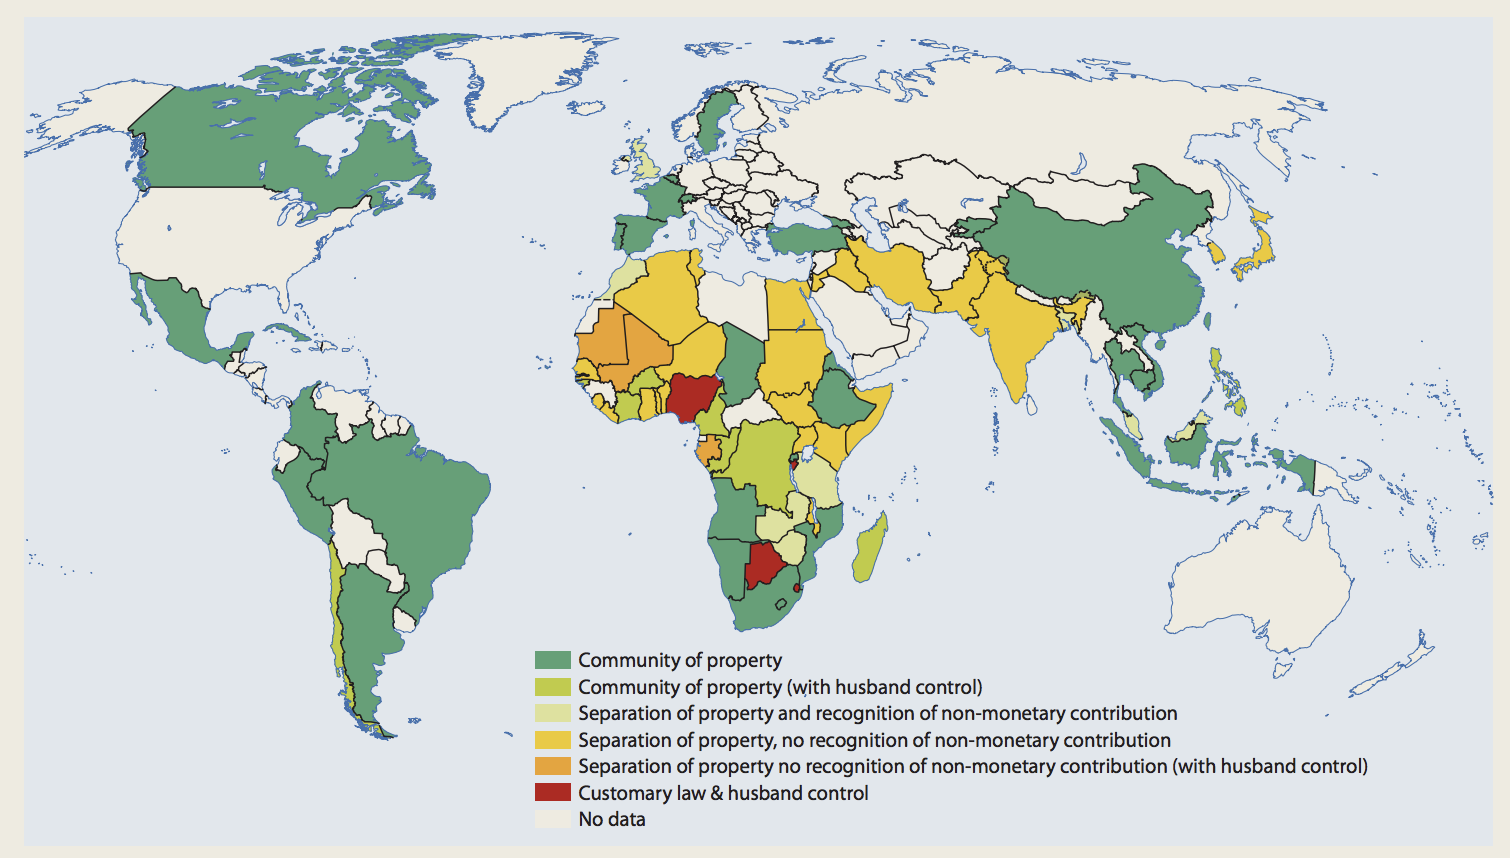
Land ownership is more often in the hands of men
Economic inequalities between men and women manifest themselves not only in terms of wages earned but also in terms of assets owned. For example, as the chart shows, in nearly all low and middle-income countries with data, men are more likely to own land than women.
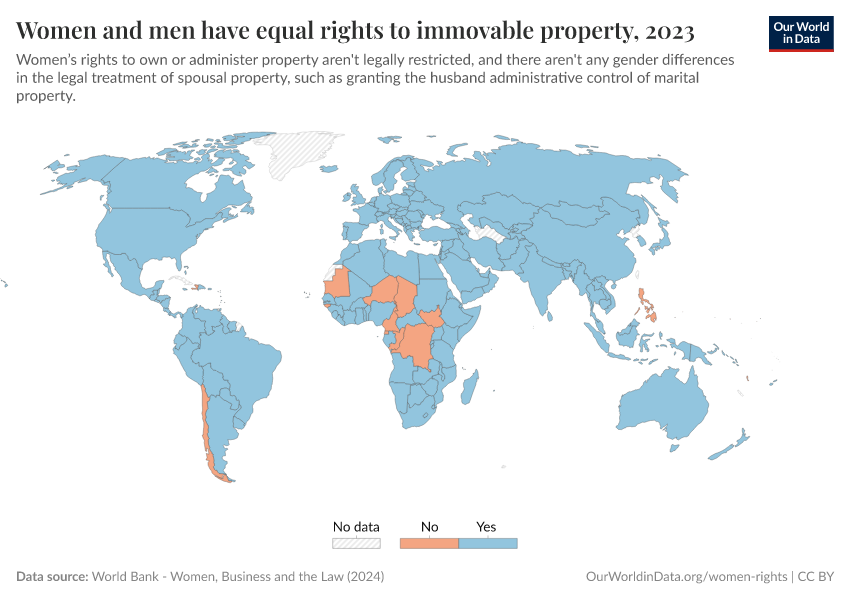
Women's lack of control over important household assets, such as land, can be a critical problem in case of divorce or the husband’s death.

Closely related to the issue of land ownership is the fact that in several countries women do not have the same rights to property as men. These countries are highlighted in the map.39

Gender-equal inheritance systems have been adopted in most, but not all countries
Inheritance is one of the main mechanisms for the accumulation of assets. In the map, we provide an overview of the countries that do and do not have gender-equal inheritance systems.
If you move the slider to 1920, you will see that while gender-equal inheritance systems were very rare in the early 20th century, today they are much more common. And still, despite the progress achieved, in many countries, notably in North Africa and the Middle East, women and girls still have fewer inheritance rights than men and boys.

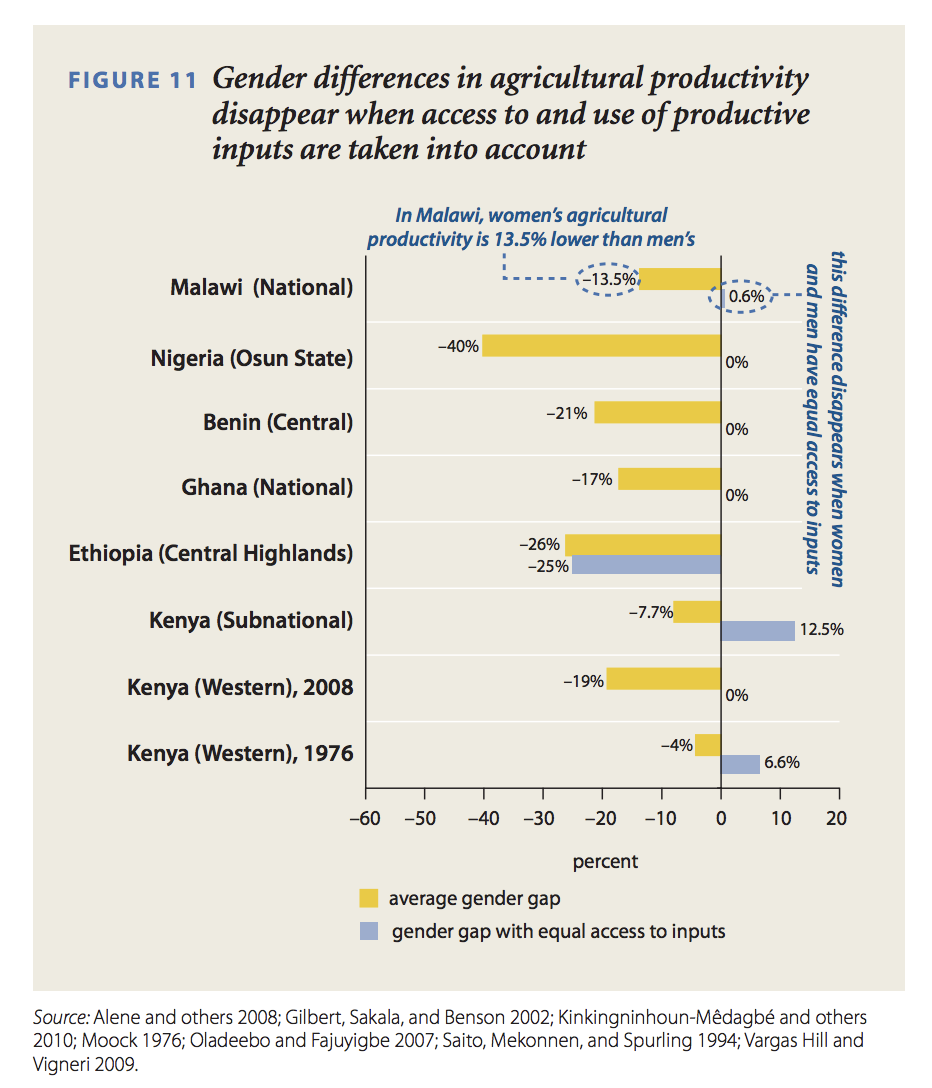
Gender differences in access to productive inputs are often large
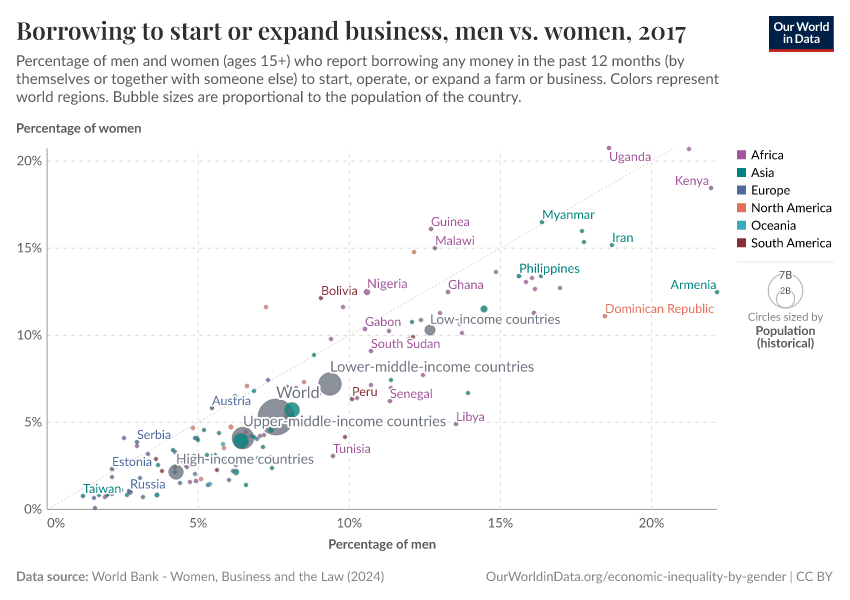
Above we show that there are large gender gaps in land ownership across low-income countries. Here we show that there are also large gaps in terms of access to borrowed capital.
The chart shows the percentage of men and women who report borrowing any money in the past 12 months to start, operate, or expand a farm or business.
As we can see, almost everywhere, including in many rich countries, women are less likely to obtain borrowed capital for productive purposes.
This can have large knock-on effects: in agriculture and entrepreneurship, gender differences in access to productive inputs, including land and credit, can lead to gaps in earnings via lower productivity.
Indeed, studies have found that, when statistical gender differences in agricultural productivity exist, they often disappear when access to and use of productive inputs are taken into account.40

Key Charts on Economic Inequality by Gender
See all charts on this topic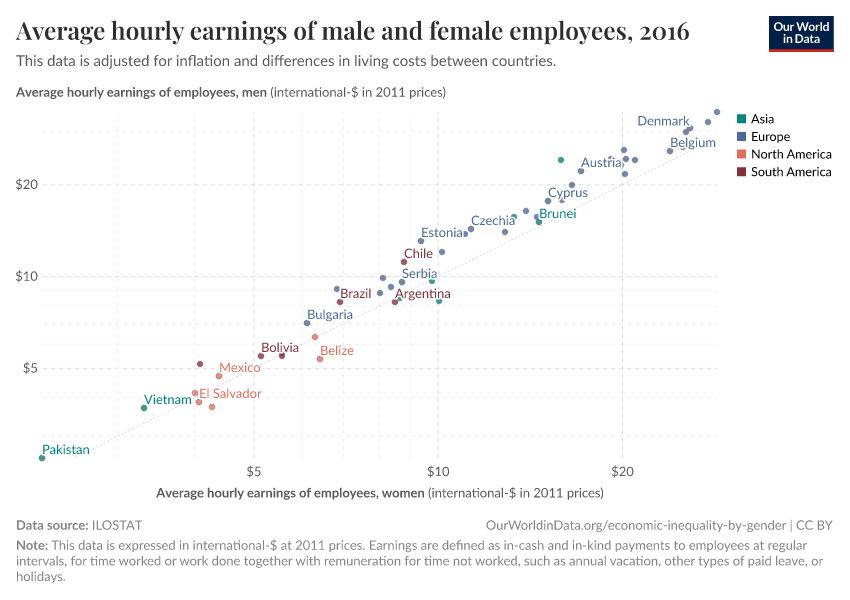


Featured Data on Economic Inequality by Gender
Acknowledgements
We thank Sandra Tzvetkova and Diana Beltekian for their great research assistance.
Endnotes
There are some exceptions to this definition. In particular, sometimes self-employed workers, or part-time workers are excluded.
This measure can also be negative. This means that, on an hourly basis, men earn on average less than women. It is the case for some countries, such as Malaysia.
Olivetti, C., & Petrongolo, B. (2008). Unequal pay or unequal employment? A cross-country analysis of gender gaps. Journal of Labor Economics, 26(4), 621-654.
Blau, Francine D., and Lawrence M. Kahn. 2017. "The Gender Wage Gap: Extent, Trends, and Explanations." Journal of Economic Literature, 55(3): 789-865.
For each specification, Blau and Kahn (2017) perform regression analyses on data from the PSID (the Michigan Panel Study of Income Dynamics), which includes information on labor-market experience and considers men and women ages 25-64 who were full-time, non-farm, wage and salary workers.
In 2010, unionization and education show negative values; this reflects the fact that women have surpassed men in educational attainment, and unionization in the US has been in general decline with a greater effect on men.
The full source is: World Development Report (2012) Gender Equality and Development, World Bank.
Goldin, C. (2014). A grand gender convergence: Its last chapter. The American Economic Review, 104(4), 1091-1119.
Goldin, C., & Katz, L. F. (2016). A most egalitarian profession: pharmacy and the evolution of a family-friendly occupation. Journal of Labor Economics, 34(3), 705-746.
Lundborg, P., Plug, E., & Rasmussen, A. W. (2017). Can Women Have Children and a Career? IV Evidence from IVF Treatments. American Economic Review, 107(6), 1611-1637.
Blau, Francine D., and Lawrence M. Kahn. 2017. "The Gender Wage Gap: Extent, Trends, and Explanations." Journal of Economic Literature, 55(3): 789-865
Goldin, C. (1988). Marriage bars: Discrimination against married women workers, 1920's to 1950's.
The data in this map, which comes from the World Bank's World Development Indicators, provides a measure of whether there are any specific jobs that women are not allowed to perform. So, for example, a country might be coded as "No" if women are only allowed to work in certain jobs within the mining industry, such as health care professionals within mines, but not as miners.
Goldin, C., & Rouse, C. (2000). Orchestrating impartiality: The impact of" blind" auditions on female musicians. American Economic Review, 90(4), 715-741.
Blau and Kahn (2017) provide a whole list of experimental studies that have found labor-market discrimination. Another early example is from Neumark et al. (1996), who look at discrimination in restaurants. In this case, male and female pseudo-job-seekers were given similar CVs to apply for jobs waiting on tables at the same set of restaurants in Philadelphia. The results showed discrimination against women in high-priced restaurants.
The full reference of this study is Neumark, D., Bank, R. J., & Van Nort, K. D. (1996). Sex discrimination in restaurant hiring: An audit study. The Quarterly Journal of Economics, 111(3), 915-941.
Waldfogel, J. (1998). Understanding the "family gap" in pay for women with children. The Journal of Economic Perspectives, 12(1), 137-156.
Olivetti, C., & Petrongolo, B. (2017). The economic consequences of family policies: lessons from a century of legislation in high-income countries. The Journal of Economic Perspectives, 31(1), 205-230.
Goldin, C. (2014). A grand gender convergence: Its last chapter. The American Economic Review, 104(4), 1091-1119.
As we show above, in several nations, such as Sweden and Denmark, a “motherhood penalty” in earnings exists, even though these nations have generous family policies, including paid family leave and subsidized child care.
For a discussion of this mechanism, see page 814, Blau, Francine D., and Lawrence M. Kahn. 2017. The Gender Wage Gap: Extent, Trends, and Explanations. Journal of Economic Literature, 55(3): 789-865.
Hard skills are abilities that can be defined and measured, such as writing, reading, or doing maths. By contrast, soft skills are less tangible and harder to measure and quantify.
For more on this see Pope, D. G., & Sydnor, J. R. (2010). Geographic variation in the gender differences in test scores. Journal of Economic Perspectives, 24(2), 95-108.
Guiso, L., Monte, F., Sapienza, P., & Zingales, L. (2008). Culture, gender, and math. SCIENCE-NEW YORK THEN WASHINGTON-, 320(5880), 1164.
A number of papers have documented the narrowing of gender gaps in test scores. See, for example, Hyde, J. S., Lindberg, S. M., Linn, M. C., Ellis, A. B., & Williams, C. C. (2008). Gender similarities characterize math performance. Science, 321(5888), 494-495.
Blau, Francine D., and Lawrence M. Kahn. 2017. The Gender Wage Gap: Extent, Trends, and Explanations. Journal of Economic Literature, 55(3): 789-865.
Blau and Kahn write: "While findings such as those in table 7 ['Selected Studies Assessing the Role of Psychological Traits in Accounting for the Gender Pay Gap'] are informative in elucidating some of the possible omitted factors that lie behind gender differences in wages as well as the unexplained gap in traditional wage regressions, in general, the results suggest that these factors do not account for a large portion of either the raw or unexplained gender gap."
For a discussion of 'gendering' see West, C., & Zimmerman, D. H. (1987). Doing gender. Gender & Society, 1(2), 125-151.
Leibbrandt, A., & List, J. A. (2014). Do women avoid salary negotiations? Evidence from a large-scale natural field experiment. Management Science, 61(9), 2016-2024.
Lauzen, M. M., Dozier, D. M., & Horan, N. (2008). Constructing gender stereotypes through social roles in prime-time television. Journal of Broadcasting & Electronic Media, 52(2), 200-214.
McCabe, J., Fairchild, E., Grauerholz, L., Pescosolido, B. A., & Tope, D. (2011). Gender in twentieth-century children’s books: Patterns of disparity in titles and central characters. Gender & Society, 25(2), 197-226.
Kane, E. W. (2006). “No way my boys are going to be like that!” Parents’ responses to children’s gender nonconformity. Gender & Society, 20(2), 149-176.
Bertrand, M., Kamenica, E., & Pan, J. (2015). Gender identity and relative income within households. The Quarterly Journal of Economics, 130(2), 571-614.
More precisely, the authors find that in couples where the wife’s potential income is likely to exceed her husband’s (based on the income that would be predicted for her observed characteristics), the wife is less likely to be in the labor force, and if she does work, her income is lower than predicted.
Jensen, R., & Oster, E. (2009). The power of TV: Cable television and women's status in India. In The Quarterly Journal of Economics, 124(3), 1057-1094.
Regarding intergenerational transmission of gender roles, see Fernández, R. (2013). Cultural change as learning: The evolution of female labor force participation over a century. The American Economic Review, 103(1), 472-500.
For a discussion regarding social activism and its link to the determinants of female labor supply, see for example this study by Heer and Grossbard-Shechtman (1981).
Atkinson, A.B., Casarico, A. & Voitchovsky, S. Top incomes and the gender divide. J Econ Inequal (2018) 16: 225.
The authors produced results for 8 countries, and included earlier results for Sweden from Boschini, A., Gunnarsson, K., Roine, J.: Women in Top Incomes: Evidence from Sweden 1974-2013, IZA Discussion paper 10979, August (2017).
World Bank. (2011). World development report 2012: gender equality and development. World Bank Publications.
The map from The World Development Report (2012) provides a more fine-grained overview of different property regimes operating in different countries.
For more discussion of the evidence see page 20 in World Bank (2011) World Development Report 2012: Gender Equality and Development. World Bank Publications.
Cite this work
Our articles and data visualizations rely on work from many different people and organizations. When citing this topic page, please also cite the underlying data sources. This topic page can be cited as:
Esteban Ortiz-Ospina, Joe Hasell, and Max Roser (2019) - “Economic Inequality by Gender” Published online at OurWorldinData.org. Retrieved from: 'https://ourworldindata.org/economic-inequality-by-gender' [Online Resource]BibTeX citation
@article{owid-economic-inequality-by-gender,
    author = {Esteban Ortiz-Ospina and Joe Hasell and Max Roser},
    title = {Economic Inequality by Gender},
    journal = {Our World in Data},
    year = {2019},
    note = {https://ourworldindata.org/economic-inequality-by-gender}
}
Reuse this work freely
All visualizations, data, and articles produced by Our World in Data are completely open access under the Creative Commons BY license. You have the permission to use, distribute, and reproduce these in any medium, provided the source and authors are credited.
The data produced by third parties and made available by Our World in Data is subject to the license terms from the original third-party authors. We will always indicate the original source of the data in our documentation, so you should always check the license of any such third-party data before use and redistribution.
All of our charts can be embedded in any site.