Interactive visualization requires JavaScript
Related research and data
Charts
- Annual global plastic use
- Annual plastic waste by disposal method
- Beach litter
- Cumulative displaced plastic waste as a result of Chinese import ban
- Cumulative global production of plastics
- Cumulative plastic exports by top ten exporters
- Cumulative recycled plastic export value by top ten exporters
- Decomposition rates of marine debris
- Environmental impacts of different types of grocery bags
- Global plastic production with projections
- Global plastics production
- Global primary plastic production by industrial sector
- Global primary plastic production by polymer
- Global primary plastic waste generation by polymer
- Global share of plastic waste by disposal method with projectionsGeyer et al. (2017)
- Greenhouse gas emissions from plastic by life-cycle stage
- Greenhouse gas emissions from plastics
- Grocery bag comparisons for greenhouse gas emissions
- How much plastic waste did China import?
- Macroplastics in the surface ocean
- Mean product lifetime of plastic uses
- Microplastics in the surface ocean
- Mismanaged plastic waste
- Mismanaged plastic waste per capita
- Mismanaged plastic waste per capita vs. GDP per capita
- Per capita plastic waste exports and imports by income group
- Per capita plastic waste vs. GDP per capita
- Plastic exports to China by top 10 exporting countries
- Plastic pollution versus plastic waste generation per person
- Plastic waste accumulated in aquatic environments
- Plastic waste accumulated in rivers and lakes
- Plastic waste accumulated in the oceans
- Plastic waste by disposal method with projectionsOECD
- Plastic waste emitted to the ocean
- Plastic waste emitted to the ocean per capita
- Plastic waste emitted to the ocean per capita vs. GDP per capita
- Plastic waste generation
- Plastic waste generation by industrial sector
- Plastic waste generation by region and industrial sector
- Plastic waste generation by region and polymer
- Plastic waste generation per capita
- Plastic waste per capita imports vs. exports
- Plastics collected in the Great Pacific Garbage Patch
- Probability of mismanaged plastic waste being emitted to the ocean
- Projections of plastic waste by disposal method
- Rivers that contribute the most to ocean plastic pollution
- Share of cumulative plastic exports by top ten exporters
- Share of global mismanaged plastic waste
- Share of global plastic waste emitted to the ocean
- Share of global plastic waste imports
- Share of plastic waste exports
- Share of plastic waste that is incinerated
- Share of plastic waste that is mismanaged
- Share of plastic waste that is recycled
- Share of plastic waste that is recycled, landfilled, incinerated and mismanaged
- Share of plastic waste that is sent to landfill
- Surface plastic mass across the world's oceans
- Surface plastic particles across the world's oceans
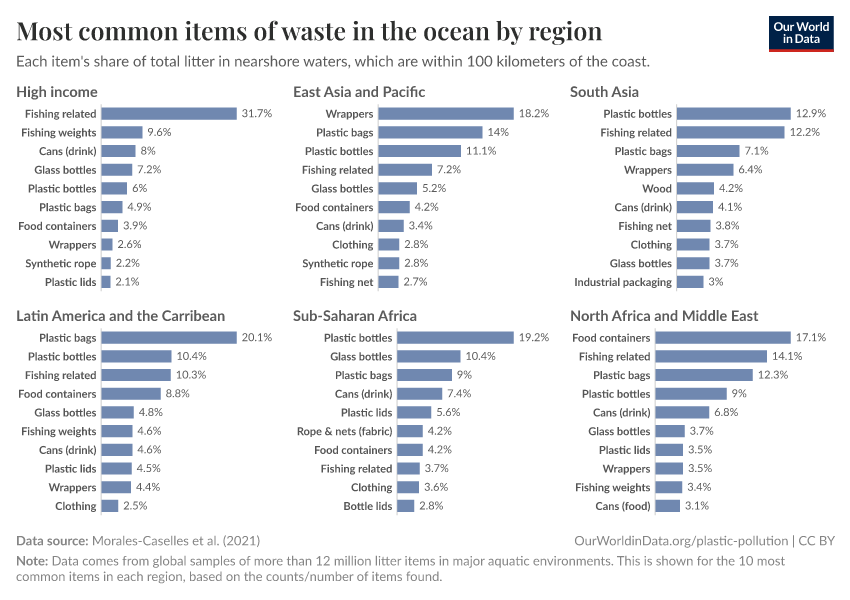
- What are the most common items of waste found in rivers and oceans?
- What items of waste do we find in rivers and the ocean?