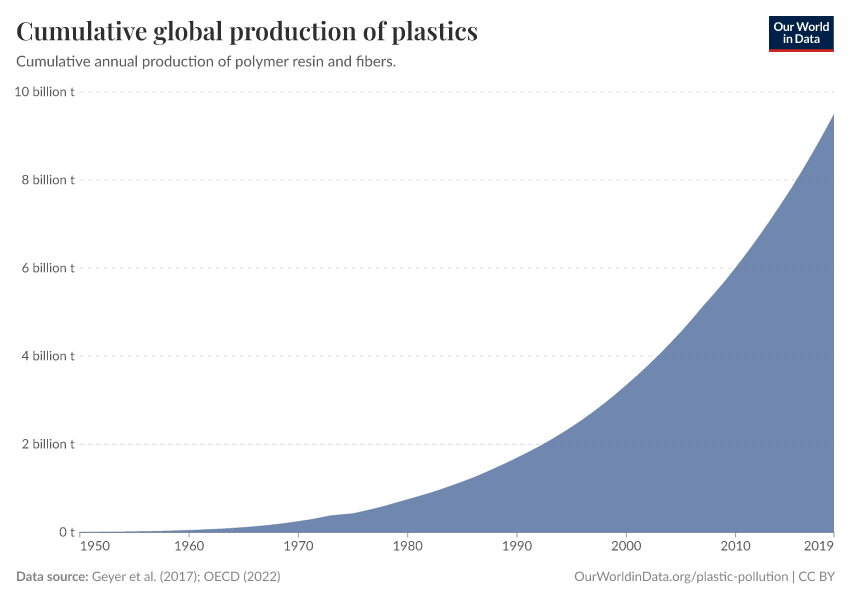
Cumulative global production of plastics

What you should know about this indicator
What you should know about this indicator
Sources and processing
This data is based on the following sources
How we process data at Our World in Data
All data and visualizations on Our World in Data rely on data sourced from one or several original data providers. Preparing this original data involves several processing steps. Depending on the data, this can include standardizing country names and world region definitions, converting units, calculating derived indicators such as per capita measures, as well as adding or adapting metadata such as the name or the description given to an indicator.
At the link below you can find a detailed description of the structure of our data pipeline, including links to all the code used to prepare data across Our World in Data.
Notes on our processing step for this indicator
The data on plastic production from 1950 to 2015 are based on the research by Greyer et al., published in 2017. For the years 2016 to 2018, the figures were projected by applying a consistent annual growth rate of 5%, which aligns with the growth estimates provided by Geyer. The most recent data for the year 2019 has been directly sourced from the OECD Global Plastics Outlook, released in 2022.
Reuse this work
- All data produced by third-party providers and made available by Our World in Data are subject to the license terms from the original providers. Our work would not be possible without the data providers we rely on, so we ask you to always cite them appropriately (see below). This is crucial to allow data providers to continue doing their work, enhancing, maintaining and updating valuable data.
- All data, visualizations, and code produced by Our World in Data are completely open access under the Creative Commons BY license. You have the permission to use, distribute, and reproduce these in any medium, provided the source and authors are credited.
Citations
How to cite this page
To cite this page overall, including any descriptions, FAQs or explanations of the data authored by Our World in Data, please use the following citation:
“Data Page: Cumulative global production of plastics”, part of the following publication: Hannah Ritchie, Veronika Samborska, and Max Roser (2023) - “Plastic Pollution”. Data adapted from Geyer et al., OECD. Retrieved from https://archive.ourworldindata.org/20251023-195030/grapher/cumulative-global-plastics.html [online resource] (archived on October 23, 2025).How to cite this data
In-line citationIf you have limited space (e.g. in data visualizations), you can use this abbreviated in-line citation:
Geyer et al. (2017); OECD (2022) – with major processing by Our World in DataFull citation
Geyer et al. (2017); OECD (2022) – with major processing by Our World in Data. “Cumulative global production of plastics” [dataset]. Geyer et al., “Production, use, and fate of all plastics ever made”; OECD, “Global Plastics Outlook - Plastics use by application” [original data]. Retrieved February 21, 2026 from https://archive.ourworldindata.org/20251023-195030/grapher/cumulative-global-plastics.html (archived on October 23, 2025).