Economic Inequality
How are incomes and wealth distributed between people? Both within countries and across the world as a whole?
On this page, you can find all our data, visualizations, and writing relating to economic inequality.
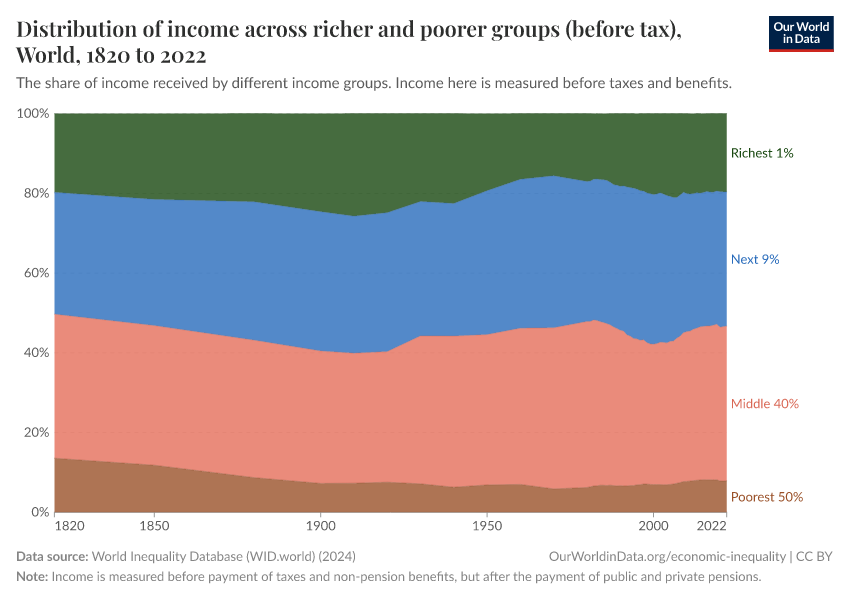
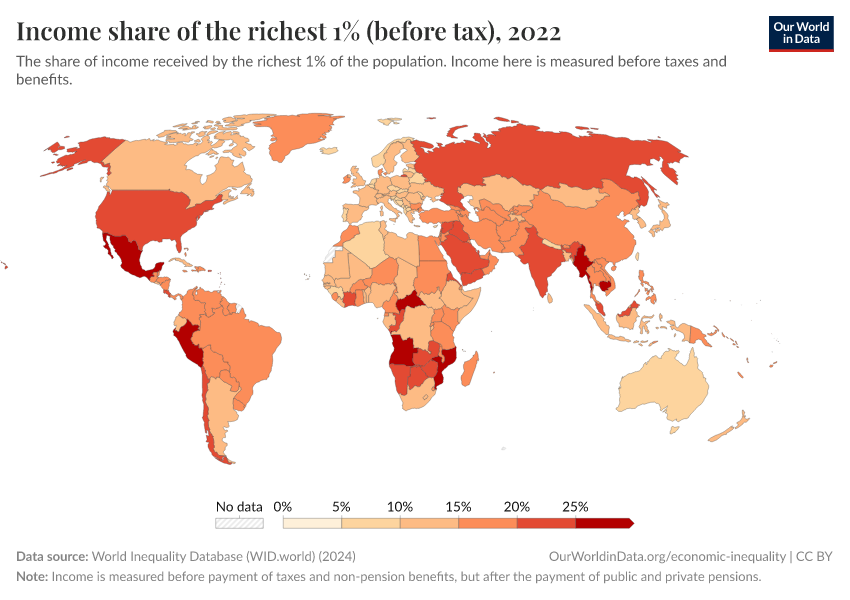
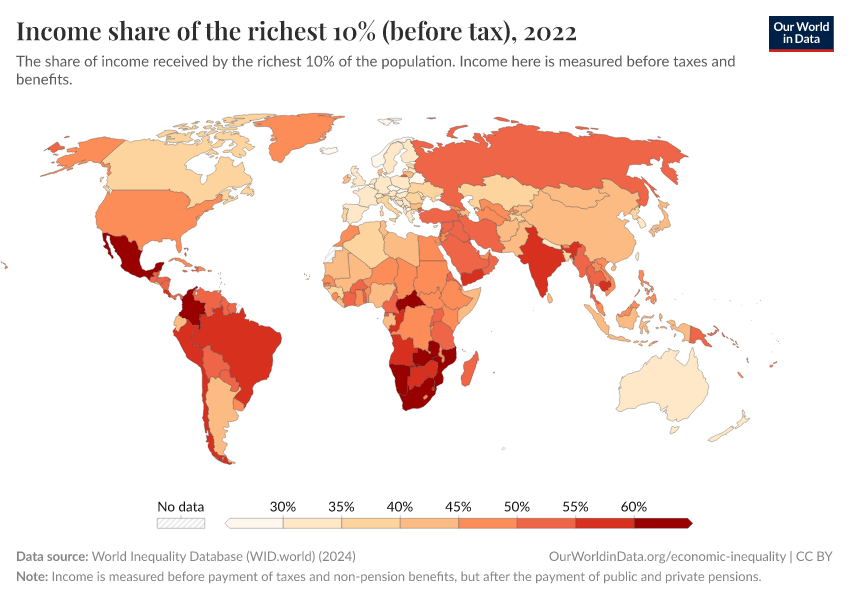
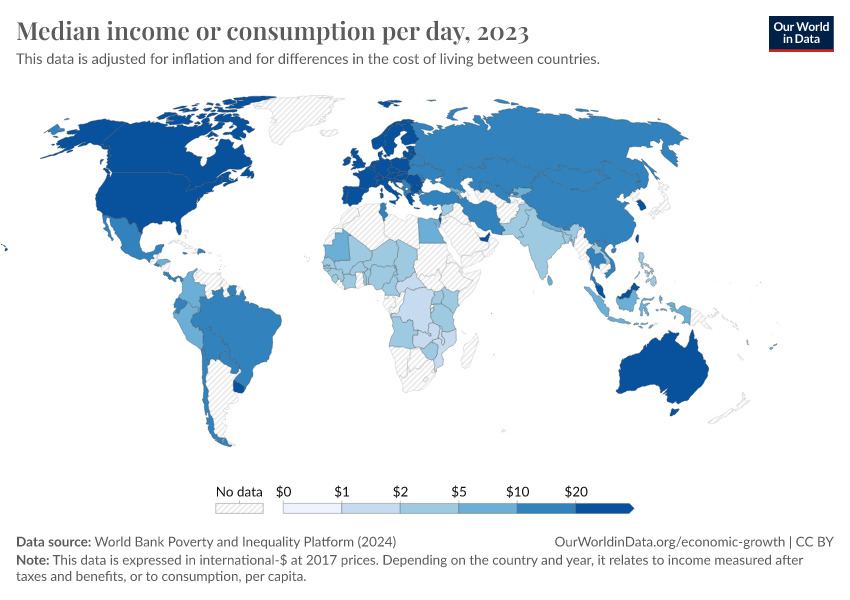
This evidence shows us that inequality in many countries is very high and, in many cases, has been on the rise. Global economic inequality is vast and compounded by overlapping inequalities in health, education, and many other dimensions.
But economic inequality is not rising everywhere. Within many countries, it has fallen or remained stable. And global inequality – after two centuries of increase – is now falling too.
The large differences we see across countries and over time are crucial. They show us that high and rising inequality is not inevitable, and that the extent of inequality today is something that we can change.
Explore Data on Economic Inequality
About this data
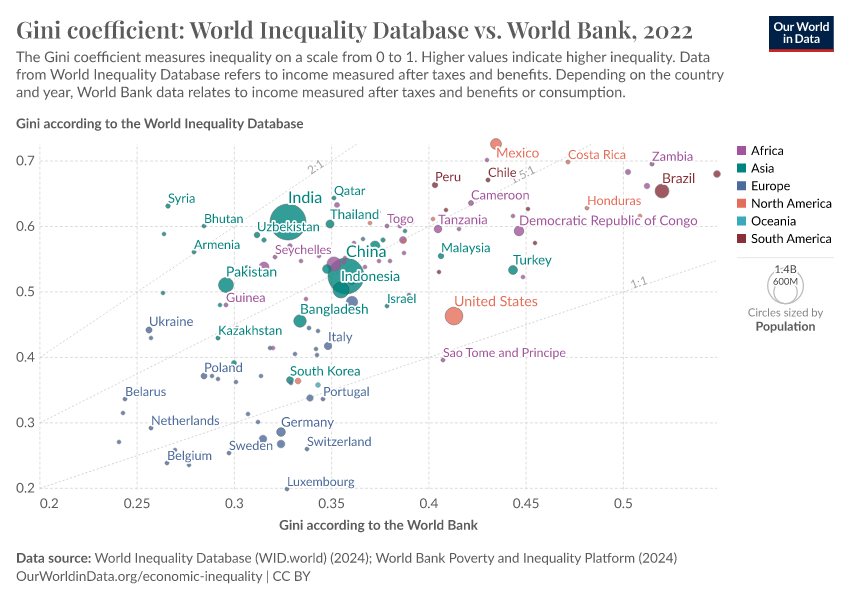
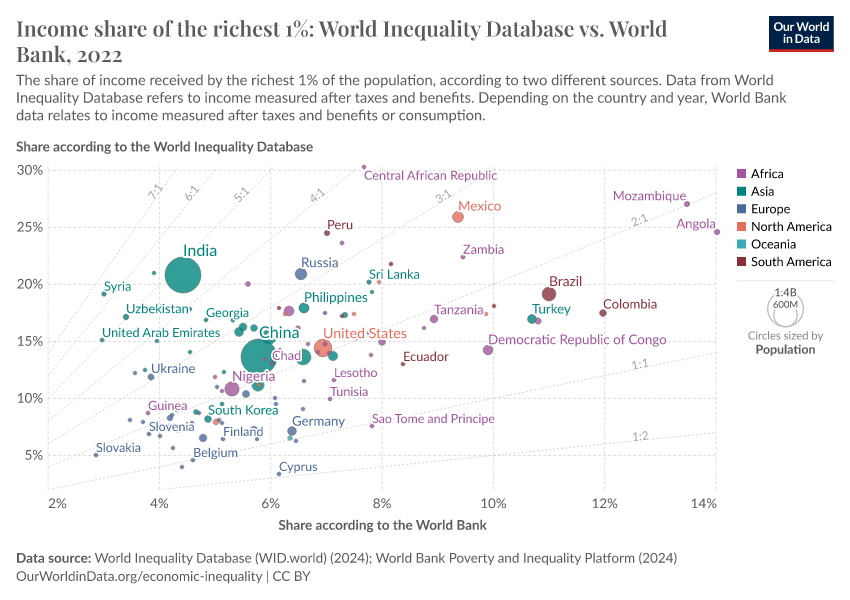
This data explorer provides a range of inequality indicators measured according to two different definitions of income obtained from different sources.
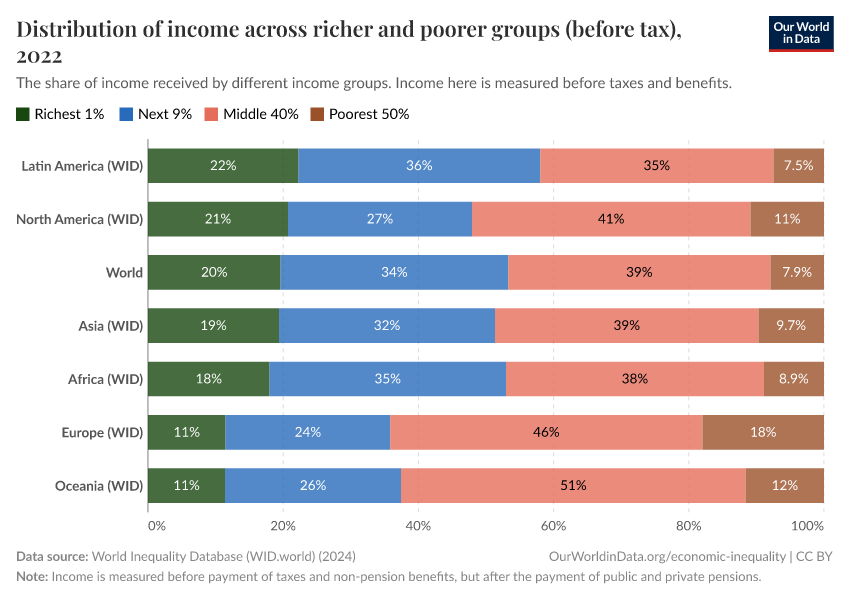
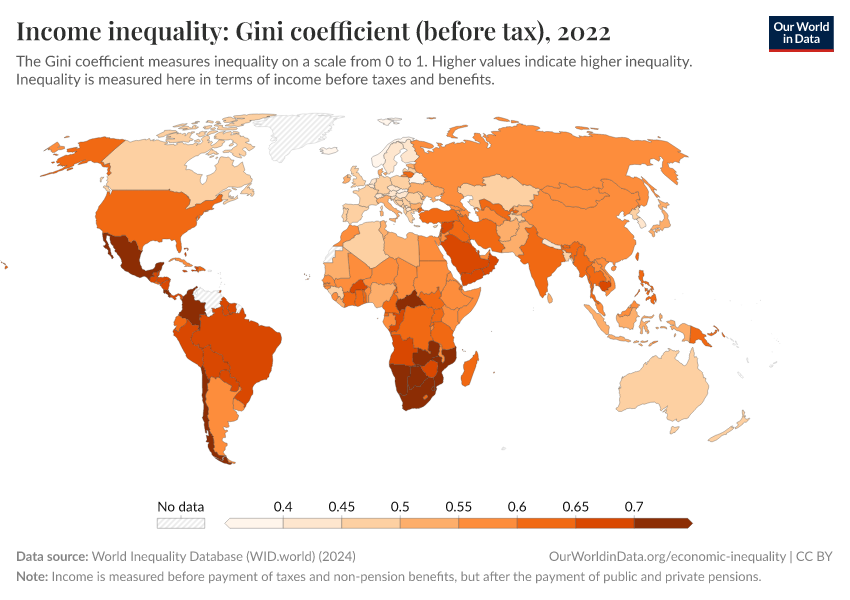
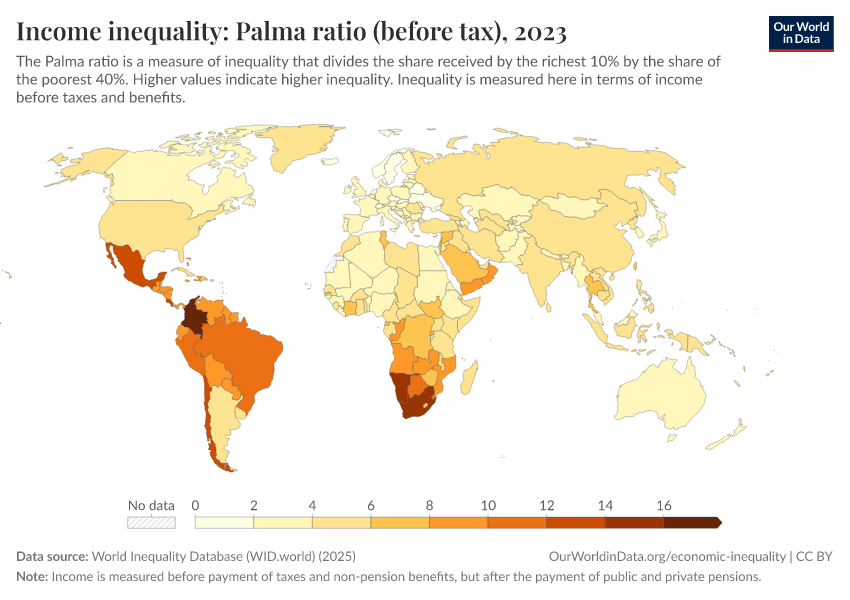
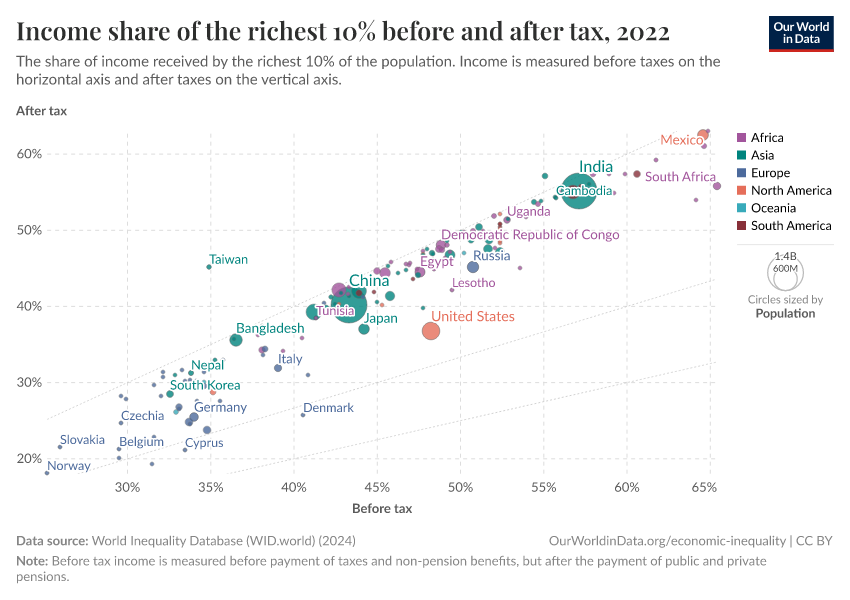
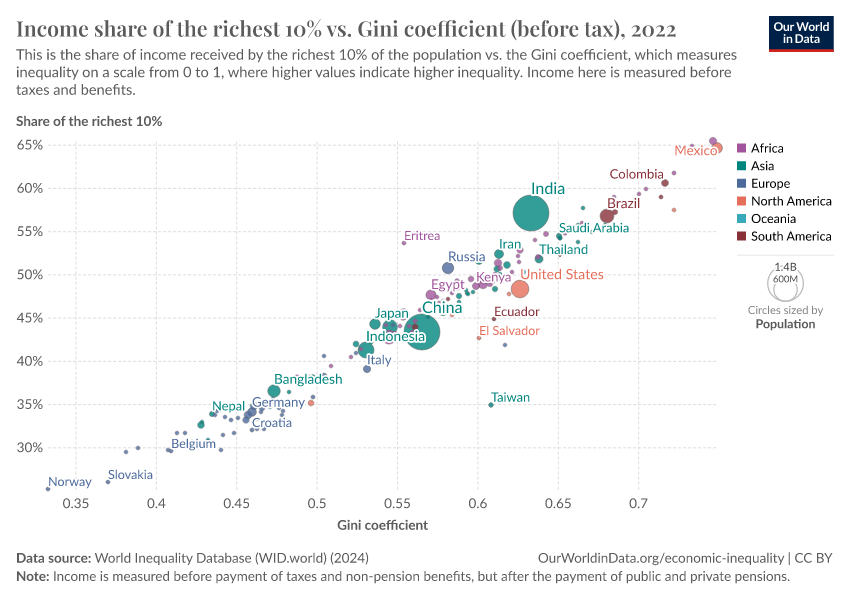
- Data from the World Inequality Database relates to inequality before taxes and benefits.
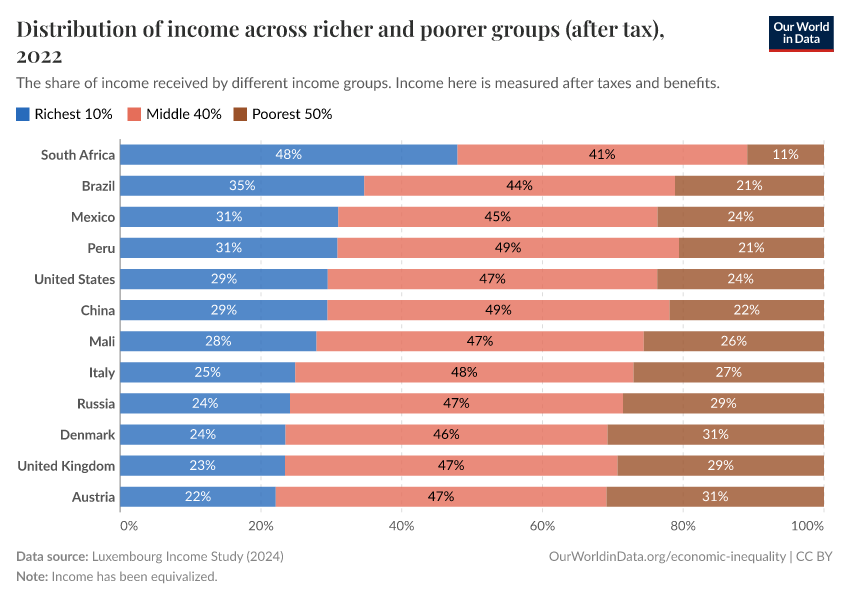
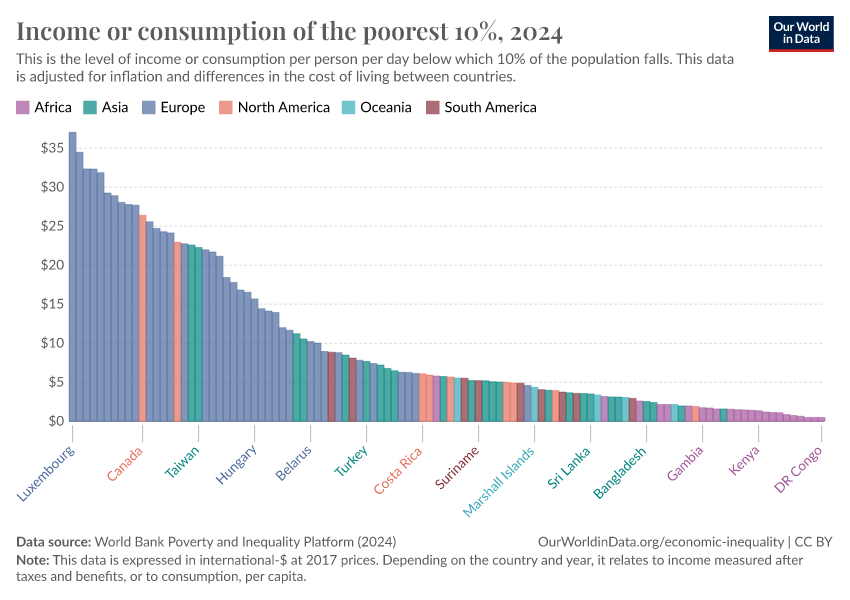
- Data from the World Bank relates to either income after taxes and benefits or consumption, depending on the country and year.
Further information about the definitions and methods behind this data can be found in the article below, where you can also explore and compare a much broader range of indicators from different sources:
Research & Writing
July 6, 2023
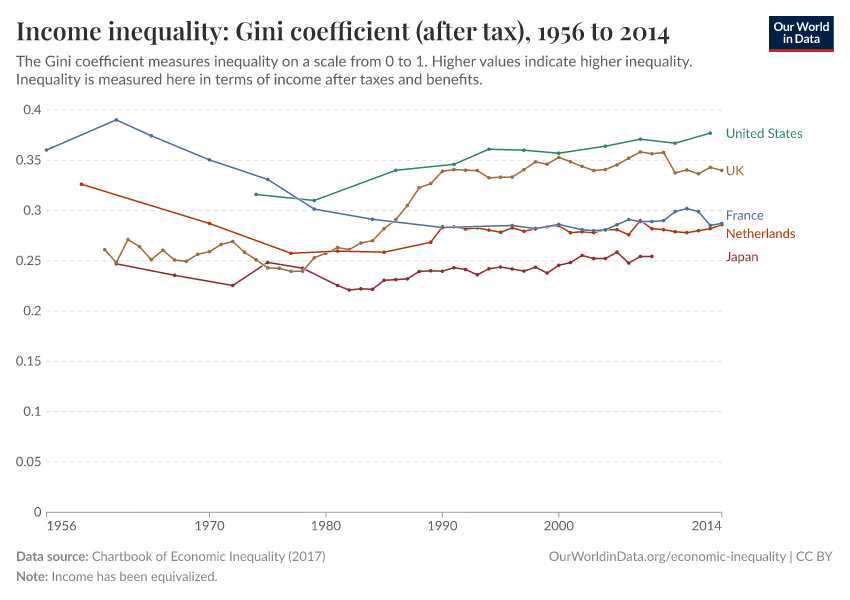
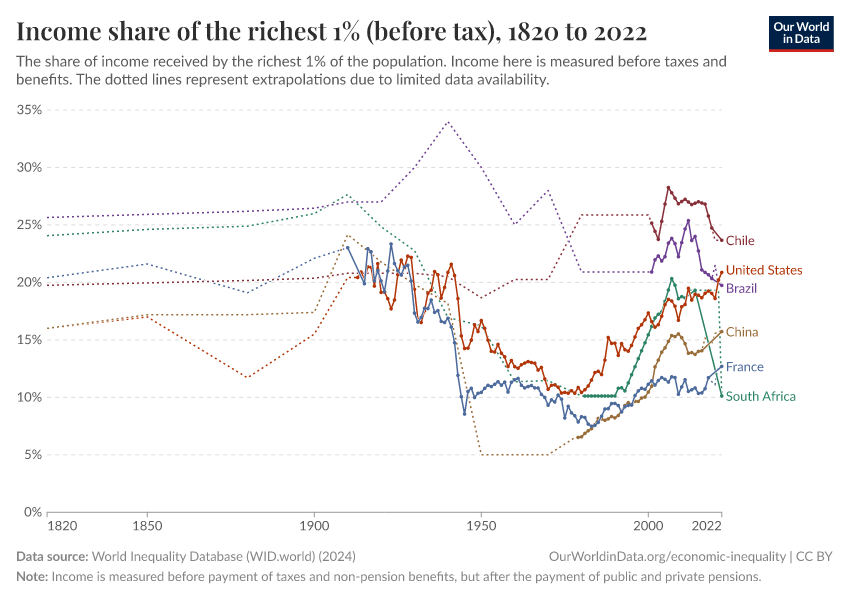
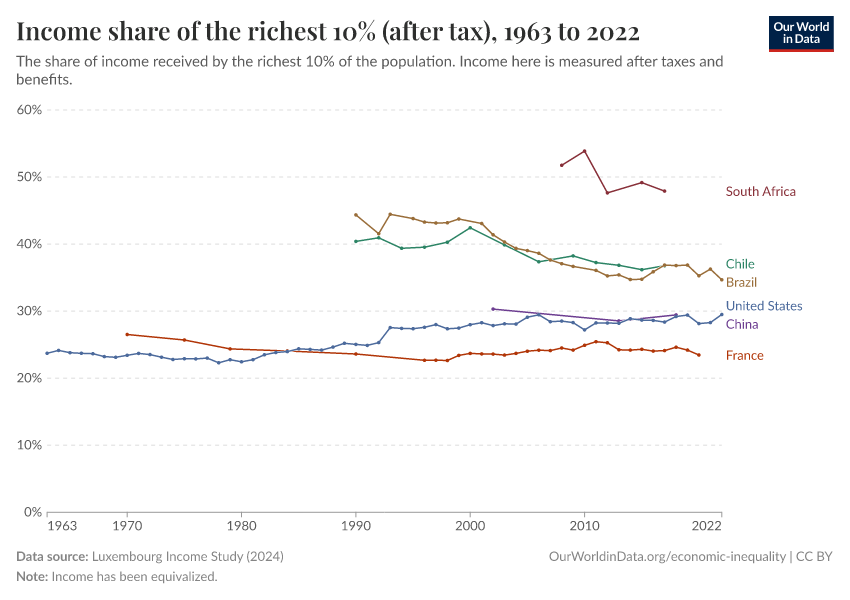
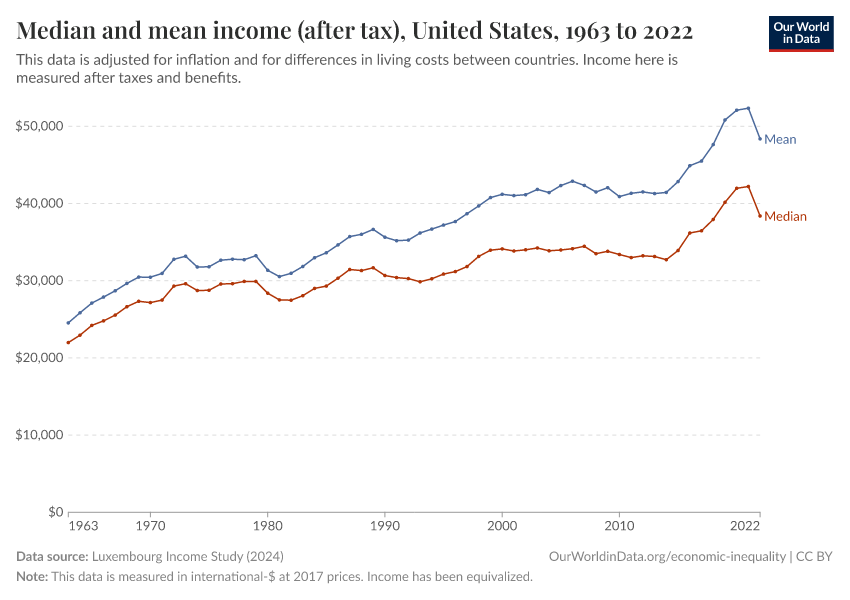
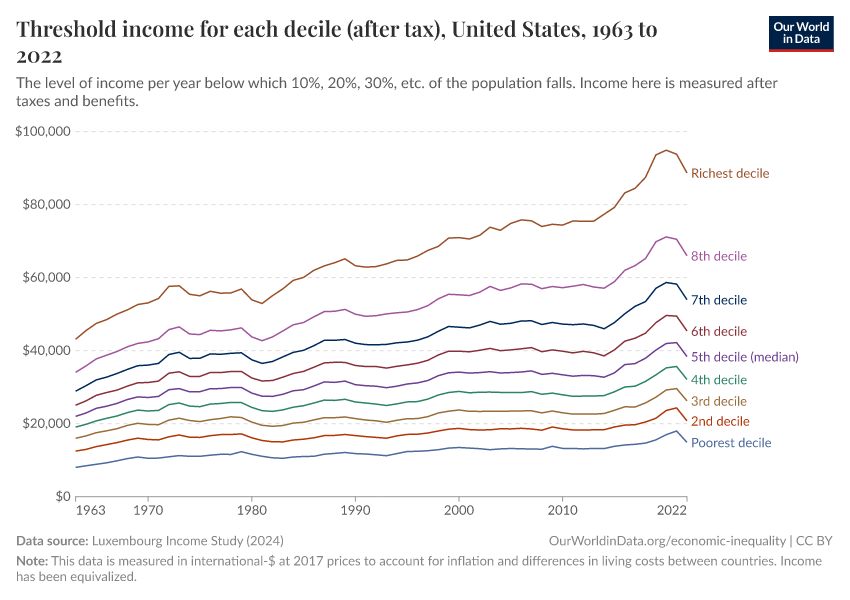
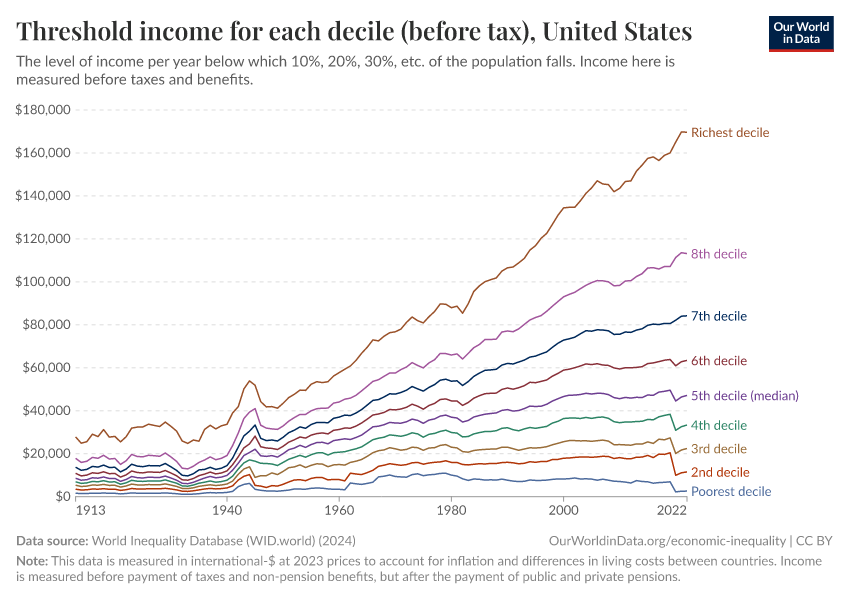
How has income inequality within countries evolved over the past century?
While the steep rise of inequality in the United States is well-known, long-run data on the incomes of the richest shows countries have followed a variety of trajectories.
August 25, 2025
Global inequality is huge — but so is the opportunity for people in high-income countries to support poor people
People in high-income countries could dramatically improve lives worldwide with minimal financial commitment, yet few do.
July 3, 2023
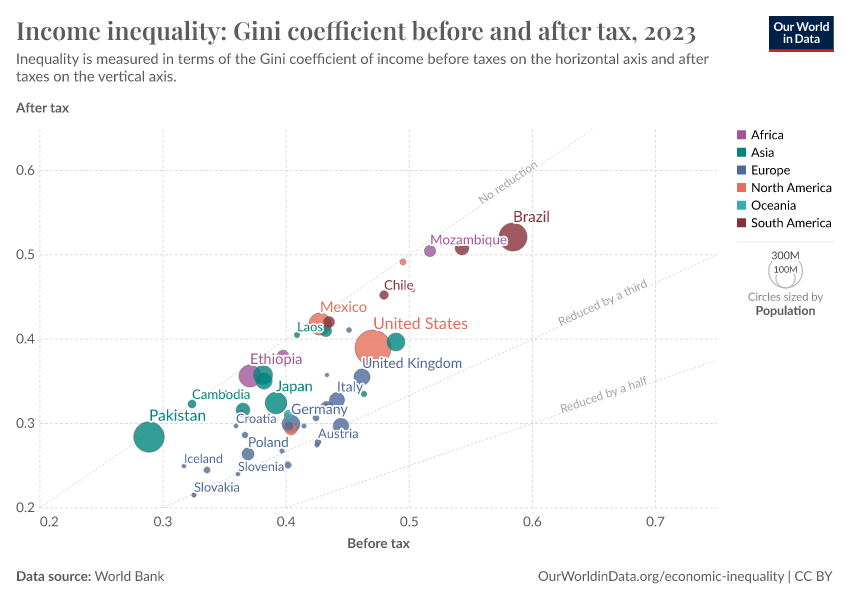
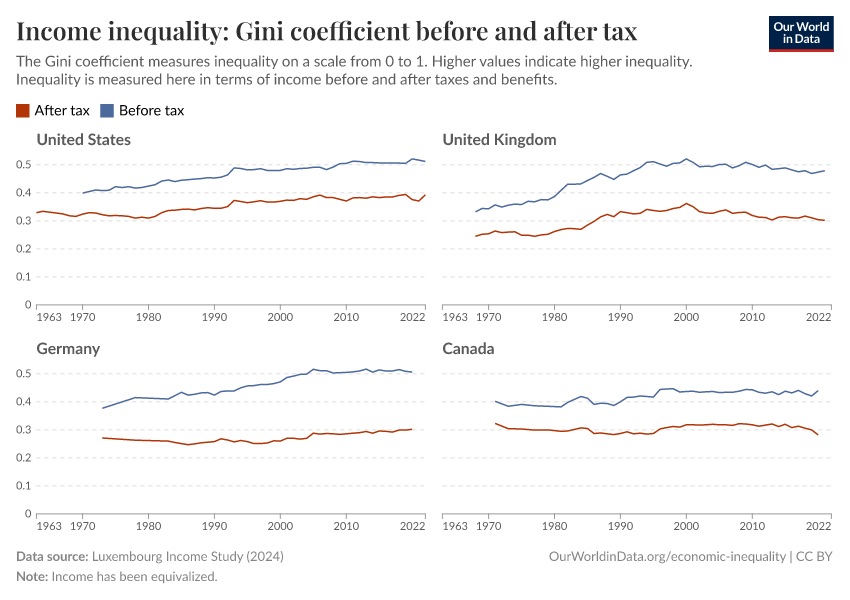
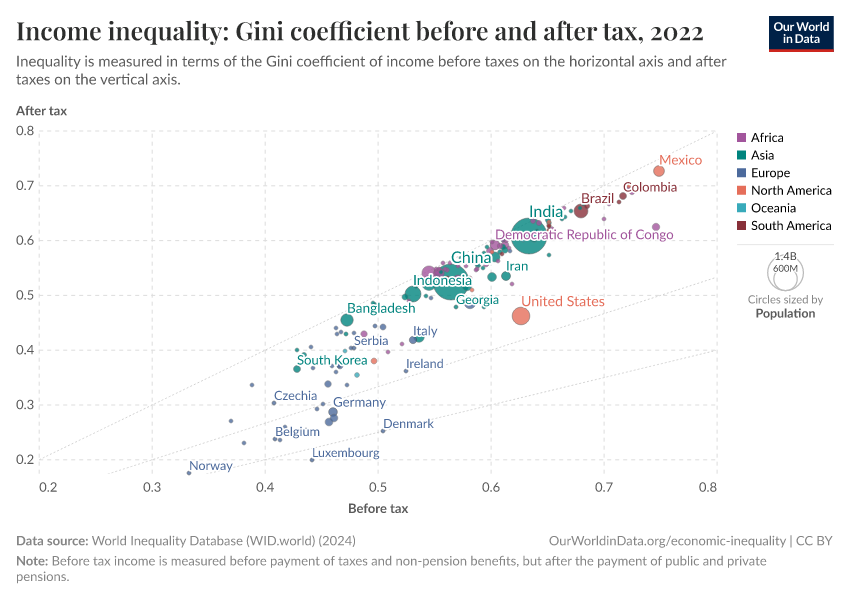
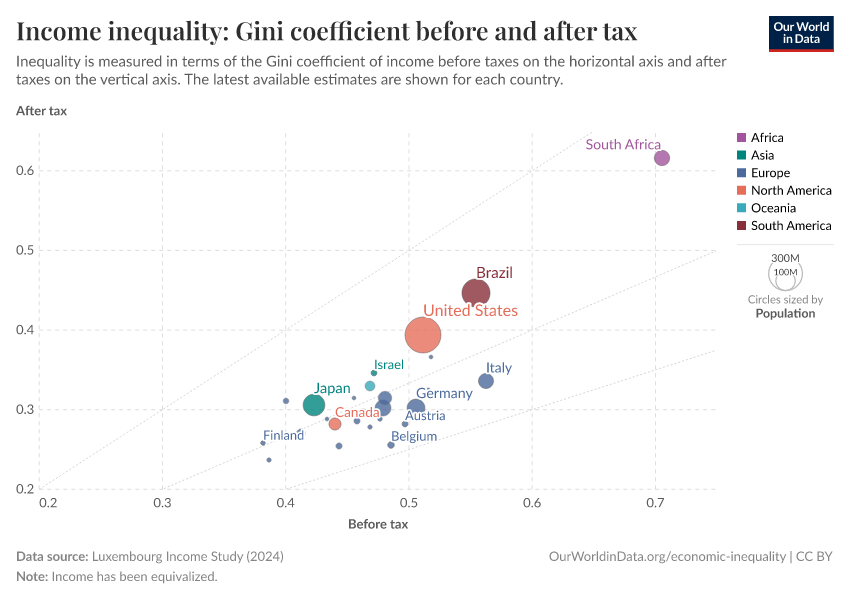
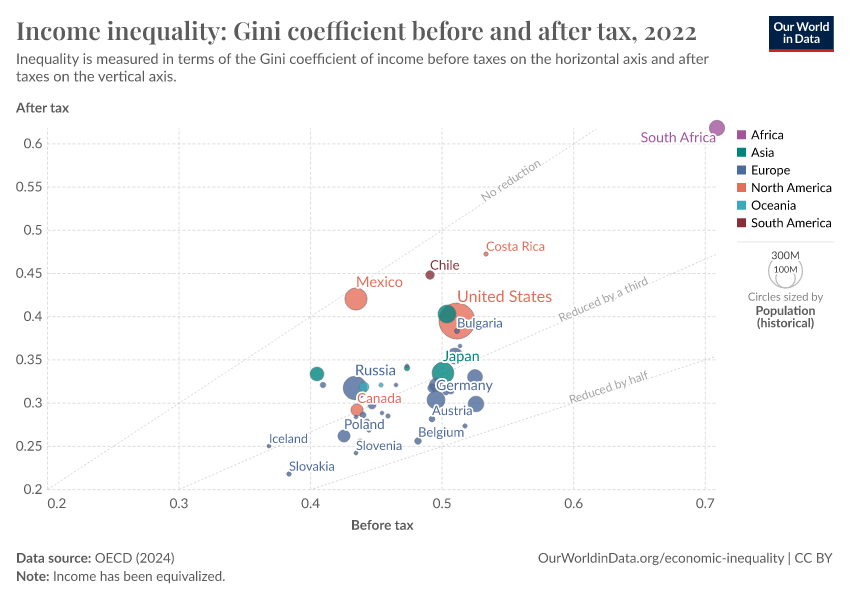
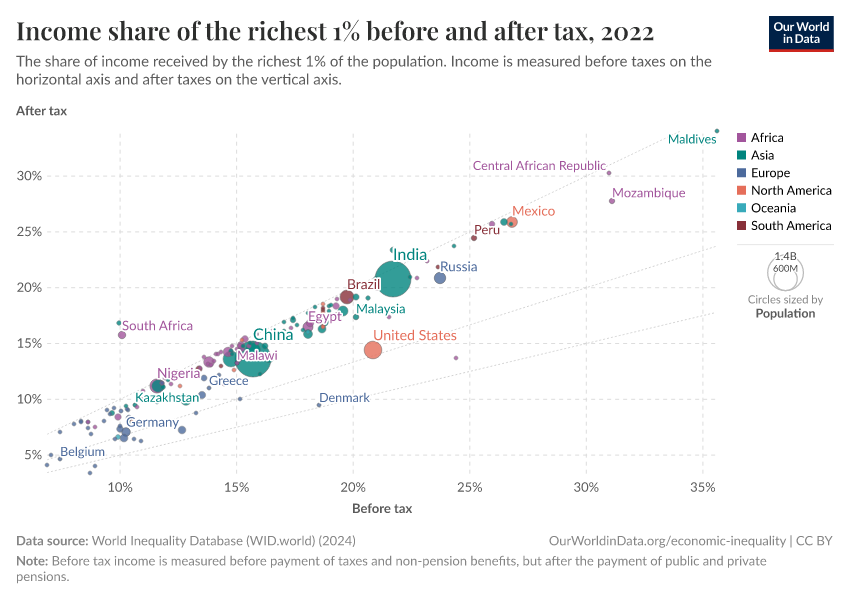
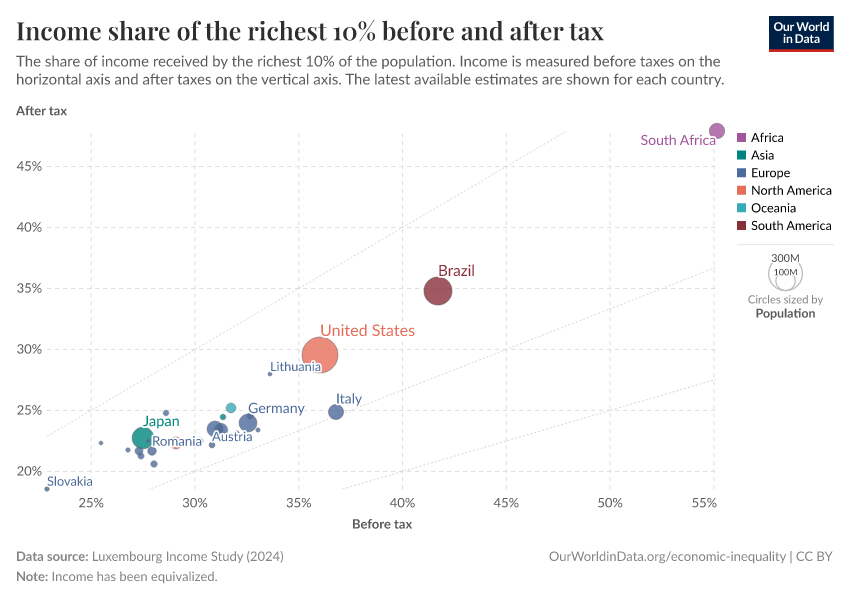
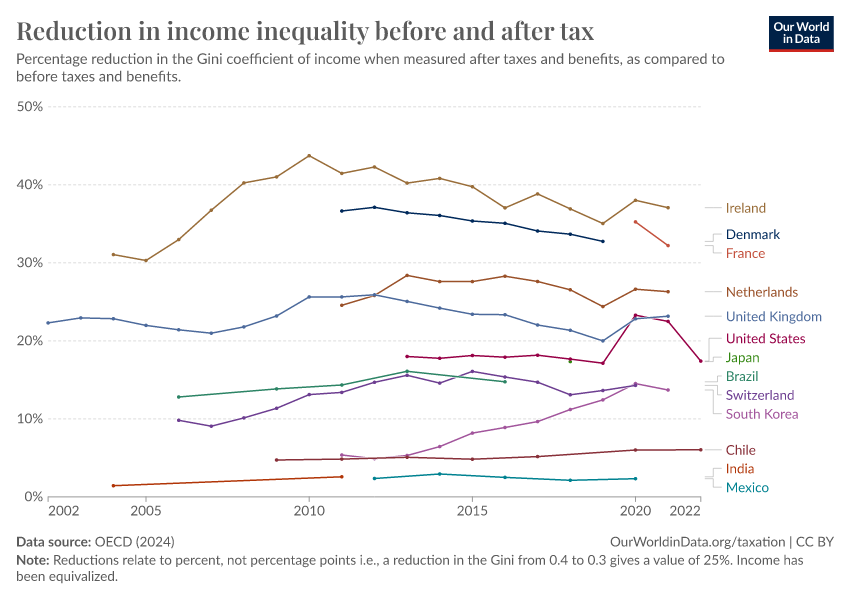
Income inequality before and after taxes: how much do countries redistribute income?
The redistribution of income achieved by governments through taxes and benefits varies hugely.
Income Inequality Over the Long-run
Global Inequality
Key Charts on Economic Inequality
See all charts on this topic


Featured Data on Economic Inequality
Cite this work
Our articles and data visualizations rely on work from many different people and organizations. When citing this topic page, please also cite the underlying data sources. This topic page can be cited as:
Joe Hasell, Bertha Rohenkohl, Pablo Arriagada, Esteban Ortiz-Ospina, and Max Roser (2023) - “Economic Inequality” Published online at OurWorldinData.org. Retrieved from: 'https://ourworldindata.org/economic-inequality' [Online Resource]BibTeX citation
@article{owid-economic-inequality,
    author = {Joe Hasell and Bertha Rohenkohl and Pablo Arriagada and Esteban Ortiz-Ospina and Max Roser},
    title = {Economic Inequality},
    journal = {Our World in Data},
    year = {2023},
    note = {https://ourworldindata.org/economic-inequality}
}
Reuse this work freely
All visualizations, data, and articles produced by Our World in Data are completely open access under the Creative Commons BY license. You have the permission to use, distribute, and reproduce these in any medium, provided the source and authors are credited.
The data produced by third parties and made available by Our World in Data is subject to the license terms from the original third-party authors. We will always indicate the original source of the data in our documentation, so you should always check the license of any such third-party data before use and redistribution.
All of our charts can be embedded in any site.