Artificial Intelligence
Artificial intelligence (AI) systems already greatly impact our lives — they increasingly shape what we see, believe, and do. Based on the steady advances in AI technology and the significant recent increases in investment, we should expect AI technology to become even more powerful and impactful in the following years and decades.
It is easy to underestimate how much the world can change within a lifetime, so it is worth taking seriously what those who work on AI expect for the future. Many AI experts believe there is a real chance that human-level artificial intelligence will be developed within the following decades, and some think it will exist much sooner.
How such powerful AI systems are built and used will be very important for the future of our world and our own lives. All technologies have positive and negative consequences, but with AI, the range of these consequences is extraordinarily large: the technology has immense potential for good. Still, it comes with significant downsides and high risks.
A technology with such an enormous impact needs to be of central interest to people across our entire society. However, currently, the question of how this technology will be developed and used is left to a small group of entrepreneurs and engineers.
With our publications on artificial intelligence, we want to help change this status quo and support a broader societal engagement.
On this page, you will find charts of AI-related metrics, articles, and key insights to help you better understand what is happening and where we might be heading. We hope that this work will be helpful for the growing and necessary public conversation on AI.
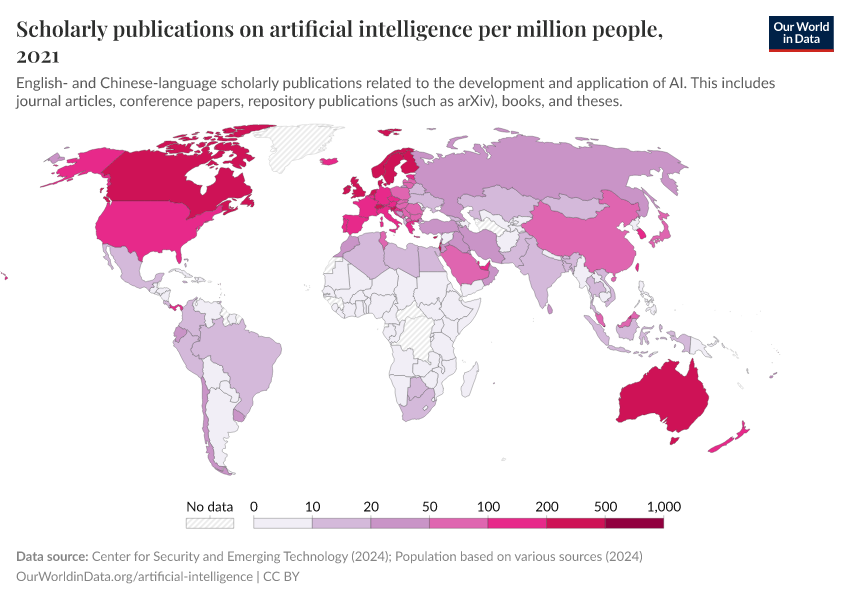
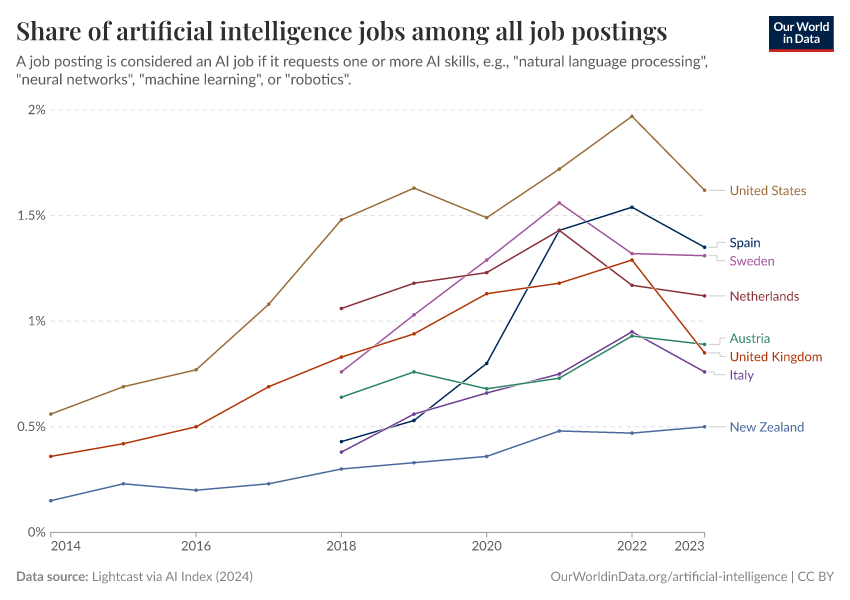
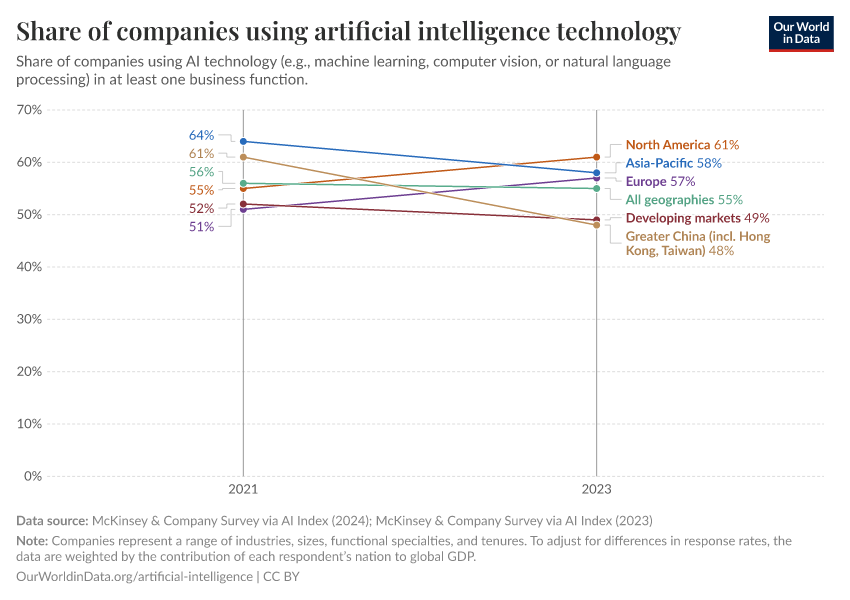
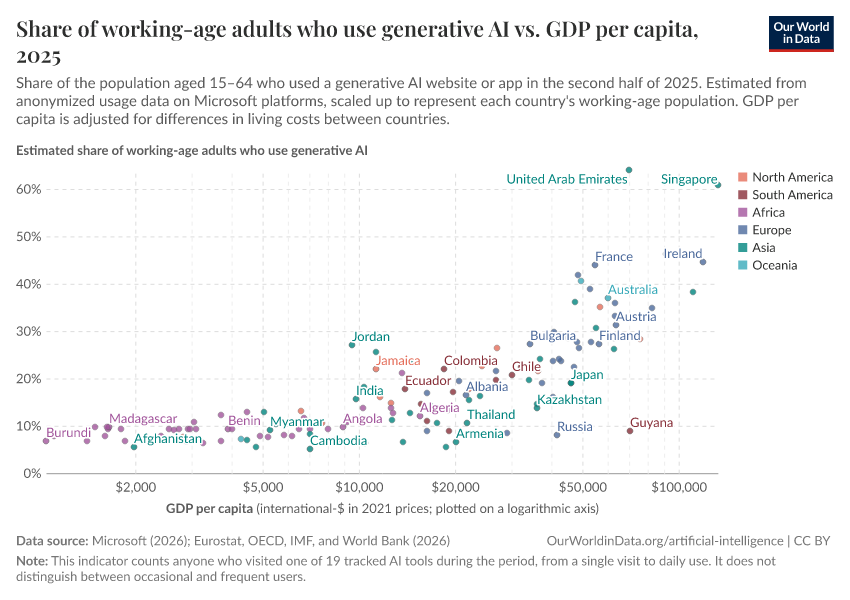
Key Charts on Artificial Intelligence
See all charts on this topic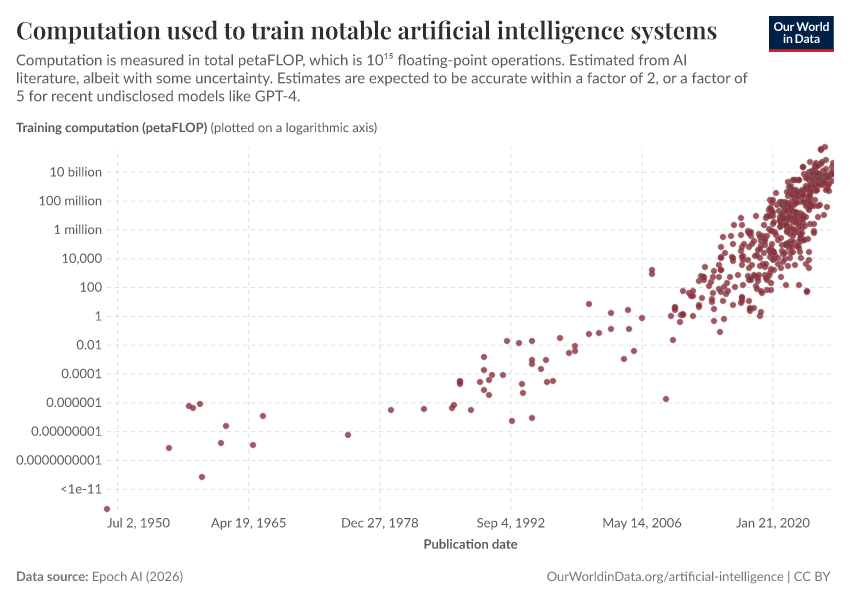


Featured Data on Artificial Intelligence
Research & Writing
January 20, 2025
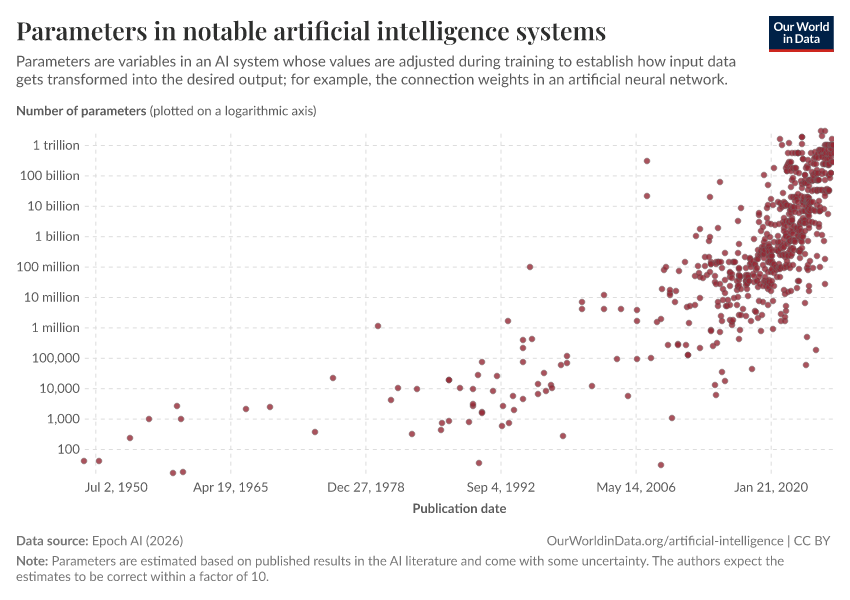
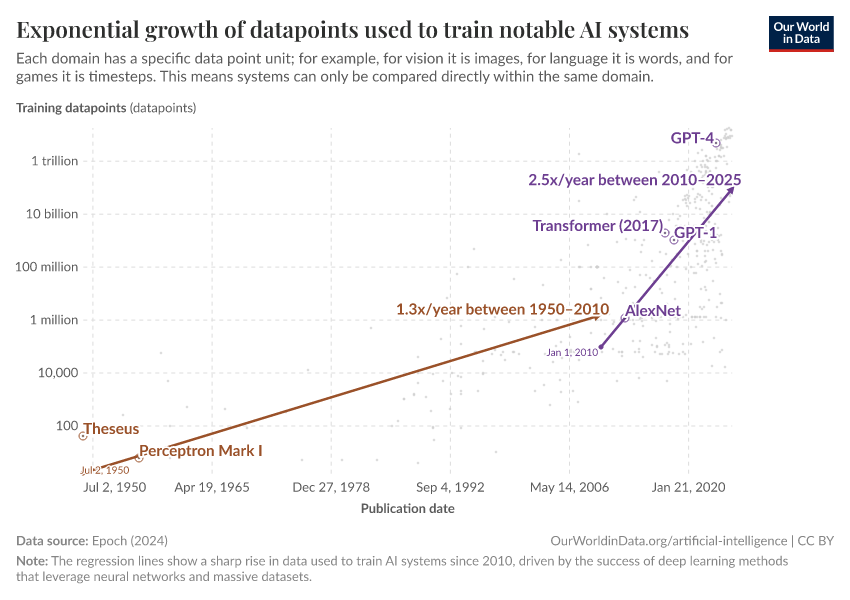
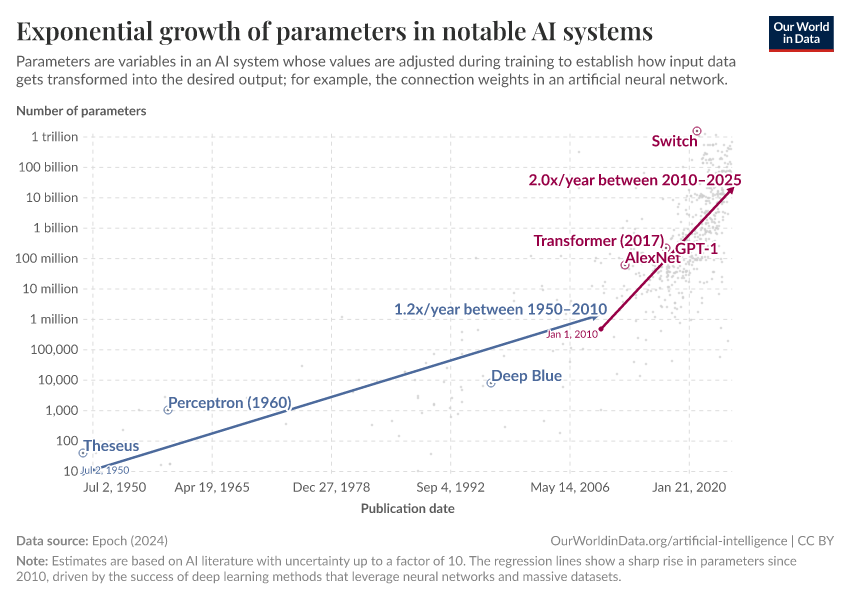
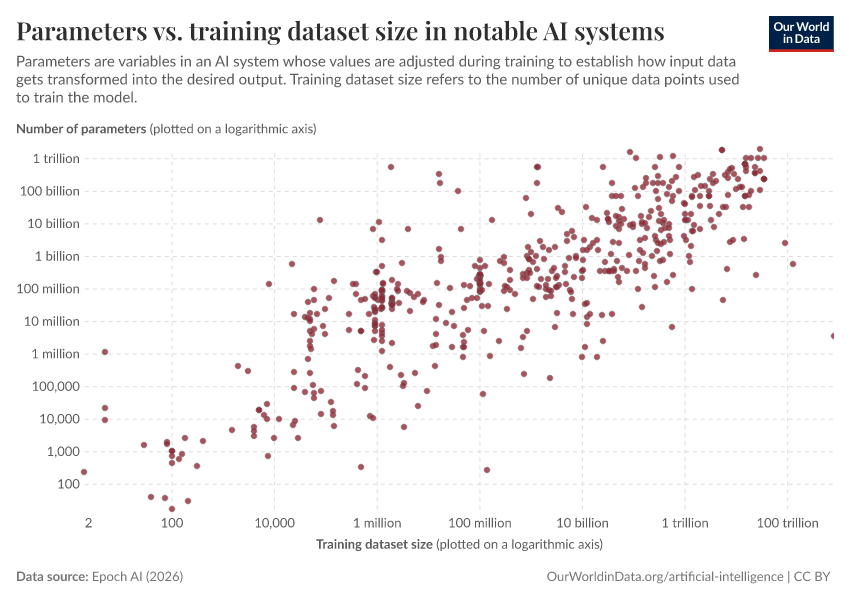
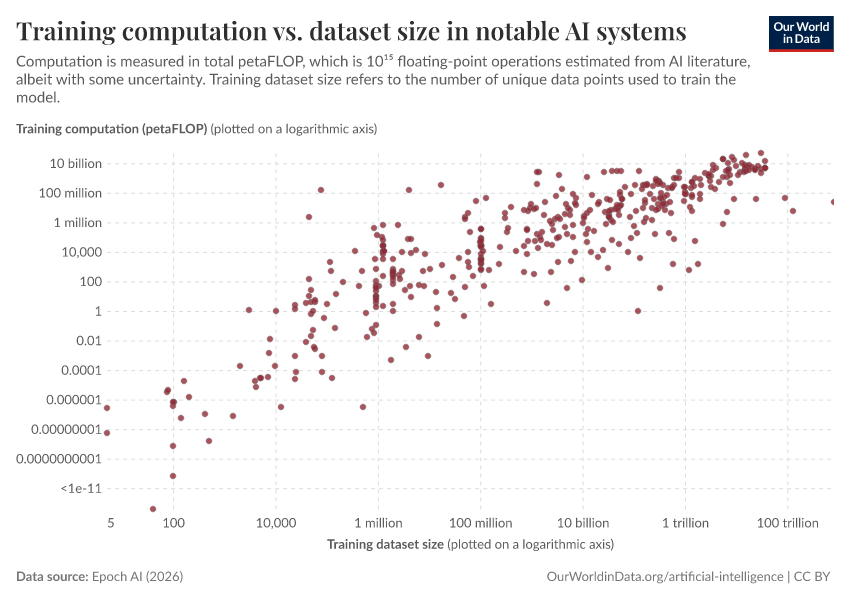
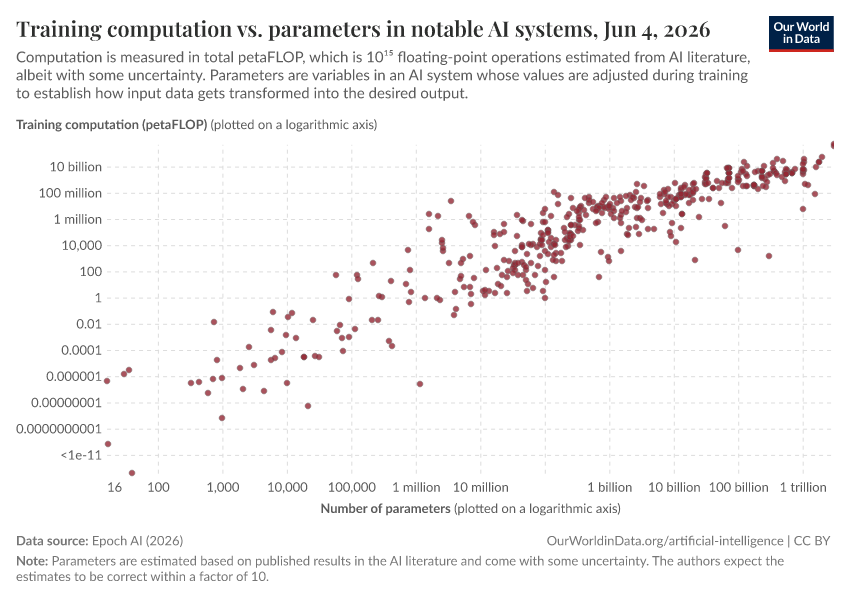
Scaling up: how increasing inputs has made artificial intelligence more capable
The path to recent advanced AI systems has been more about building larger systems than making scientific breakthroughs.
December 15, 2022
Artificial intelligence is transforming our world — it is on all of us to make sure that it goes well
How AI gets built is currently decided by a small group of technologists. It should be in all of our interest to become informed and engaged.
February 7, 2023
AI timelines: What do experts in artificial intelligence expect for the future?
Many believe there is a real chance that human-level AI will be developed within the next decades, and some believe that it will exist much sooner.
More Articles on Artificial Intelligence
March 29, 2023
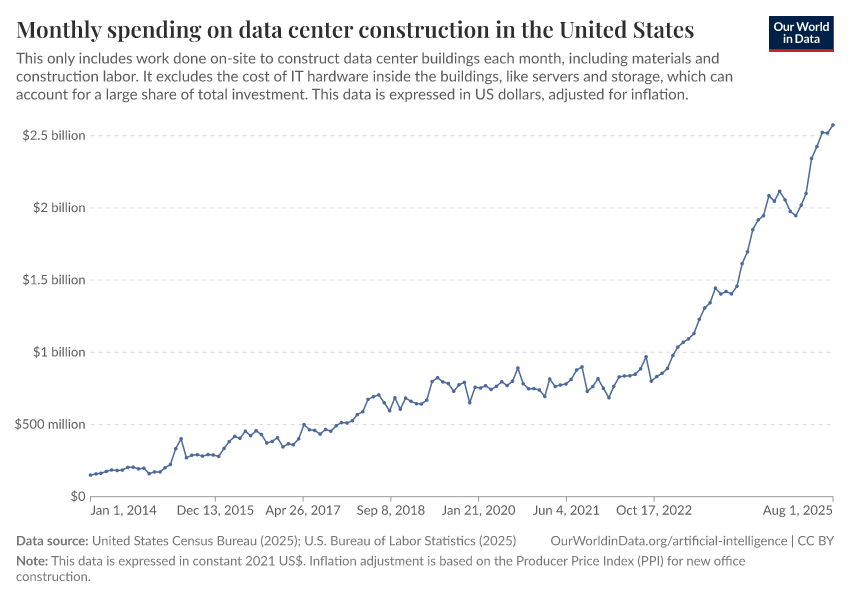
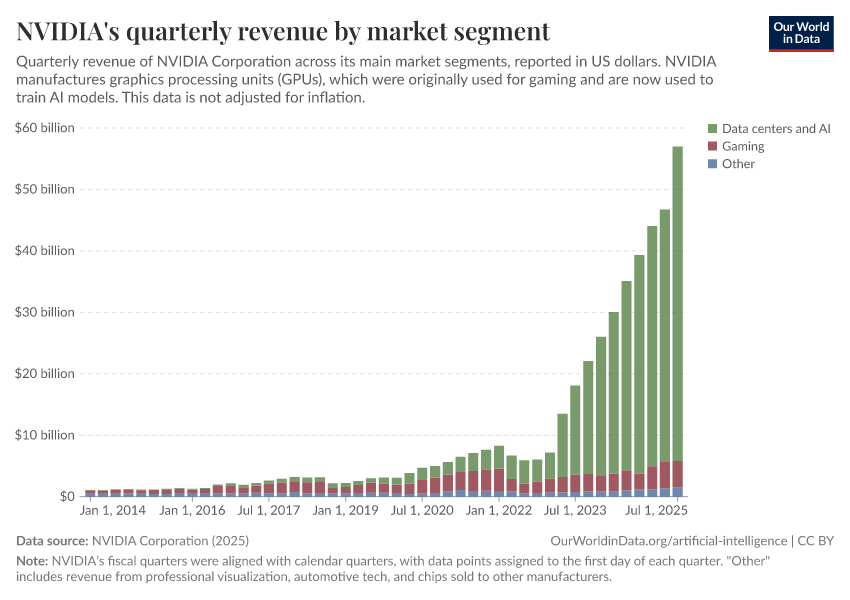
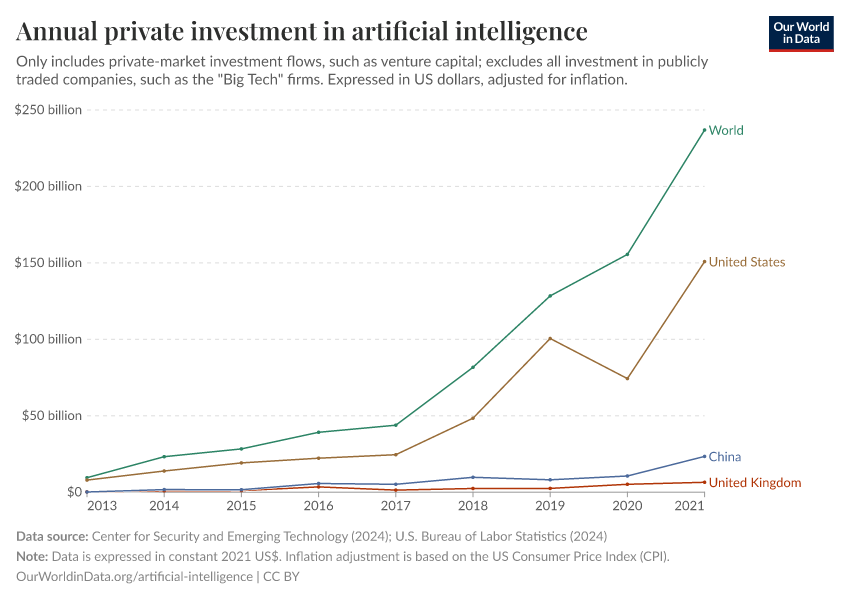
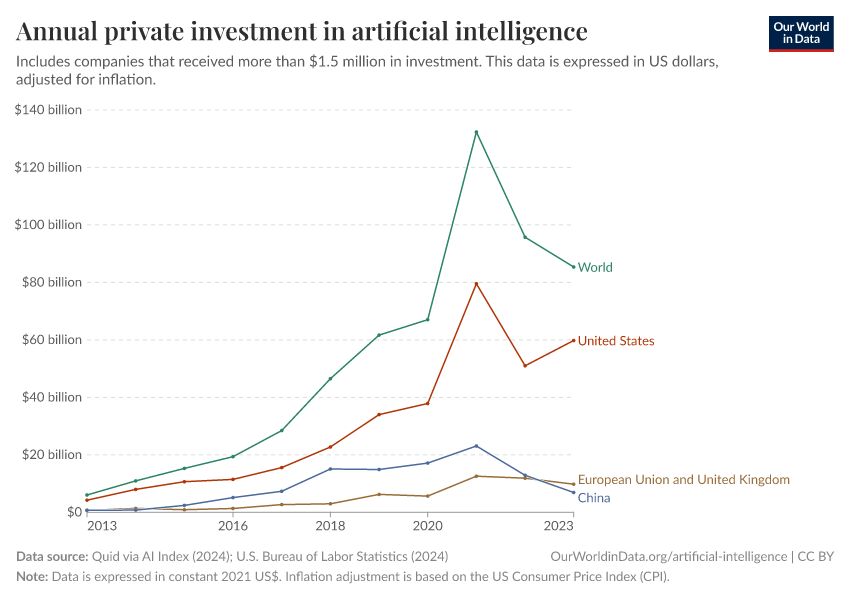
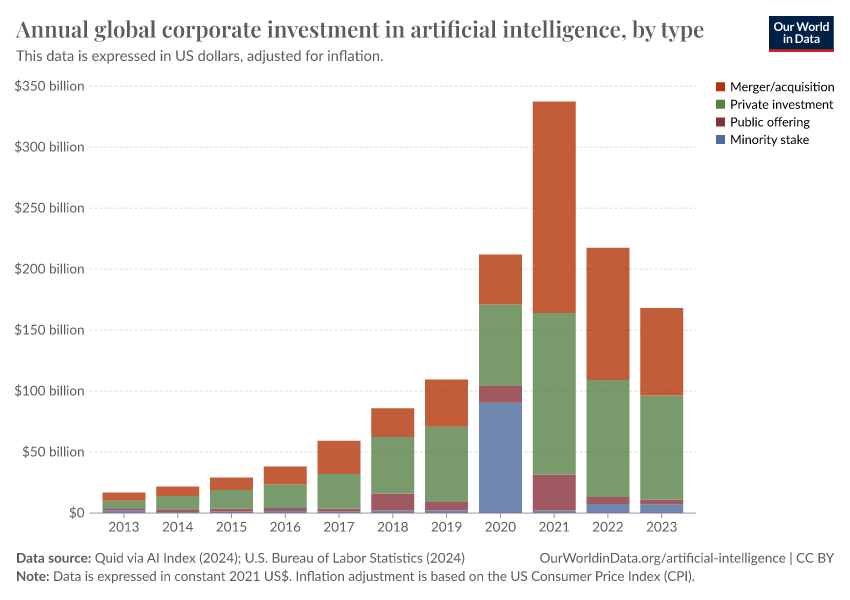
Artificial intelligence has advanced despite having few resources dedicated to its development — now investments have increased substantially
December 6, 2022
The brief history of artificial intelligence: the world has changed fast — what might be next?
February 22, 2023
Technology over the long run: zoom out to see how dramatically the world can change within a lifetime
Cite this work
Our articles and data visualizations rely on work from many different people and organizations. When citing this topic page, please also cite the underlying data sources. This topic page can be cited as:
Edouard Mathieu, Charlie Giattino, Veronika Samborska, and Max Roser (2023) - “Artificial Intelligence” Published online at OurWorldinData.org. Retrieved from: 'https://ourworldindata.org/artificial-intelligence' [Online Resource]BibTeX citation
@article{owid-artificial-intelligence,
    author = {Edouard Mathieu and Charlie Giattino and Veronika Samborska and Max Roser},
    title = {Artificial Intelligence},
    journal = {Our World in Data},
    year = {2023},
    note = {https://ourworldindata.org/artificial-intelligence}
}
Reuse this work freely
All visualizations, data, and articles produced by Our World in Data are completely open access under the Creative Commons BY license. You have the permission to use, distribute, and reproduce these in any medium, provided the source and authors are credited.
The data produced by third parties and made available by Our World in Data is subject to the license terms from the original third-party authors. We will always indicate the original source of the data in our documentation, so you should always check the license of any such third-party data before use and redistribution.
All of our charts can be embedded in any site.