Meat and Dairy Production
Meat is an important source of nutrition for people around the world. How quickly is demand growing? And what are the implications for animal welfare and the earth’s environment?
This page was first published in August 2017. We made changes to the text in December 2023.
Feeding the world in a sustainable way is one of our most pressing challenges in the coming decades. Meat plays a pivotal role in this.
Meat is an important source of nutrition for many people around the world. Global demand for meat is growing: over the past 50 years, meat production has more than tripled. The world now produces more than 350 million tonnes each year.
However, the production of meat has large environmental impacts – increasing greenhouse gas emissions, agricultural land, and freshwater use. One of the world's most pressing challenges is to produce and consume meat, dairy, and other protein products in a way that reduces its environmental impacts.
Related topics
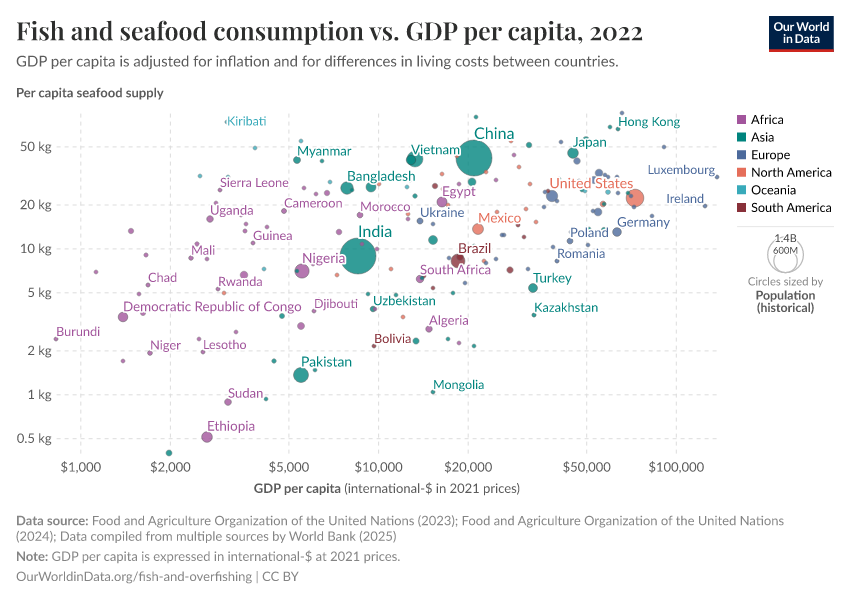
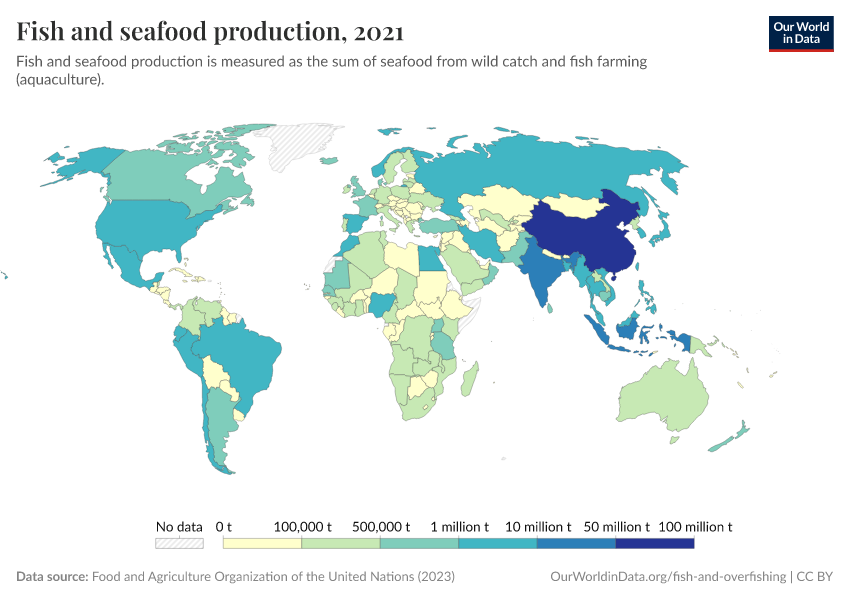
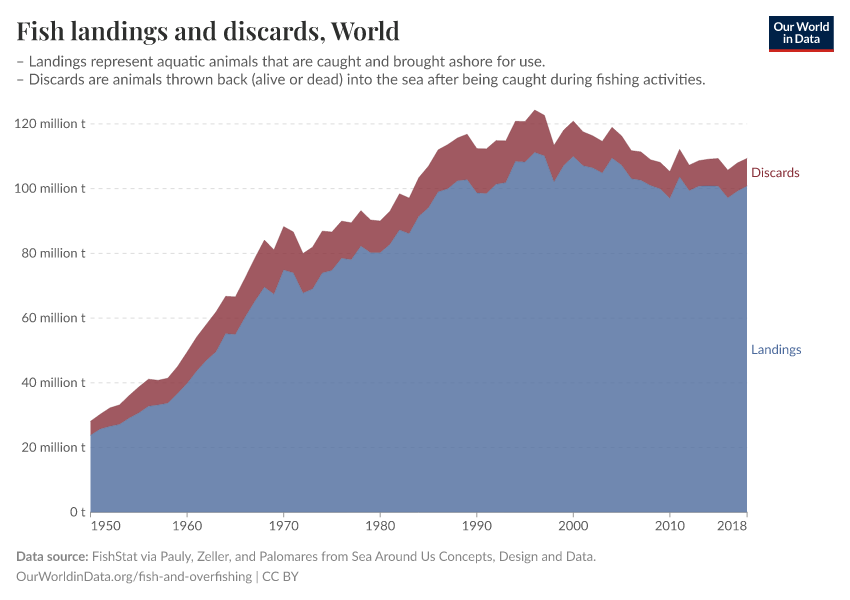
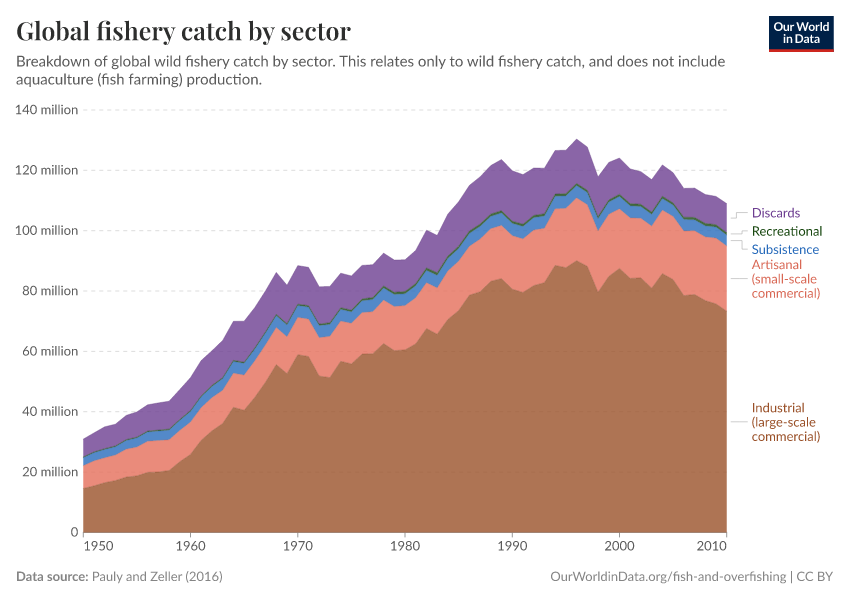
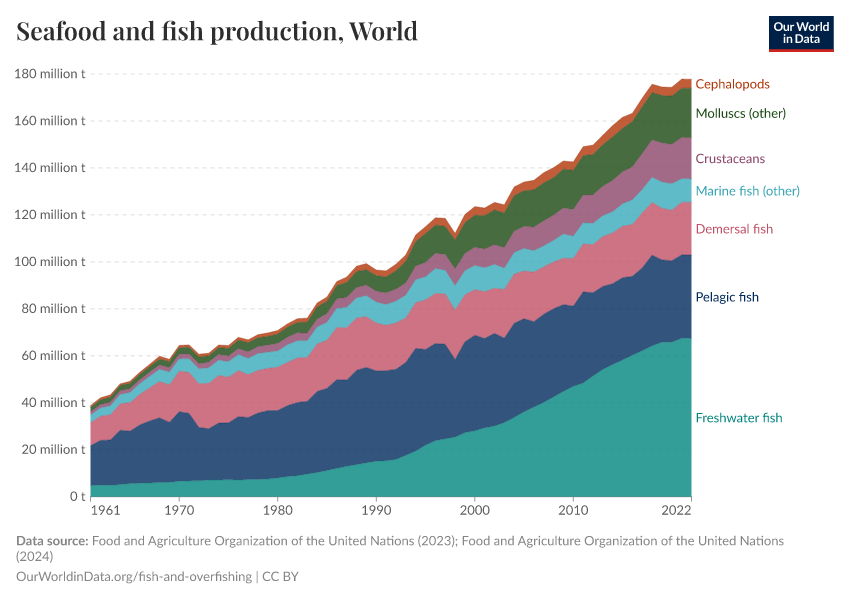
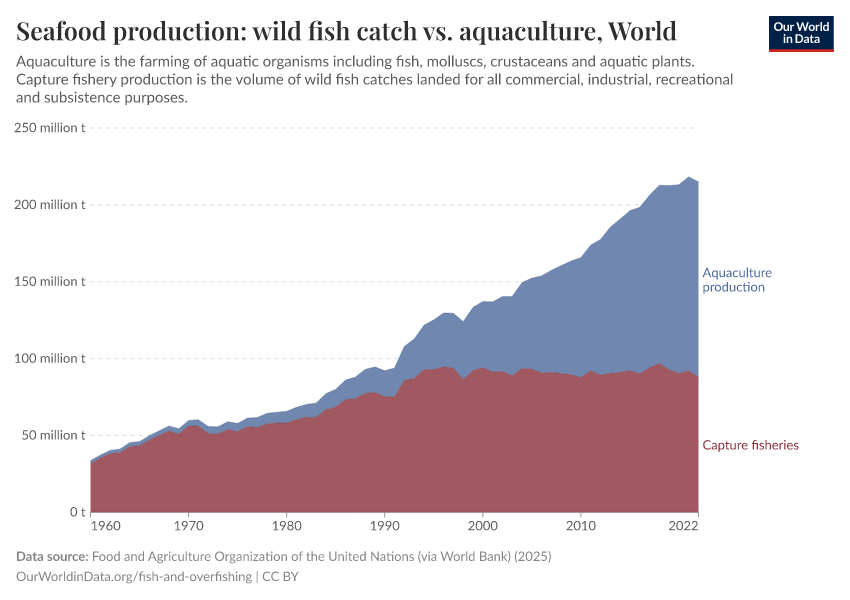
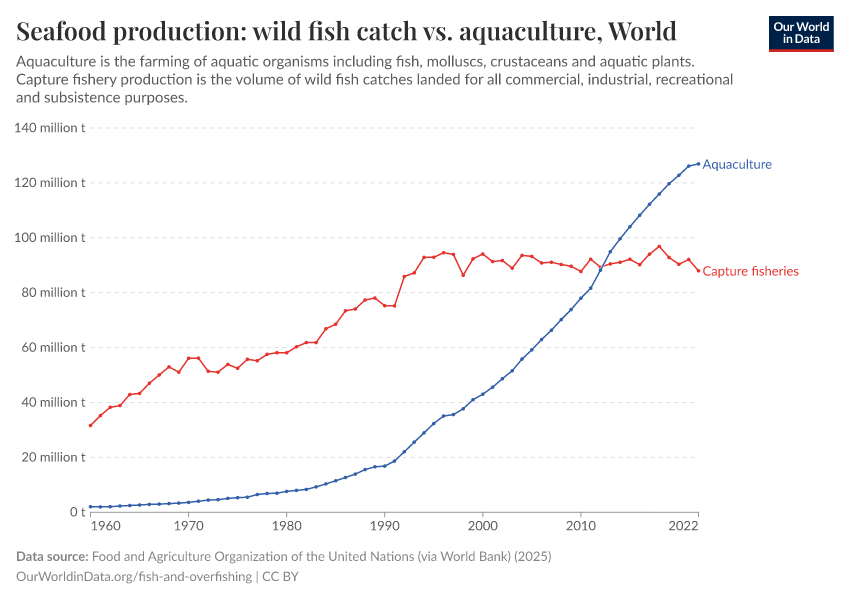
Seafood production – fish and seafood is another key source of protein and nutrition for populations across the world. How much fish do people eat, and what are the environmental impacts?
Diet compositions – varied diets are essential for good health and nutrition. However, the quality and diversity of diets vary significantly across the world. What do people eat?
Micronutrient deficiency – poor dietary diversity means many people lack the essential vitamins and minerals they need for good health. How common is micronutrient deficiency and who is most at risk?
Land use – half of the world's habitable land is used for agriculture, and more than three-quarters of this is used for livestock. In this topic page, we look in detail at land use across the world.
See all interactive charts on Meat and Dairy Production ↓
Meat production
Global meat production
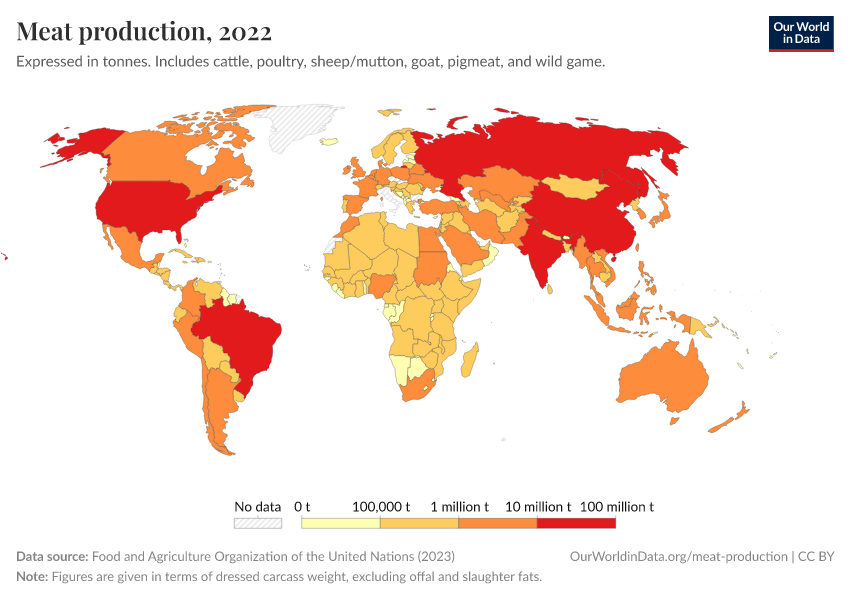
Meat production across the world
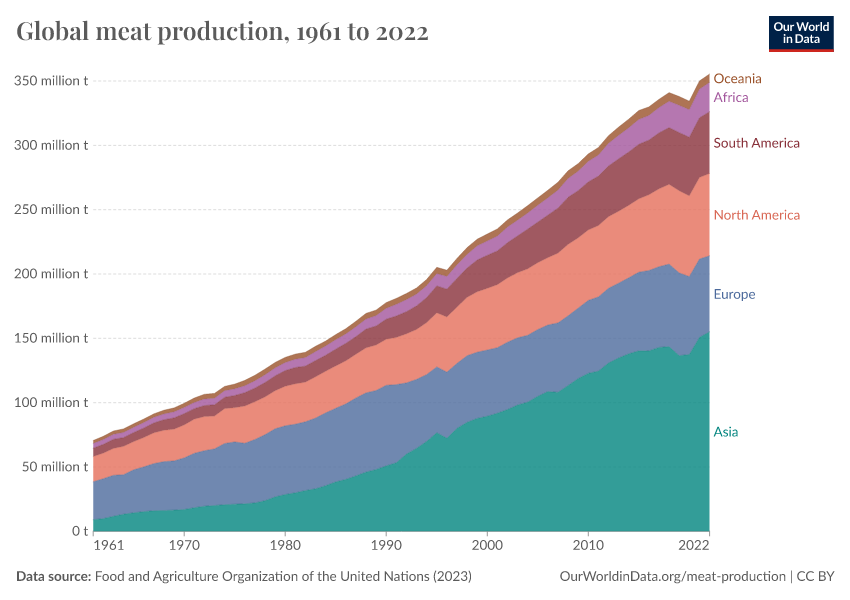
Global meat production has increased rapidly over the past 50 years – as we see, total production has more than quadrupled since 1961. The chart shows global meat production by region, measured in tonnes.
Regionally, Asia now holds the position of being the largest meat producer, contributing a substantial portion of the total global meat production. This represents a significant shift from previous decades. In the early 1960s, Europe and North America were the primary meat-producing regions. However, by the early 21st century, their combined share had decreased notably, with Asia emerging as the predominant region in terms of meat production.
This reduction in production share was despite a large increase in production in absolute terms: Europe's meat output has approximately doubled over this period, whilst North American output has increased 2.5-fold. Production increases in Asia, however, have been staggering: meat production has increased 15-fold since 1961.
Absolute increases in production in other regions have also been substantial, with output in all regions (except the Caribbean which approximately tripled) growing more than 5-fold over this period.


Meat production by animal
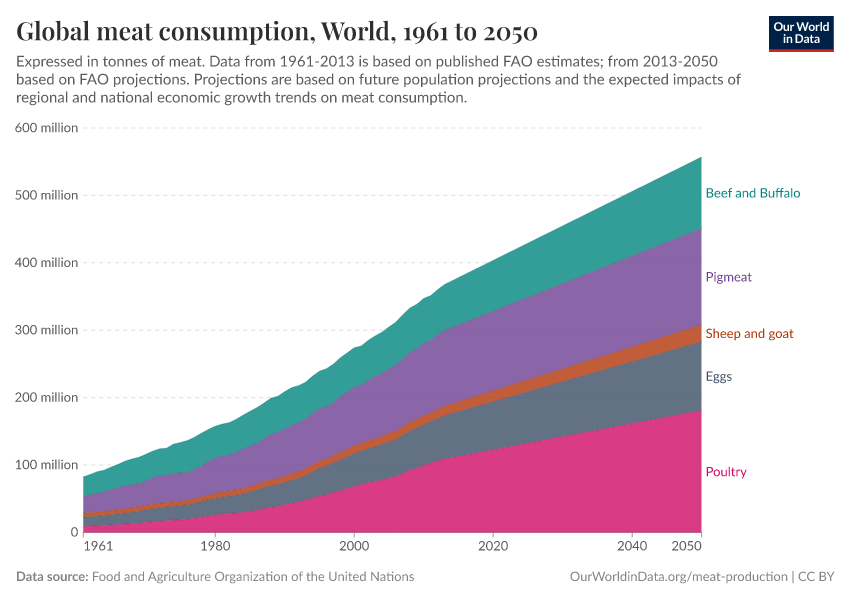
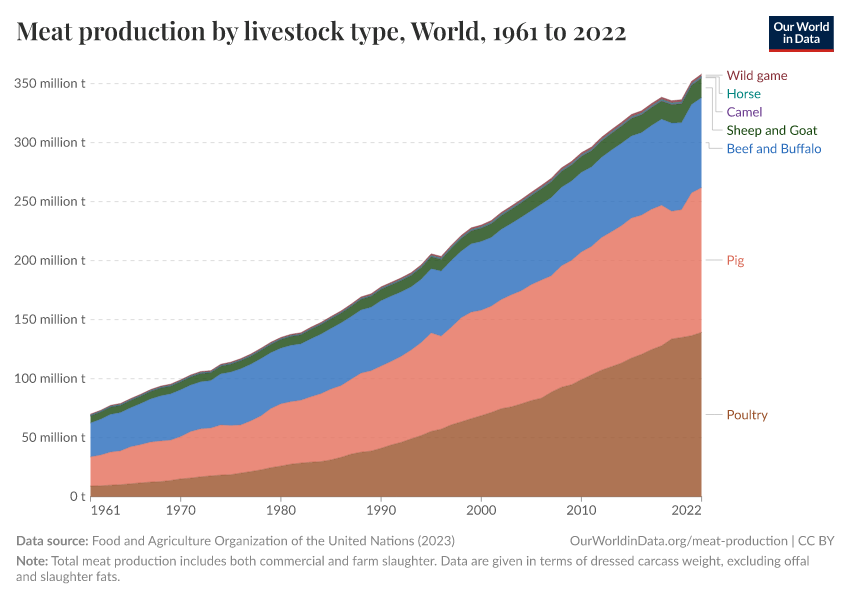
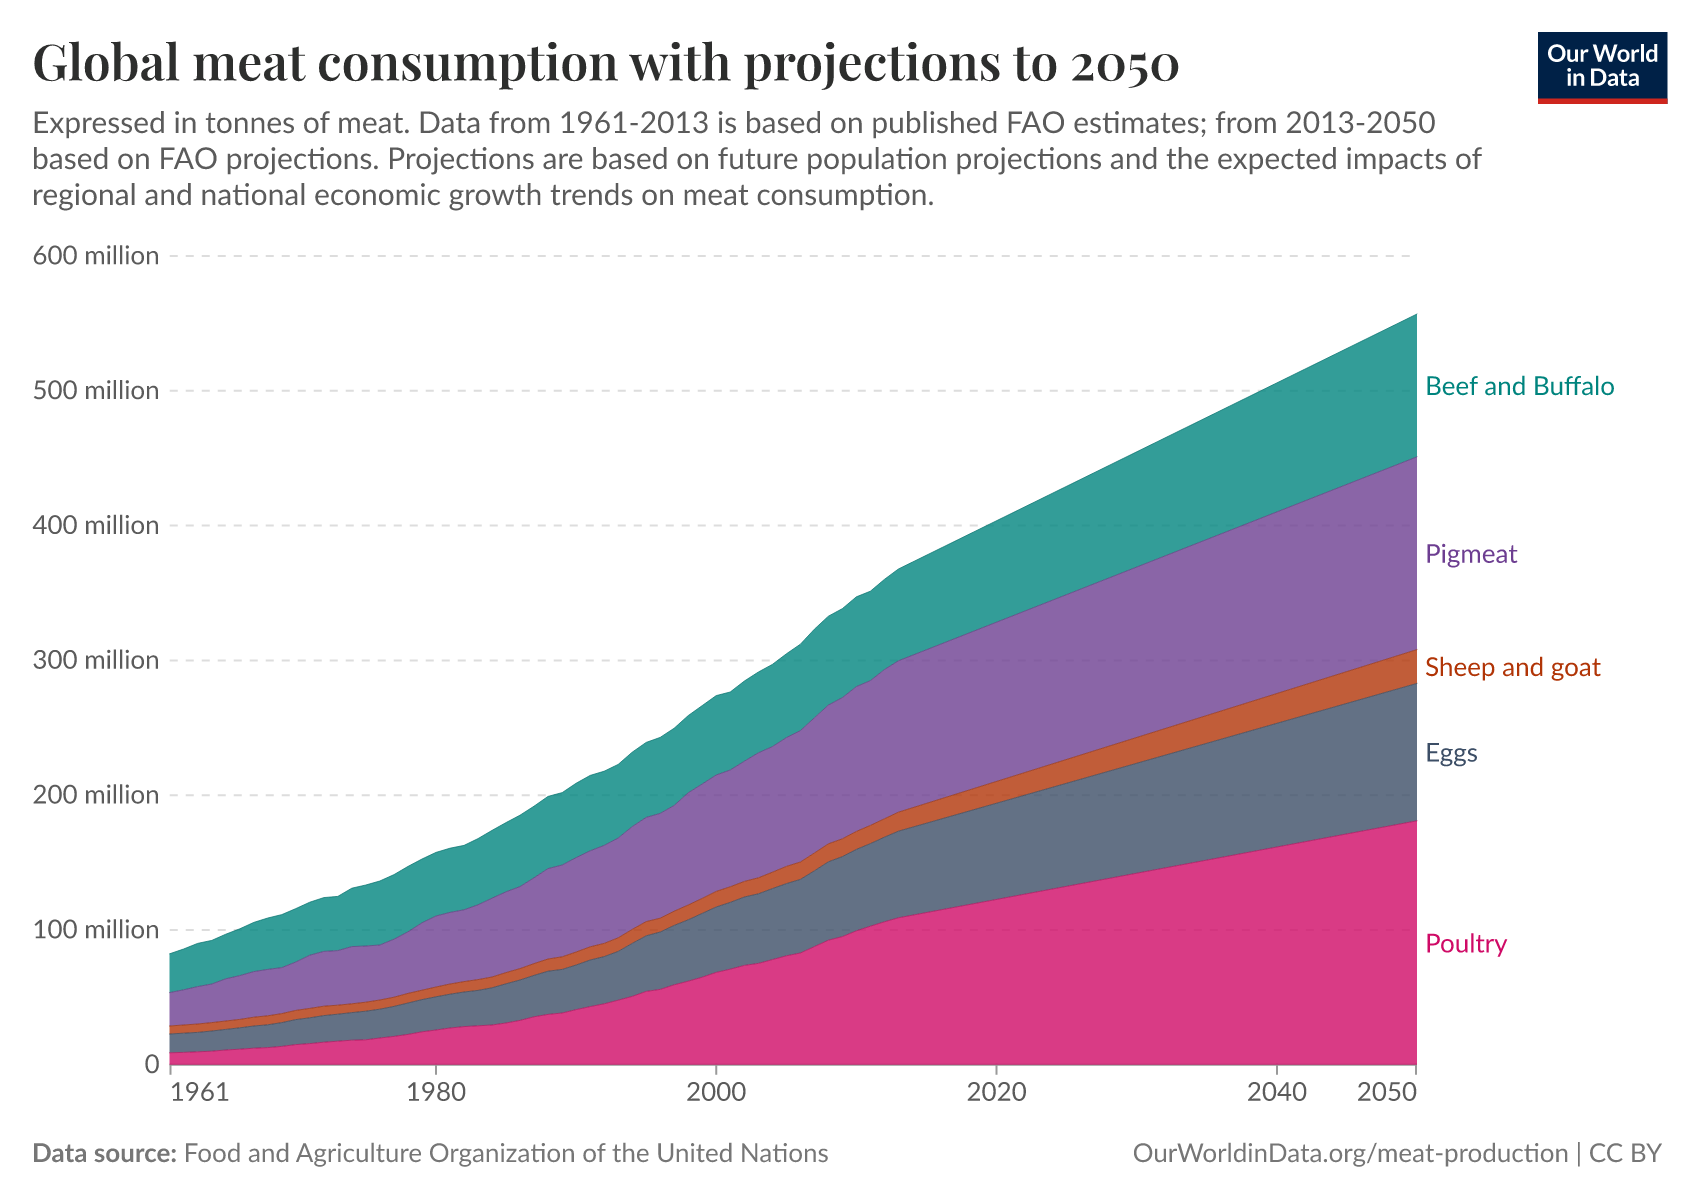
In the chart, we see how meat production has changed by livestock type since 1961.
At a global level, we see that the dominant livestock types are poultry, cattle (which includes beef and buffalo meat), pigs, and sheep & goats to a lesser extent. However, the distribution of meat types varies significantly across the world; in some countries, other meat types such as wild game, horse, and duck can account for a significant share of total production.
Although production of all major meat types has been increasing in absolute terms, in relative terms the share of global meat types has changed significantly over the last 50 years. Poultry meat, for example, used to constitute a smaller portion of the total meat production, but its share has significantly increased. In contrast, the proportion of beef and buffalo meat in total production has decreased. Meanwhile, the share of pig meat in global production has remained relatively stable.

Beef and buffalo (cattle) meat production
In the chart, we see the global production of cattle (beef and buffalo) meat. Globally, cattle meat production has more than doubled since 1961.
The United States stands as the largest producer of beef and buffalo meat, followed by Brazil and China. Other notable producers in this sector include Argentina, Australia, and India.

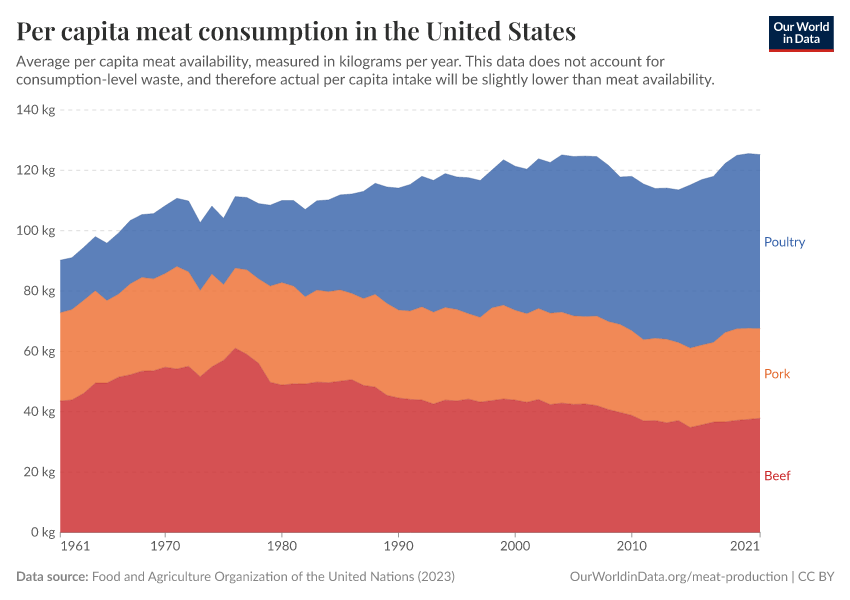
Poultry production
Global production of poultry meat has seen a dramatic rise over the last 50 years, multiplying significantly since 1961. Global trends in poultry production are shown in the chart.
The United States leads in poultry production, with China and Brazil also being major producers. Europe collectively contributes a significant amount to global poultry production, comparable to that of the United States.

Pigmeat production
Since the early 1960s, global pigmeat production has also expanded significantly. China is the leading producer, contributing a substantial portion of the world's total pigmeat output. The growth in Chinese pigmeat production has been particularly rapid over the past couple of decades.
Other major producers in this sector include the United States, Germany, Spain, and Brazil.

Per capita meat consumption
Which countries eat the most meat?
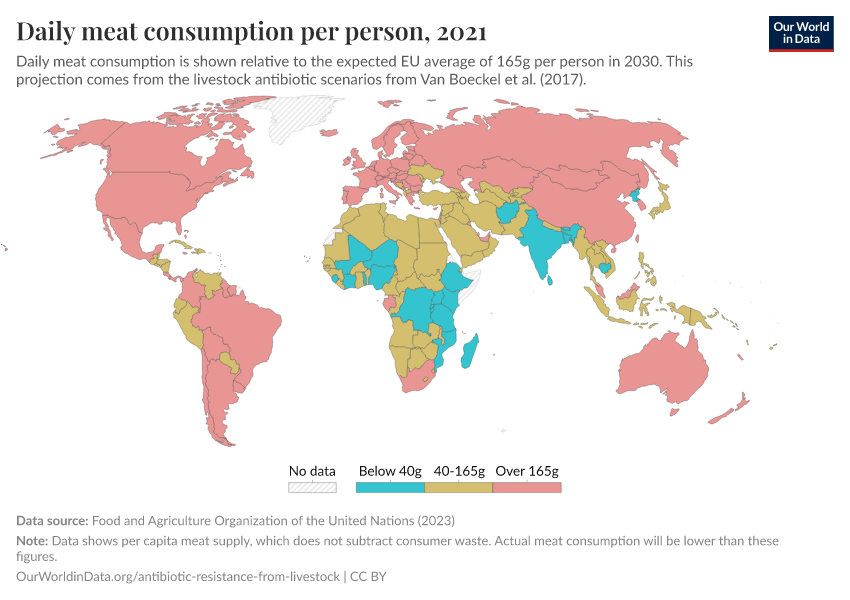
Global population has undergone rapid growth, especially in the second half of the 20th century; we may therefore also expect rapid growth in total meat production as explored in the sections above. But how has meat consumption changed on a per capita basis?
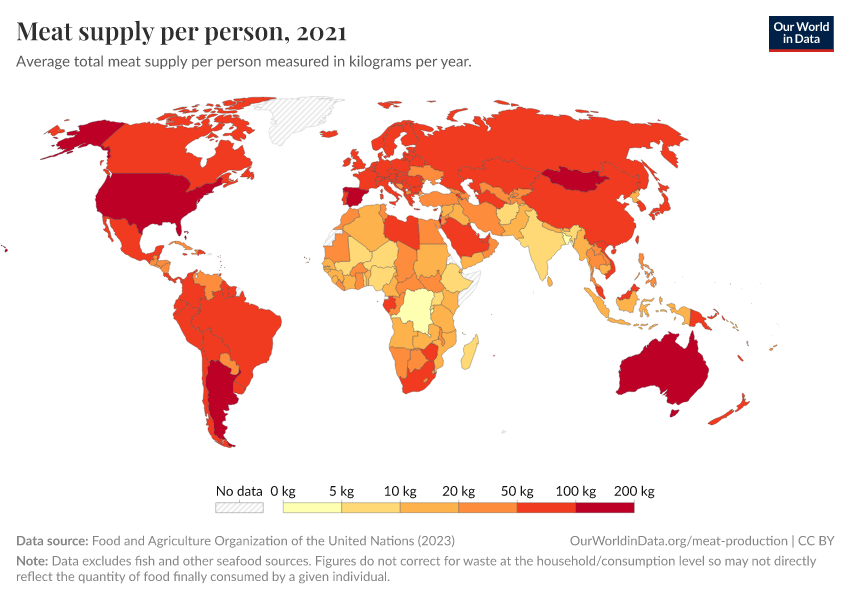
In the chart, we see a global map of per capita meat (excluding seafood and fish) consumption, measured in kilograms per person per year. These trends can also be viewed as a time series in the "Chart" tab. Globally, there has been an increase in average per capita meat consumption over the years. This rise in per capita consumption indicates that total meat production has grown at a rate faster than population growth.
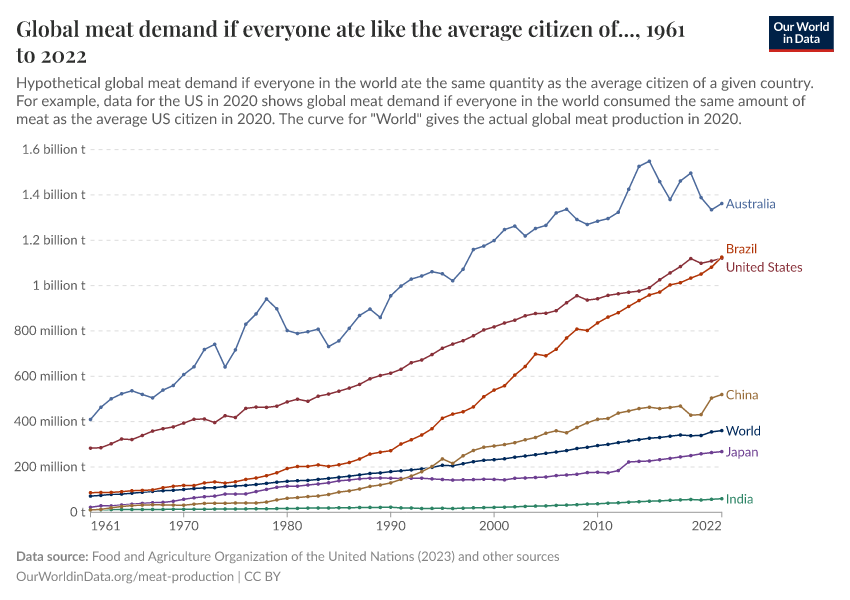
The changes in per capita meat consumption vary significantly across different countries, often reflecting their economic transitions. For example, in countries like China, there has been a substantial increase in meat consumption per person since the early 1960s. Similarly, countries like Brazil have also seen a notable rise in their per capita meat consumption. On the other hand, India presents a contrasting scenario due to its strong lactovegetarian preferences, resulting in per capita meat consumption that remains low and relatively unchanged over the same period.1
Meat consumption tends to be highest in high-income countries, with notable consumption in places like Australia. On average, individuals in European and North American regions also consume significant amounts of meat. However, the rate of change in meat consumption in these high-income areas has been relatively slow, with trends in recent decades showing stagnation or even a decrease in some regions.
Meat consumption trends across Africa show considerable variation. In some countries, the per capita meat consumption is quite low, about half of the average for the continent. In contrast, higher-income nations like South Africa have a higher rate of meat consumption per person.

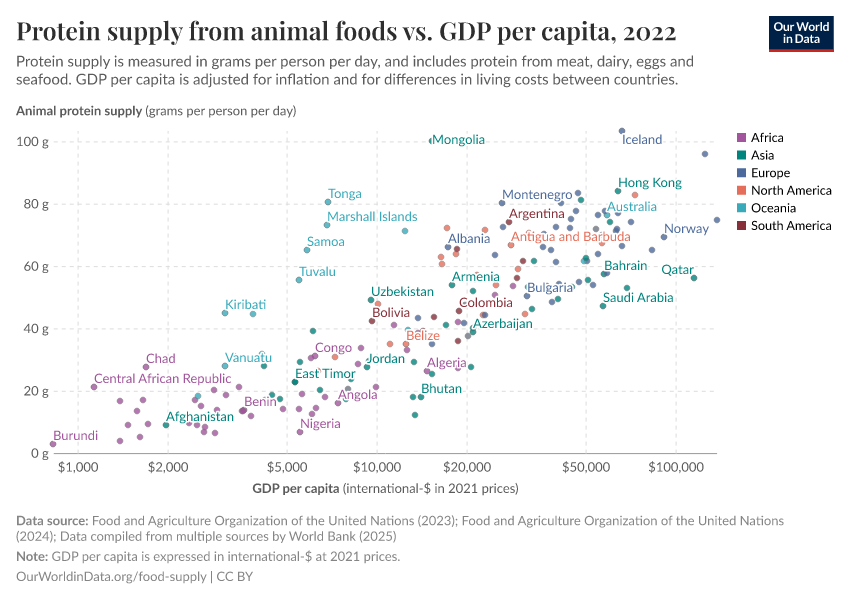
Meat consumption tends to rise as we get richer
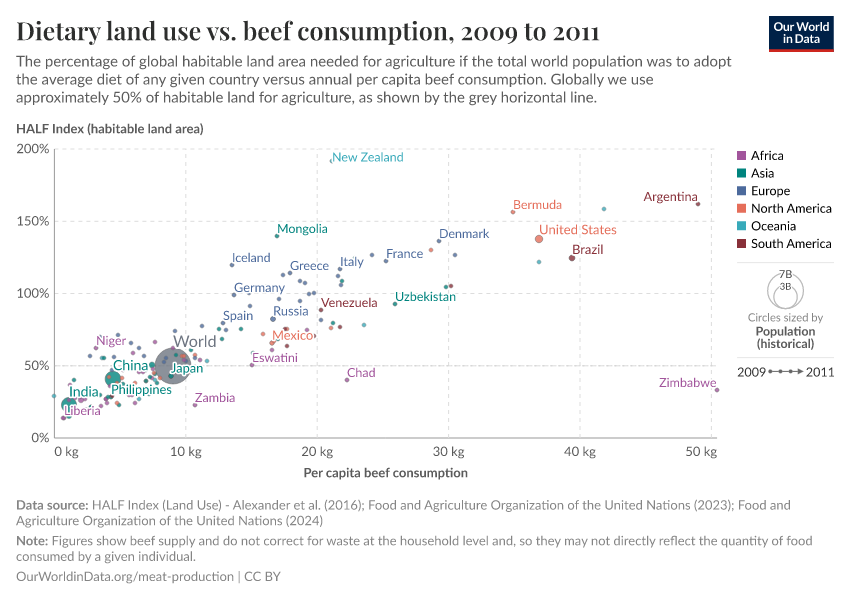
One of the strongest determinants of how much meat people eat is how rich they are. This is at least true when we make cross-country comparisons.
In the scatterplot we see the relationship between per capita meat supply (on the y-axis) and average GDP per capita (on the x-axis). What we see is a strong positive relationship: the richer a country is, the more meat the average person typically eats.
If you press 'play' on the interactive chart you can see the trajectory of each country over time. Overall, countries tend to shift upwards and to the right: getting richer and eating more meat.

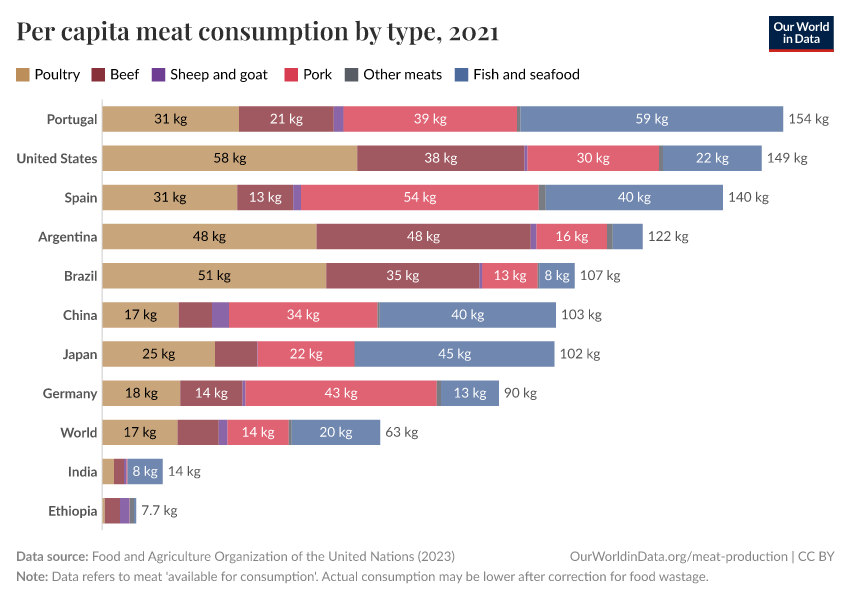
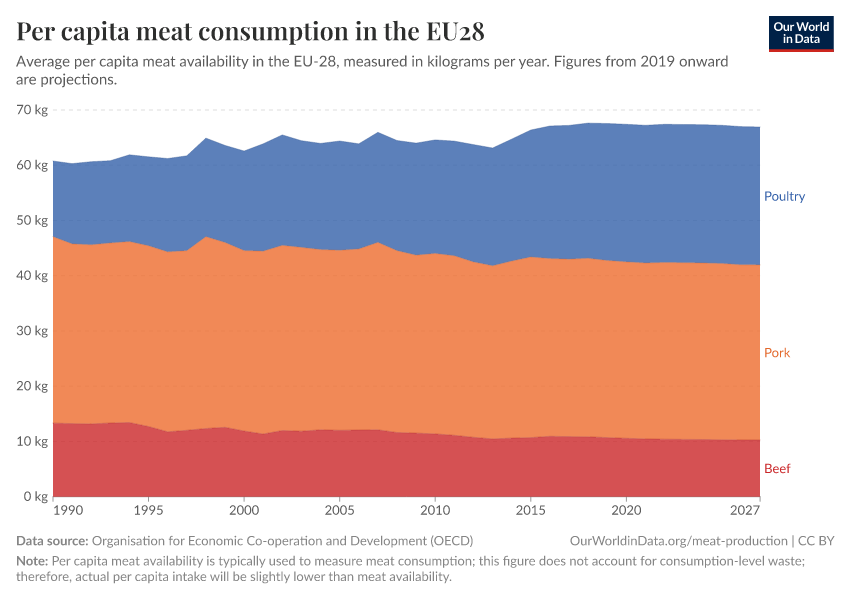
What types of meat do people eat?
What preferences do we have in terms of the types of meat we eat? Globally, pigmeat holds the distinction of being the most consumed meat commodity on average per capita. The average person's consumption includes pigmeat as the predominant choice, followed by poultry, beef/buffalo meat, and mutton & goat meat, with other types of meat making up a smaller fraction of the overall consumption.
Consumption trends vary significantly across the world. In China, pigmeat accounts for around two-thirds of per capita meat consumption. In Argentina, beef and buffalo meat dominate, accounting for more than half of consumption. New Zealanders have a much stronger preference for mutton & goat meat relative to the global average.
In the charts here we see the per capita consumption of different meat types by country.


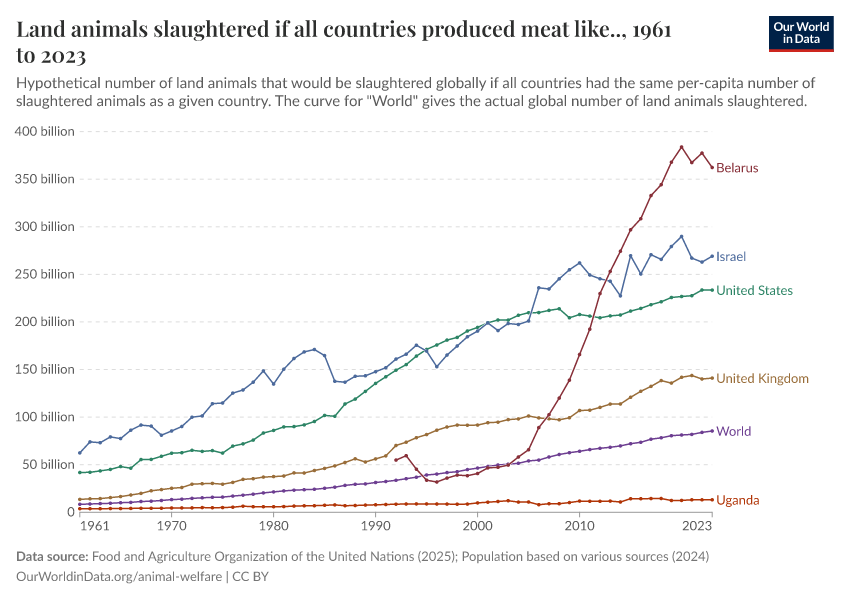
Number of animals slaughtered
The visualization details the total number of livestock animals slaughtered for meat in the given year.
This is shown across various types of livestock. Here these figures represent the total number slaughtered for meat production (which does not include those used primarily for dairy or egg production which are not eventually used for meat).
In terms of animals slaughtered for meat, chickens top the list with the highest numbers. Pigs are next, but their numbers are markedly lower than chickens. Following pigs, the numbers of turkeys, sheep, goats, and cattle slaughtered are each progressively smaller. This pattern underscores the predominance of poultry in meat production compared to other animal types.

Livestock counts
The figures represent 'livestock counts' — these represent the total number of live animals at a given time in any year. This is not to be confused with the figures above which represent the total number of livestock animals slaughtered or used for meat in any given year.
Global livestock numbers over the long term

Number of cattle

Number of poultry birds

Number of pigs

Dairy production & consumption
Milk production across the world

Per capita milk consumption

Egg production & consumption
Total egg production

Per capita egg consumption

Fish and seafood production
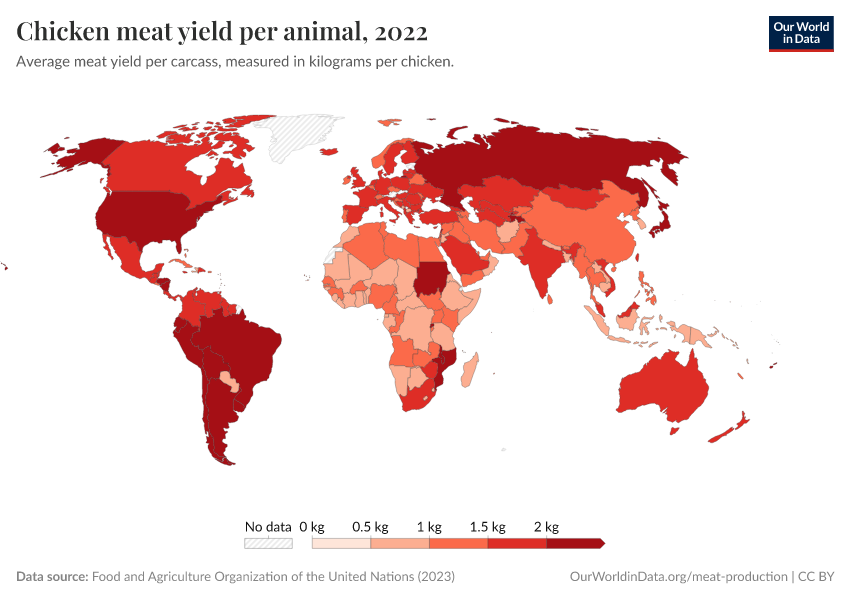
Productivity/yield per animal
Cattle meat per animal

Poultry meat per animal

Pigmeat per animal

Milk per animal

Eggs per animal

Efficiency of meat production
Feed conversion ratio (FCR)

Protein conversion efficiency

Energy conversion efficiency

Environmental impacts of meat production
Definitions & Measurement
How is per capita food supply or consumption calculated?
The UN Food and Agricultural Organization (FAO) prepares 'Food Balance Sheets' (FBS) across all food commodities at global, regional, and national levels. Food Balance Sheets map the quantity of food commodities (measured as their primary equivalents, for example, "wheat and products" represents the sum of all products derived from wheat) from the production level through to the remaining quantity left for human food. This is measured in mass quantities - such as tonnes or kilograms.
These sheets account for losses and allocations in the food system, including imports, exports, stock variations, seed, animal feed, other (industrial uses), and food losses. The remaining commodities after correction for these diversions are defined as 'food supply'. To derive the average per capita food supply, this total figure is divided by the population size. This figure can be considered to be the average level of food intake however it does not account for food wastage at the consumer level (i.e. in households or restaurants).
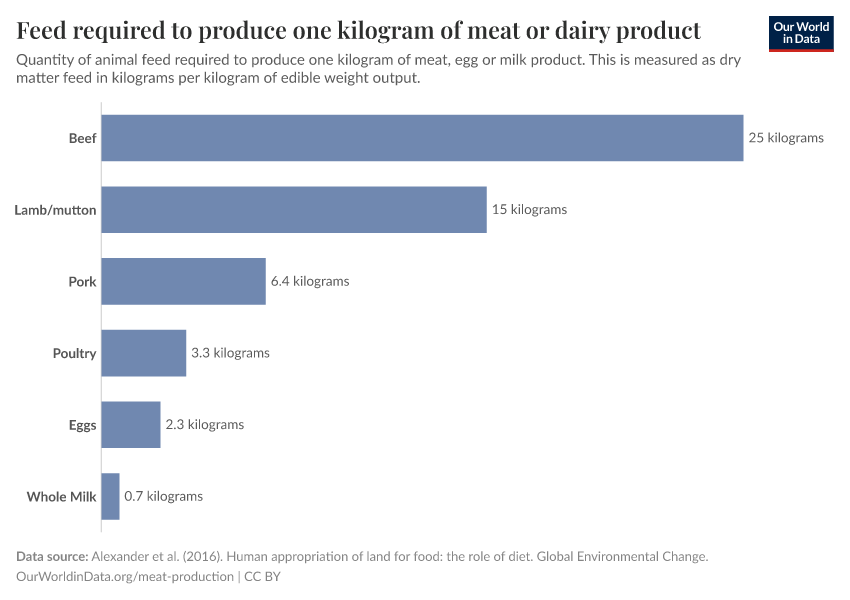
What are feed, protein, and energy conversion ratios?
Conversion ratios or conversion efficiency are used to measure the ratio of feed inputs (either in the form of food crops, or pasture/grazing land) to output in the form of a food product.2
Feed conversion ratio (FCR) is used to measure the mass quantity of feed required to produce one kilogram of animal product (e.g. meat). For example, on average, we have to feed cattle 25 kilograms of feed to produce one kilogram of beef or buffalo meat - this would give us an FCR value of 0.04 (calculated as output (1 kilogram) / input (25 kilograms).
Protein and energy efficiency are calculated as the quantity of protein/energy in animal feed which is effectively converted into protein/energy in the resultant animal products. For example, if we feed a chicken 500 grams of protein and only get 100 grams out in chicken meat, we define this protein conversion efficiency as 20 percent (calculated as output (100 grams) / input (500 grams)). The same calculation process applies to energy conversion efficiency using caloric inputs and outputs.
How are land use requirements and greenhouse gas emissions calculated for food products?
Environmental footprints, such as those defined as land use requirements or greenhouse gas emissions per unit mass, protein, or calorie of food products are calculated using a process called life-cycle analysis (LCA). LCA methods are used to try to fully capture all environmental impacts across the value chain and can include those up and downstream of production.
Standard food footprints - and those referenced in this topic page - often set boundary conditions called 'cradle-to-farmgate' which means that all impacts in terms of pre-farm and on-farm activities are included.3
This includes food chain inputs such as fertilizer production and application, seed production, energy use on-farm, feed production, manure production (if used as fertilizer), manure management, and farm infrastructure construction.
Life-cycle analyses (LCAs) attempt to fully quantity all such inputs necessary for the production of food production. For example, a greenhouse gas emissions LCA for beef can include emissions from fertilizer production, and application used for the production of animal feed; on-farm energy use associated with tilling, irrigation (if needed), transport of feed from field to livestock area, and enteric fermentation emissions produced from cattle, and barn/housing energy requirements. By deriving and then summing the emissions associated with each stage and dividing by the total output (in kilograms of meat, units of protein, or kilocalories), we can calculate the total emissions per unit mass/protein/kilocalorie.
Key Charts on Meat & Dairy Production
See all charts on this topic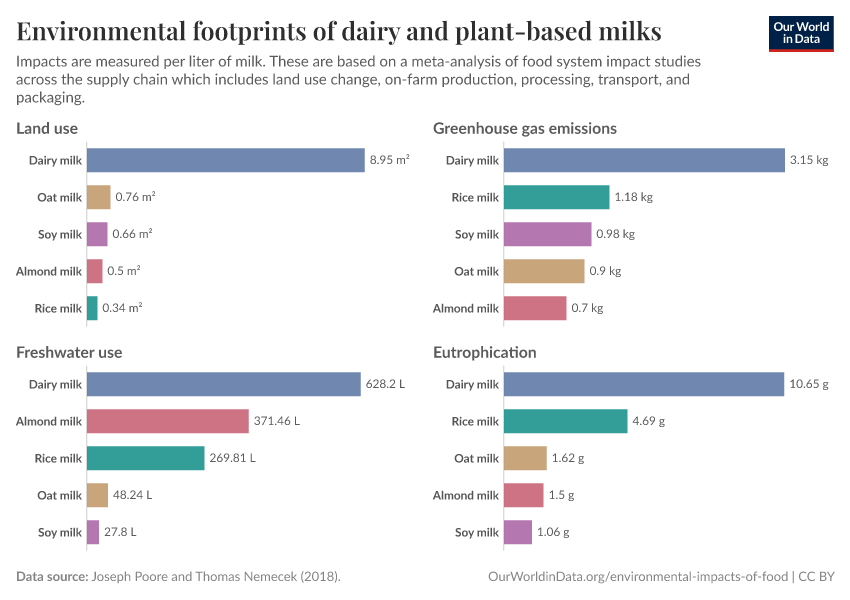


Featured Data on Meat & Dairy Production
Endnotes
Rammohan, A., Awofeso, N., & Robitaille, M. C. (2011). Addressing Female Iron-Deficiency Anaemia in India: Is Vegetarianism the Major Obstacle?. ISRN Public Health, 2012.
Cottle, D. J. (David John), 1954-, (editor.) & Kahn, Lewis, (editor.) (2014). Chapter 3: Beef cattle production and trade. Collingwood, Vic. CSIRO Publishing. Online here.
Clark & Tilman (2017). Comparative analysis of environmental impacts of agricultural production systems, agricultural input efficiency, and food choice. Environmental Research Letters, Volume 12, Number 6. Available online.
Cite this work
Our articles and data visualizations rely on work from many different people and organizations. When citing this topic page, please also cite the underlying data sources. This topic page can be cited as:
Hannah Ritchie, Pablo Rosado, and Max Roser (2019) - “Meat and Dairy Production” Published online at OurWorldinData.org. Retrieved from: 'https://ourworldindata.org/meat-production' [Online Resource]BibTeX citation
@article{owid-meat-production,
    author = {Hannah Ritchie and Pablo Rosado and Max Roser},
    title = {Meat and Dairy Production},
    journal = {Our World in Data},
    year = {2019},
    note = {https://ourworldindata.org/meat-production}
}
Reuse this work freely
All visualizations, data, and articles produced by Our World in Data are completely open access under the Creative Commons BY license. You have the permission to use, distribute, and reproduce these in any medium, provided the source and authors are credited.
The data produced by third parties and made available by Our World in Data is subject to the license terms from the original third-party authors. We will always indicate the original source of the data in our documentation, so you should always check the license of any such third-party data before use and redistribution.
All of our charts can be embedded in any site.