Fish and Overfishing
How are fish stocks changing across the world? How much is overfished?
This article was first published in October 2021 and last updated in March 2024.
Acknowledgements
Many thanks to Ray Hilborn, Michael Melnychuk, Max Mossler, and Daniel Hively from the RAM Legacy Stock Assessment Database for providing data and feedback for this project.
See all interactive charts on fish and overfishing ↓
Related topics
Other research and writing on fish and overfishing on Our World in Data:
- The world now produces more seafood from fish farms than wild catch
- Conserve and sustainably use the oceans, seas and marine resources
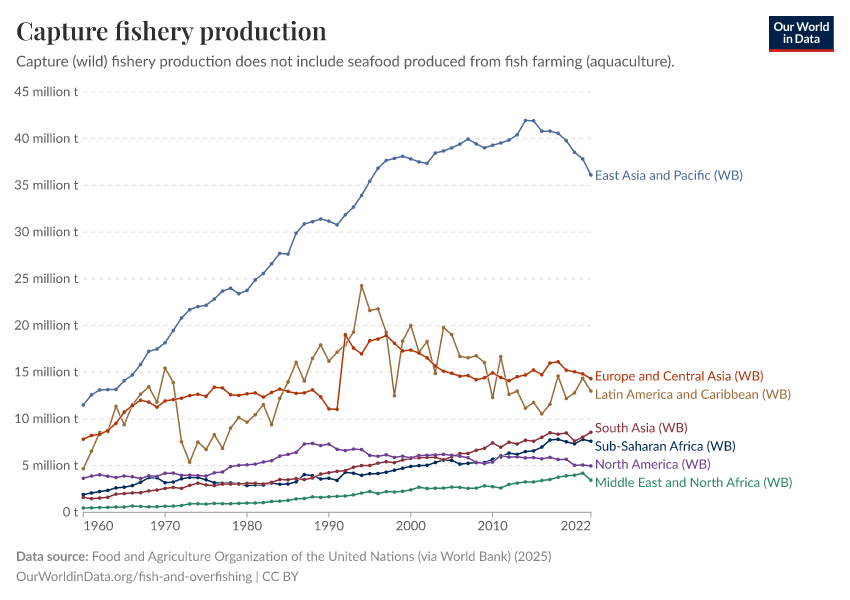
Fish production
Total seafood production by country
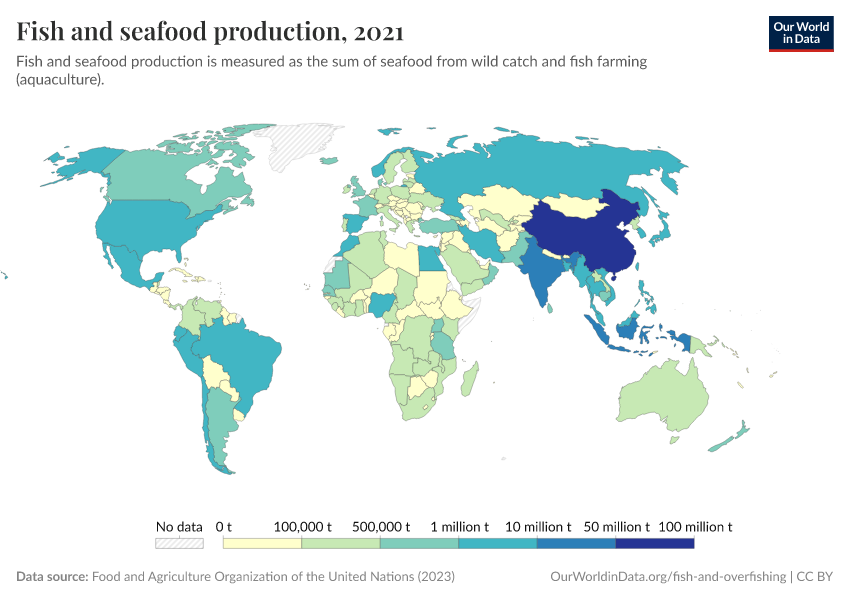
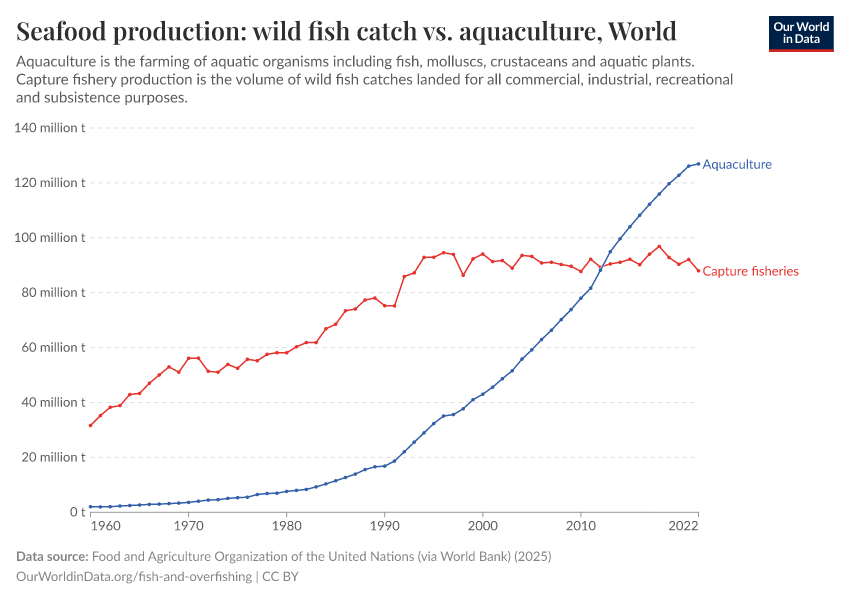
The world produces around 200 million tonnes of fish and seafood every year. This comes from a combination of wild fish catch and fish farming. In fact, the rapid growth of aquaculture over the last few decades means we now produce more seafood from fish farms than we do from fisheries.
Which countries produce the most seafood?
We can break this down by wild catch and fish farming. But let’s first look at total production from the sum of these two methods. This is shown in the map here. China is the world’s largest seafood producer.

Wild fish catch
The chart here shows the distribution of wild fish catch by country. This is total seafood production minus aquaculture (fish farming).
By clicking on any country, you can see how its production has changed over time.

Aquaculture production
The two charts here show the distribution of fish farming (also known as ‘aquaculture’) by country. First is the global distribution, as shown on the map. Second, as in the regional breakdown, you can also add and compare countries using the “Edit countries and regions” button.
Most of the world’s growth in aquaculture production has come from East Asia and the Pacific. For example, China produces more food from aquaculture than any other country.
This growth in aquaculture has played an important role in increasing global seafood production without sacrificing fish stocks. Production has continued to grow while the output of wild fisheries has slowed or even plateaued. This allows us to maintain sustainable fishing levels that do not deplete wild fish populations.


Long-term trends in fish catch
Most records of global fish catch only date back decades. But, of course, fishing is an industry that dates back much further.
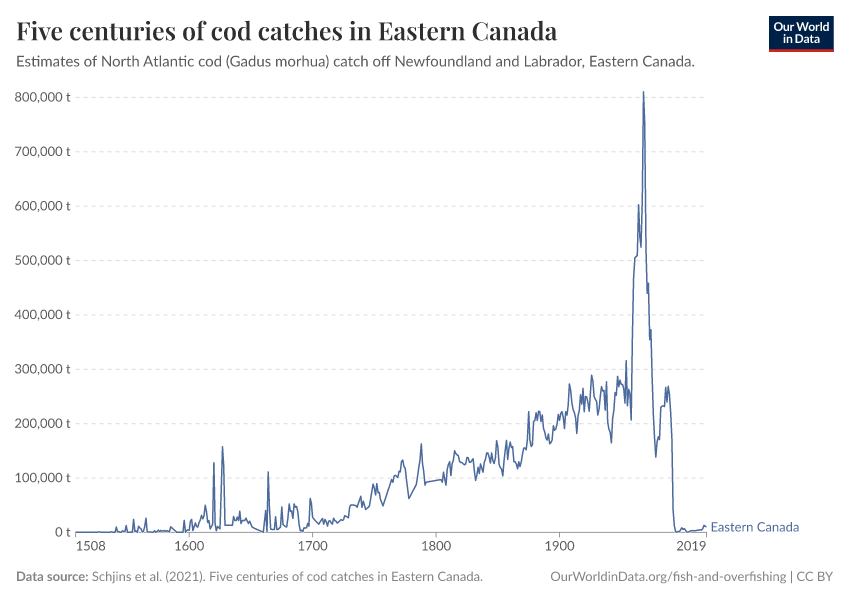
We don't have good global records that go so far back in time, but we can draw upon data from some rich countries that have statistical records dating back centuries. This gives us insights into how modern-day fishing compares to the more distant past.
In the chart here, we see five centuries of cod catch in Eastern Canada.1 These fishing records date back to the year 1500. We see that fish catch started to increase from around 1700 through to the mid-20th century. It peaked in 1968 before a collapse in fish stocks led to a dramatic decline. In fact, fisheries were forced to close 24 years later, in the early 1990s. Since then, stocks have not been able to recover due to the reopening of fisheries and their overexploitation afterward.

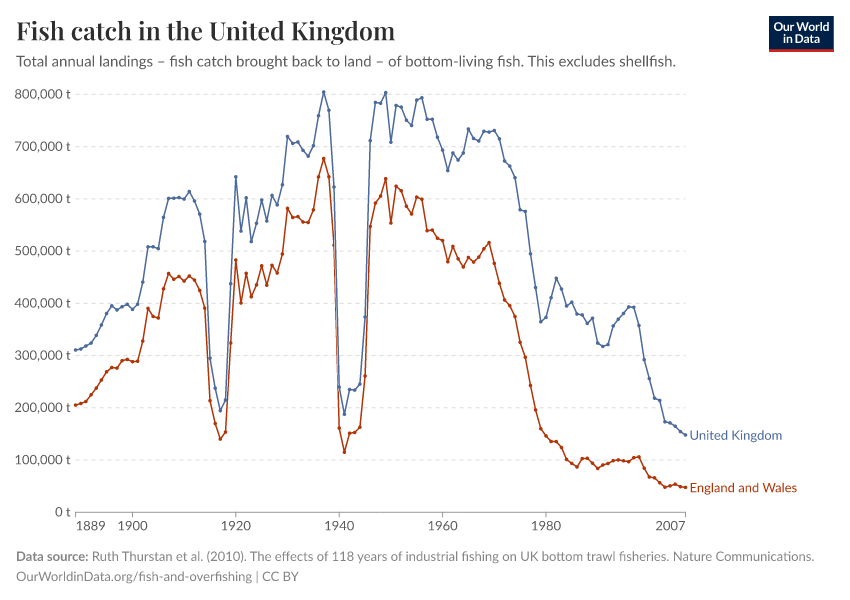
Historical records from the UK give us a further understanding of the long-term trend in fisheries. In their paper, published in Nature, researchers Ruth Thurstan and colleagues reconstruct UK fisheries trends dating back more than a century.2 This measures the catch of bottom-dwelling fish – excluding shellfish. We see a steep rise in fish catch over the first half of the 20th century. The development of steam trawlers in the 1880s allowed vessels to fish further offshore, for longer periods of time, and with gear that could reach deeper into the ocean.
This increase in fish catch was interrupted by the two World Wars: we see the dramatic declines in catch shown on the chart. This inter-war decline was due to a couple of factors: fishing became much more dangerous, and vessels were redirected from fishing towards military and other uses.3
Even after the World Wars, the fish catch began to dramatically decline over the second half of the 20th century. We might hypothesize that this decline was the result of reduced fishing efforts. But, this is not reflected in the data on fishing activity. When we look at the amount of fish caught per unit of fishing power (the number of fishing vessels multiplied by the fishing effort per vessel) we also see a dramatic decline.
This shows the reduction in catch has been driven by a decline in the availability of bottom-living fish rather than changes in fishing efforts.

Methods of fishing
Trawling, dredging, and pole-and-line: what methods do we use to catch fish?
Say the word ‘fishing’, and very different images come to mind. Some of us might picture a lone fisherman with a wooden fishing rod. Others will picture a 100-meter-wide net being dragged along the seafloor by an industrial ship.
There are a variety of ways to catch fish. These matters because they depend on what fish we want to catch, how much fish we can catch (and ultimately, the amount of fish we have to eat and the income fishers get), and what the ecological impacts are.
Discussions on fisheries can be full of jargon. If you’re not familiar with this research, it can be difficult to understand exactly what each method looks like and what it entails. To make this easier, I have created the following visualization, which presents an overview of the most common fishing methods. This is based on summary visuals from the Marine Stewardship Council.
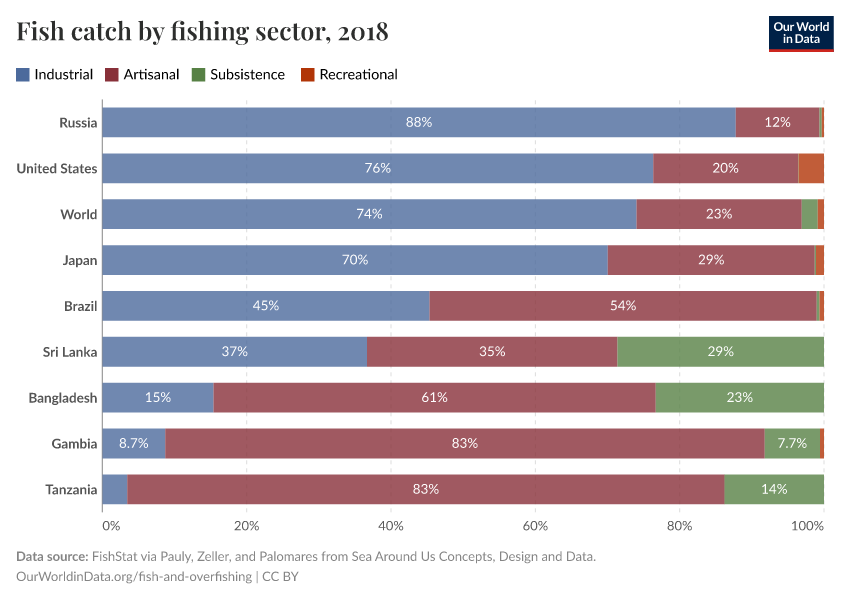
This gear is used across the world, but there are some general patterns where certain methods are more widely used. Pole-and-line, longline, and gillnet methods are more common in lower-income countries where much of the fishing activity is subsistence or small-scale. Purse seine and trawling methods are more common in industrial fishing practices; these tend to catch more fish per unit of effort. However, the downside is that they tend to have larger negative impacts, with more bycatch (catch of fish that are not the target species) and, in some cases, damage to the seabed.
How much fish do we catch from each method?
Now that we have some understanding of what each of these methods means, let’s look at how common each is.
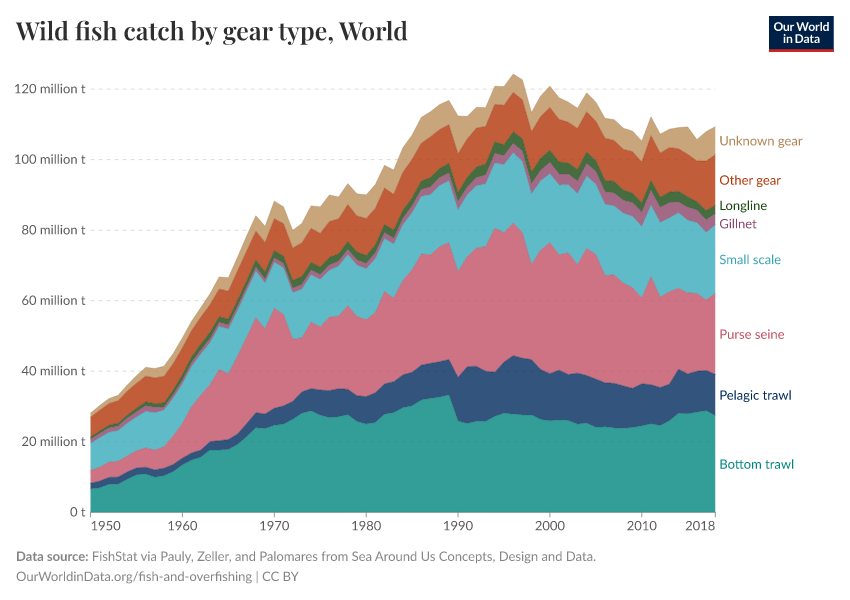
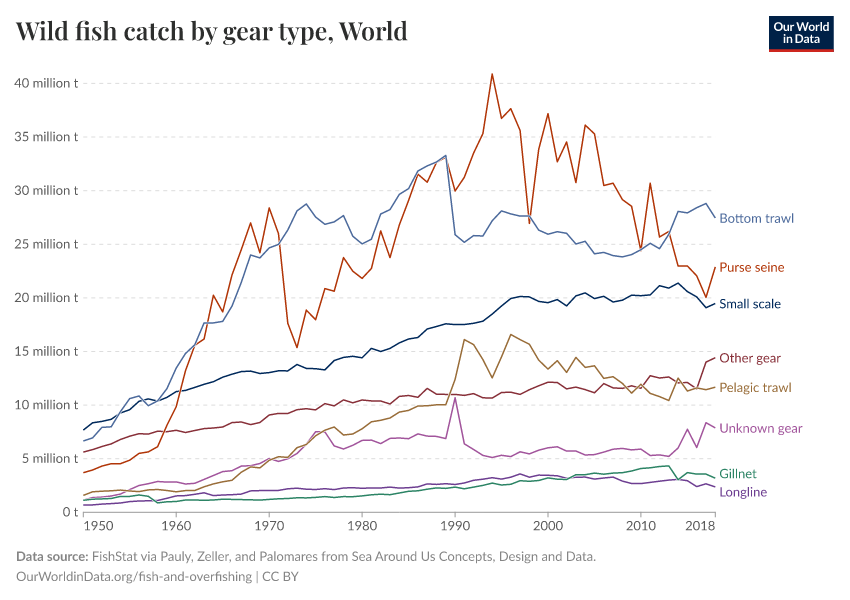
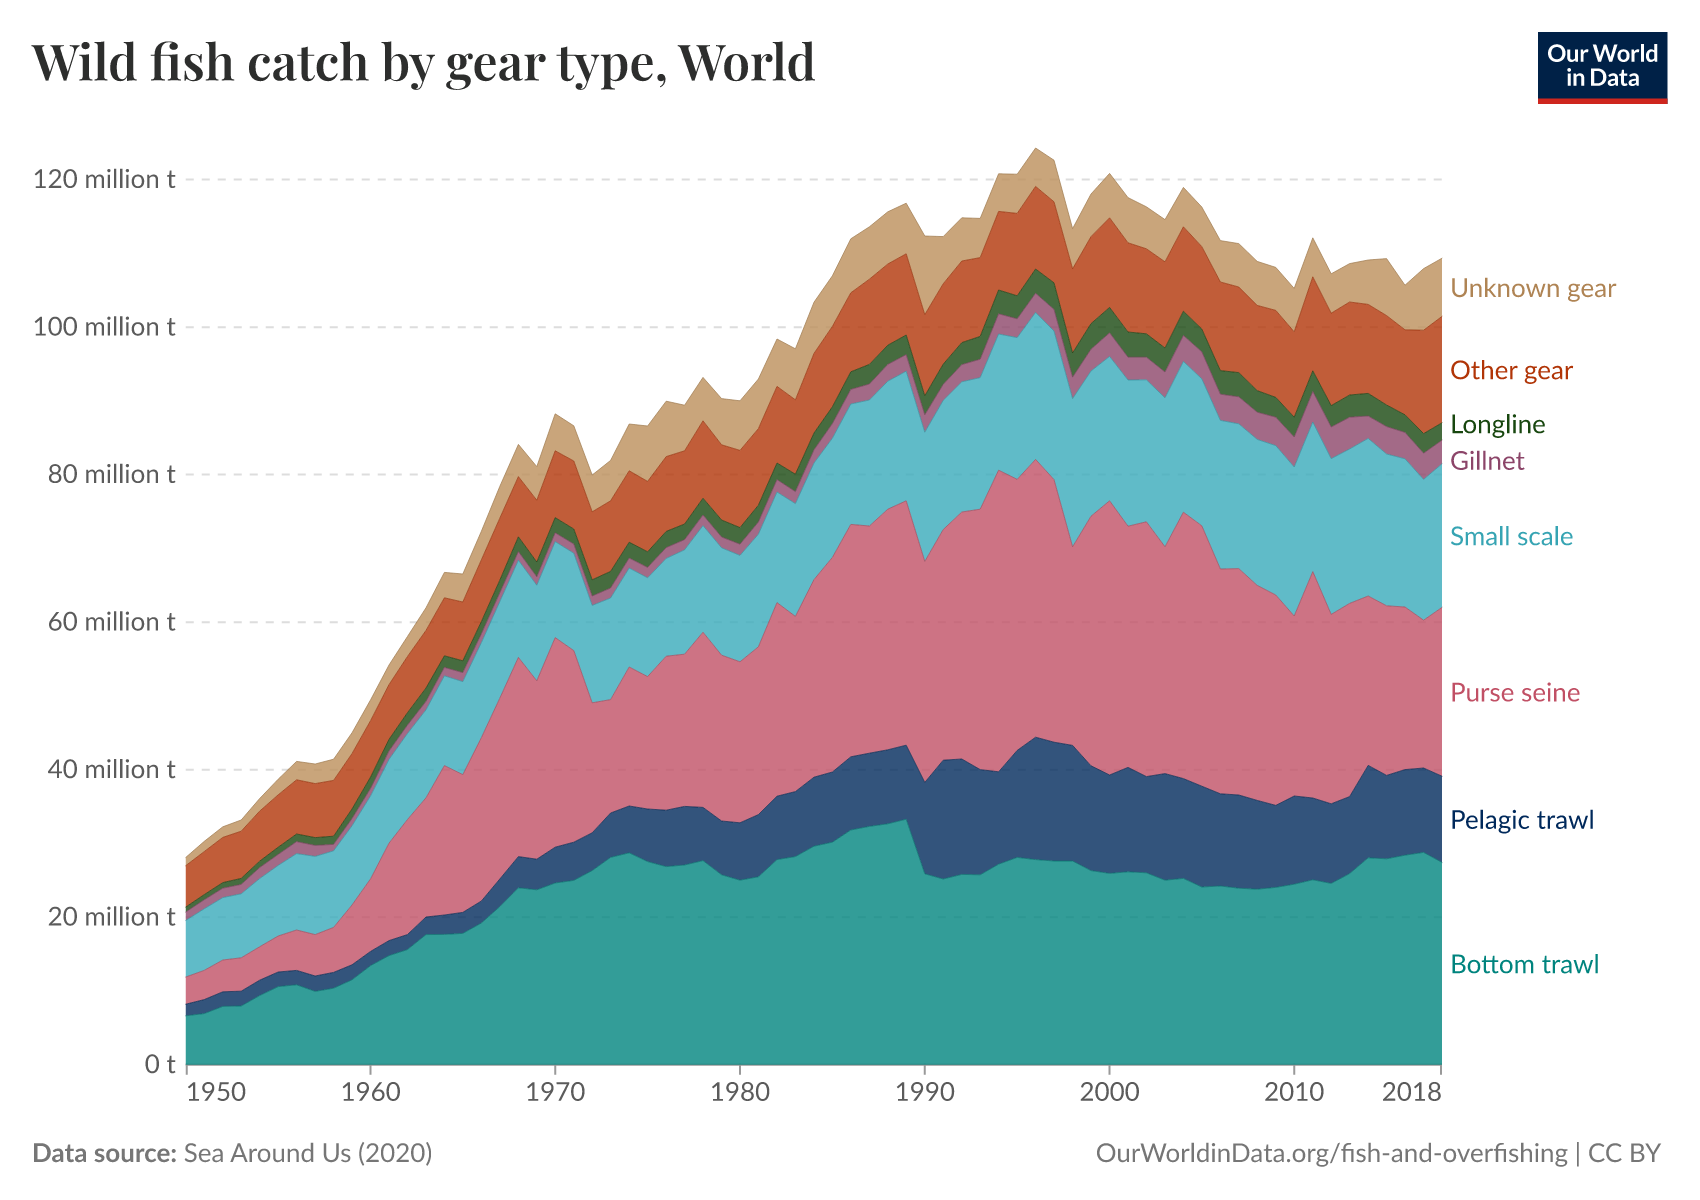
In the charts, we see the breakdown of global wild fish catch by the type of fishing gear used. This data is sourced from the Sea Around Us database, published by Daniel Pauly, Dirk Zeller, and Maria Palomares.4
Globally, bottom trawling is the most common method, accounting for one-quarter of fish catch. Pelagic (midwater) trawling accounts for an additional 10%. This means all types of trawling account for just over one-third of global fish catch. Purse seine fishing is the second most common method, accounting for just over 20% of the catch.
Gillnets and longlines account for much less of global fish catch. This is partly a result of the fact that they achieve less catch per landing than methods such as trawling or purse seine.
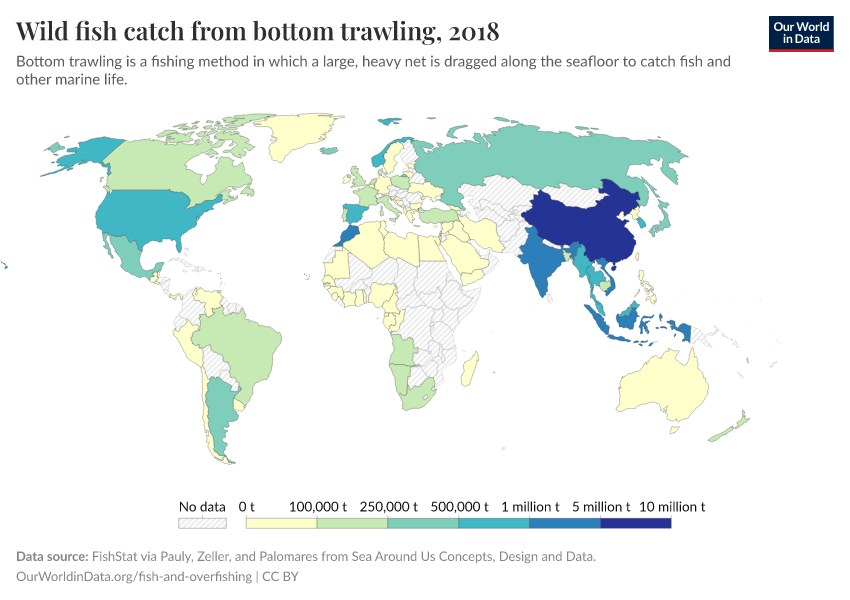
It’s interesting to see how common methods are across different countries. You can explore this data for any country using the + ‘Edit countries and regions’ on the interactive charts. For example, we see that bottom trawling is the dominant method used in China.
In contrast, bottom trawling is becoming less common across Europe. In many countries – such as the UK, Spain, and Portugal – bottom trawling was intense throughout the 1950s, 60s, and 70s but has since declined significantly. That has been partly driven by efforts to reduce overfishing and allow fish stocks to rebuild. In addition, the European Commission banned bottom trawling in deep waters – those below 800m in depth – in 2016.
In countries where most fishing is subsistent – Bangladesh is one example – it’s small-scale fishing practices that dominate. Large-scale practices are almost non-existent.
Finally, we see that larger-scale practices are growing in some countries as they transition from small, subsistence fishing to larger industrial practices. In Ghana, for example, purse seine is one of the most common forms of fishing.


Fish consumption and nutrition
Fish and seafood is an important source of nutrition for many people across the world. Not only does it provide an important source of protein, but fish also contains other nutrients and vitamins that are important for overall health, such as vitamin A, calcium, iron, and omega-3 fatty acids.5
How much fish do people across the world eat, and how much of our nutrition does it provide?
How much fish do people eat?
Some countries in the world eat close to 100 kilograms of seafood per person each year. Others average only a few kilograms.
In the charts here, we see the average per capita consumption of fish and seafood across the world.6 The highest seafood consumers are countries including Iceland, the Maldives, and Hong Kong. Contrast that with those at the bottom of the table: landlocked countries such as Mongolia, Afghanistan, and Niger understandably eat relatively little fish.
There is a strong relationship between income and overall meat consumption: as we get richer, we tend to eat more meat. This relationship is not as strong for seafood. Many lower-income countries rely on subsistence fishing as a key food source.


How much of our protein comes from seafood?
How much of our total protein, from plant and animal sources, comes from seafood? In the chart here, we see the per capita protein intake from different sources across the world.
Globally, less than 10% of total protein intake comes from seafood.7
In some countries, it accounts for a much larger share: around one-third in the Maldives and one-fifth in Japan, Iceland, and Cambodia.

How much of our animal protein comes from seafood?
It’s possible to get all of the protein we need from plant sources. However, to get all of the amino acids (the building blocks of protein) from a plant-based diet, one needs to have the right variety of foods. It requires a balance of staples such as cereals and more complete proteins such as legumes (peas and beans). Unfortunately, many in poorer countries are heavily reliant on cereals and lack this dietary diversity. In this case, animal protein sources can be vitally important for human health.
So, how much of our animal protein comes from seafood? Globally, around one-sixth of our animal protein comes from seafood.7 In the charts here, we see the breakdown of animal protein consumption by country.
In some countries, seafood dominates. It accounts for the majority of animal protein in Cambodia, Bangladesh, and the Maldives.
For billions of people across the world, fish is an important source of nutrition.

Employment and livelihoods in fishing
How many people are employed in fisheries and aquaculture?
Fish plays an important role in nutrition for communities across the world. For many, it is a key source of high-quality protein and provides other vital micronutrients for health.
However, people also rely on fishing and fish farming as primary sources of income. How many people are employed in these industries?
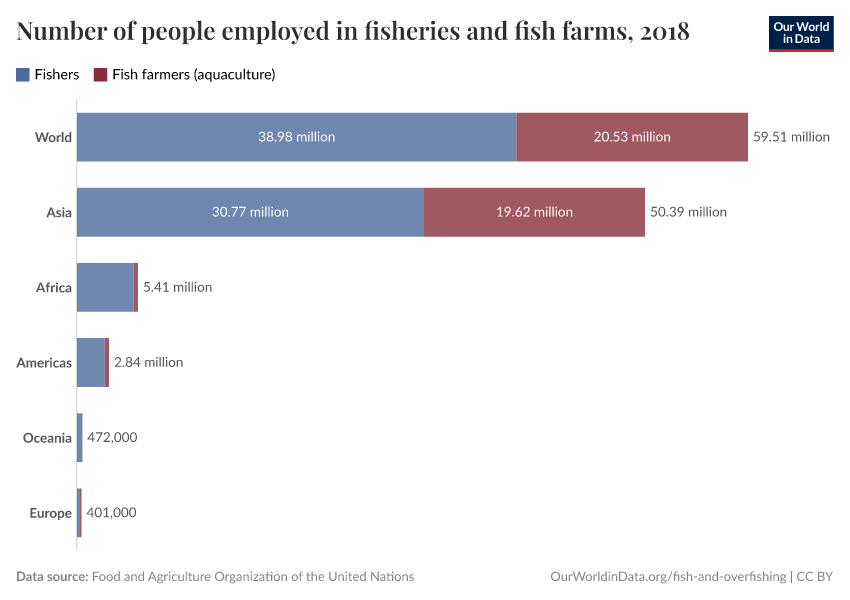
The UN Food and Agriculture Organization (FAO) estimates around 60 million people globally are employed as fishers (catching wild fish) or fish farming (aquaculture). The breakdown of employment by region and the split between fisheries and fish farming is shown in the chart.
More people are employed in wild catch than fish farming: a difference of 39 million to 21 million. Unsurprisingly, Asia is home to most of the world’s fishers and fish farmers.
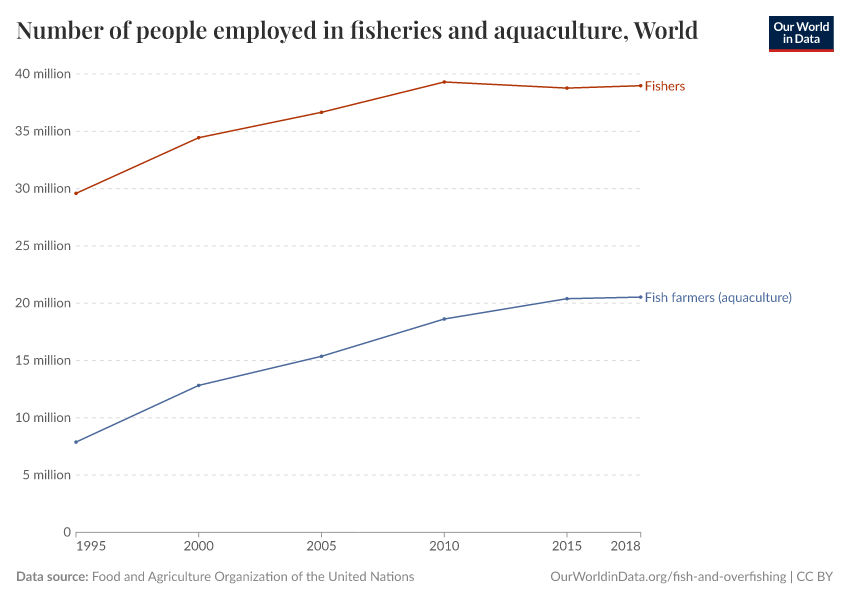
The following chart shows us how employment has changed over recent decades. Globally, employment in the industry has increased, but with much faster growth in aquaculture. In 1995, fish farming was a relatively small industry, but it has grown rapidly in the last few decades. More of our seafood now comes from aquaculture than from wild catch.
Employment in fishing has increased in every region except Europe. The number of fishers across Europe peaked around the year 2000 and has markedly declined since then [you can view these trends by region using the blue “Change region” button].
The seafood industry is not only an important source of nutrition for many; it is also a key source of income for millions of people. Both those employed directly as fishers or fish farmers and those employed through indirect jobs such as food processing, sourcing, and the management of fisheries.


Fish stocks and overfishing
What does sustainable fishing mean?
Is the global fishing industry sustainable? Which types of fish are we harvesting sustainably, and where are we overfishing?
These are critical questions, but to answer them, we need to first agree on what ‘sustainability’ actually means when it comes to fishing. One of the biggest conflicts I see is not actually about technical discussions of how much fish we catch or whether populations are increasing or decreasing, but a larger ethical conflict in how we view fish. When we view fish through different lenses, these debates don’t get very far.
One school of thought views fish as animals with their own inherent value. In this realm, our end goal is often to restore wild animal populations to as close to their pre-human levels as possible. Ultimately, this means we should be catching very little (if any at all).
The other school of thought views fish as a resource. Most of us eat fish; hundreds of millions rely on it for nutrition and income across the world. This is incompatible with restoring populations to their historical levels because we can’t do that and catch lots of fish at the same time. Sustainability, in this view, means catching as many fish as possible without depleting fish populations any further. This ties in with the classic Brundtland definition of sustainability: “meeting the needs of the current generation, without sacrificing the needs of future generations”. We catch as many fish as possible to meet the needs of people alive today but don’t take too much such that populations decline, and this sacrifices catch for future generations.
We can see these two schools of thought emerge in the typical diagram of sustainable fishing. On the x-axis, we have fishing pressure; as we move towards the right, we catch a larger proportion of the fish stock each year. Fishing pressure tells us about the fraction of the fish population that is caught in a given year. Note that this measure is a flow – it is an input variable that changes over time.
On the y-axis, we have fish biomass, which is given as two variables. First, we have the fish catch – shown as the red line. This, again, is a flow variable. Second, we have fish stocks. The fish stock is the total amount of fish left in the population. It, as we'd expect, is a stock variable.
Let’s first look at the ‘stock’ line. This is the amount of fish we have in the oceans. It slopes downwards towards the right: if we fish very little, then lots of fish are left in the ocean, and as we increase fishing pressure, we deplete the amount of fish in our oceans. This makes sense.
Our first school of thought – that fish are not a resource but a wild animal population in their own right – suggests we should be aiming for the top-left corner. Fish populations are as close to pre-human levels as possible. To do this, we need to catch very little (if any) fish.
Our second school of thought – that fish are a resource – would consider the optimal level to be the red dot. This is what is called the ‘maximum sustainable yield’. This is a key concept in fishery research and industry. It’s the largest long-term average catch that can be taken from a fish stock under prevailing environmental and fishery conditions. If you get greedy and catch more than this, then you deplete populations for future generations. If you catch too little, then you’re sacrificing food and income for the current generation. Most fisheries are aiming for this sweet spot: catching not too much, not too little, just right.
The tension between these two schools becomes obvious. The optimal outcome is completely different. When the biomass of a fish stock is at the point where the ‘maximum sustainable yield’ can be achieved, it’s around half of its original virgin biomass.8 This level can vary between fish populations but is typically in the range of 37% to 50% of its pre-fishing levels. This may seem counterintuitive, but wild animal population growth rates are often greatest when the population size is moderate and before the population starts to reach its natural limit, or carrying capacity.
In other words, if you view fish as a resource, you probably want fish populations to be less than half the size of pre-fishing size in order to achieve the maximum sustainable yield.
Most of the research, industry, and policymaking is geared towards the second school: viewing fish as a resource. Therefore, much of our work on fish on Our World in Data will explore these concepts and explain what the research and data tell us about fish stocks, catch, and the sustainability of fishing across the world. However, we will also offer the perspective of the first school by looking at how fish populations have changed from their pre-human levels.
How much of the world's fish is managed sustainably?
Sustainable fishing, by its fisheries definition, is catching just the right amount. If you harvest too much, then fish stocks decline. If you catch too little, then you’re giving up valuable food resources and income. In the previous section, we take a closer look at different concepts of sustainable fishing and how this ‘sweet spot’ – the maximum sustainable yield – is defined.
How much of the world’s fish is caught sustainably?
This is often measured in terms of fish stocks. A fish stock is a subpopulation of a particular species of fish with common parameters such as location, growth, and mortality. Often, it’s a species of fish in a given location. Indian Ocean tuna, for example. Importantly, this metric treats each fish stock as being equal, regardless of how big each stock is. A stock where we catch 1000 tonnes is counted the same as a stock where we catch 10 tonnes.
When defining the sustainability of fisheries, we need to know three terms:
Overfished: this is sometimes termed ‘overexploited’. A fish stock with abundance below the biomass that would produce the maximum sustainable yield (MSY) is potentially considered "overfished". Fish stocks become overexploited when fish are caught at a rate higher than the fish population can support.
Maximally sustainably fished: this has sometimes been termed ‘fully fished’ or ‘fully exploited’ in the past. Some might interpret these terms negatively, but this is actually the ‘sweet spot’ that fisheries are aiming for. This is the maximum sustainable yield, where we’re catching as much fish as possible without reducing fish populations below the most productive level.
Underfished: this is when the fish stock is greater than the biomass that would produce the maximum sustainable yield. We could catch more fish without the decline of fish populations. From a resource point of view, this is suboptimal because we’re missing out on a key food source and income source from fishing communities.
The breakdown of these three categories is shown in the chart. Combined, underfished and maximally fished would be considered to be sustainable because fish stocks are not declining.
One-third (34%) of assessed global fish stocks were overfished in 2017. However, 60% were maximally fished, and 6% were underfished.
But this does not tell us how much fish was sourced sustainably. This is because fish stocks can be very different sizes. Let’s say we have two fish stocks. Stock A is sustainable, and we’re catching 80 tonnes of fish per year. Stock B is unsustainable, and we’re catching 20 tonnes from it. If we aggregate them, we’d conclude that only half of our fish stocks are sustainable, but 80% of our catch is.
When we adjust for the different amounts of catch from each stock, we find that almost four-fifths (79%) of fish catch is sourced sustainably. 21% of the catch comes from overfished populations.
Overall, two-thirds of assessed fisheries are sustainable, providing four-fifths of our seafood.
How is overfishing changing over time?
This gives us a static view of global fisheries, but how has this been changing over time? Are things getting worse?
The chart here shows the status of the world’s fish stocks from the 1970s. The share of overfished stocks has increased over the last half-century. In the 1970s, around 10% were overexploited. Although exploitation rates varied year-to-year, this generally increased through the 1980s, 1990s, and early 2000s. Over recent decades, there has been some variability, but overfishing has hovered around one-third globally.
Some regions are fishing much more sustainably than others. In the following section, we look at which are managing well and which are doing poorly.

Will the oceans be empty by 2048?
Sometimes, there are claims that seem so far-fetched that it’s hard to imagine they need to be addressed. But this is one that simply won’t die – it has been repeated so many times that many believe it to be true. It hit the headlines again after being featured in the popular Netflix documentary Seaspiracy earlier this year.
It made the claim that: "If current fishing trends continue, we will see virtually empty oceans by the year 2048". Seaspiracy is far from the first source to repeat this claim: Google “empty oceans by 2048,” and you will find hundreds of thousands of results.
What’s the story here? Where did this claim come from, and is it true?
Where did the “global collapse of fisheries by 2048” claim come from?
In 2006, the fisheries researcher Boris Worm and his colleagues published a paper in Science on the trends in biodiversity loss in the world’s oceans.9 The year 2048 and prospects for ‘global collapse’, were only mentioned once and featured in the conclusion of the article:
Our data highlight the societal consequences of an ongoing erosion of diversity that appears to be accelerating on a global scale. This trend is of serious concern because it projects the global collapse of all taxa currently fished by the mid–21st century (based on the extrapolation of regression to 100% in the year 2048).
How did they reach this conclusion? Well, they plotted the historical decline in ‘collapsed taxa’, as shown in the chart. If we take this black trend line and continue extrapolating it into the future, it will cross 100% in 2048. In other words, if we assume taxa continued to collapse at a constant rate, it would reach zero by mid-century.
This raises the important question of what the authors meant by the term ‘collapse’ and how it was calculated. They defined a ‘collapse’ as the case where fish catch was below 10% of their historical recorded maximum. Their data came from the UN FAO database on fisheries ‘landings’ (the amount of fish brought back to land). At the time, there was a lack of high-quality data on fish abundance, so there was only catch data to go on.
Unfortunately, this somewhat broad-brush projection was the highlight picked up by the media. The New York Times ran the headline “Study Sees 'Global Collapse' of Fish Species", and coverage snowballed from there.
Even if the authors’ projection did come true, and fisheries did collapse by 2048, the leap to “the oceans will be empty in 2048” is scientifically implausible. The definition of a fisheries collapse is not an ocean of no fish. Catch may be low because populations have been depleted. But there are clearly still fish: we're still catching them. Obviously, this is not an optimal place to be, whether you care about the fish or the fishers. But it does not mean an empty ocean.
As we will see later, this prediction has not played out in reality.
The authors no longer stand by their original claim
The aftermath of their paper in 2006 created a lot of uproar in the fishery research community. There were many rebuttal papers challenging this position.
The research community had previously been divided: one camp had a more optimistic take on the status of the world’s fisheries and prospects for the future; one had a more pessimistic take. Boris Worm fell into the latter.
To their credit, these two sides soon joined forces, working collaboratively to get a much larger and more rigorous overview of the status of the world’s fish populations. The figureheads on both sides of the debate – Ray Hilborn and Boris Worm – both featured in a debate on National Public Radio. In the aftermath, they formed a collaborative project facilitated by the National Center for Ecological Synthesis and Analysis (NCEAS) to get to the bottom of it.
Rather than relying on reported data on fish catch, the scientists set out to build a database on global fish stocks. This does not focus on the amount of fish being caught but the abundance of fish in each population. Scientists can do this through a combination of sonar acoustic methods (which lets them build a picture of the number and density of fish) and fishing (which lets them identify specific species in the ecosystem).
They published their results in 2009 in the journal Science.10 They concluded that although around two-thirds of assessed fisheries are below the biomass that would give us the maximum sustainable yield, catch is now within or even below sustainable levels in 7 of the 10 studied ecosystems. In other words, while many stocks are still in a poor state, things are improving across many ecosystems. The decline that Worm et al. projected in their earlier paper has not come true. Many fisheries are in a stable position and do not follow the projected curve of collapse.
The divergence of these two trends is shown in the chart. First, in red, we see the observations in the Worm et al. (2006) paper from UN FAO catch data. We see that by extrapolating the trend line, it will reach 100% in 2048. In blue, we see the more recent data from Worm and Hilborn’s collaboration on fish stock (abundance) data. It shows a more stable trend in collapse stocks over the last few decades.
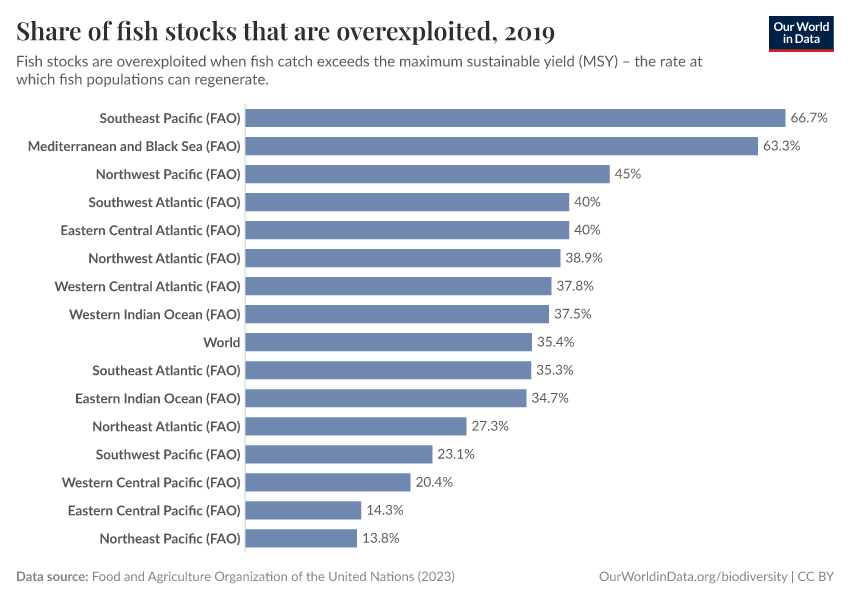
This mirrors the UN FAO's assessment of fisheries. It estimates that around one-third of the world’s fish stocks are overexploited: these populations are declining because we’re catching more fish than can reproduce. The other two-thirds, though, are sustainable and not in decline. The share that is overexploited has been relatively stable in recent decades. It has not continued at the rates predicted.
The most recent analysis of global fish stocks – published by the same group in 2020 – reaffirms this result.11 There are certainly fish stocks that are of major concern. But overall, the majority of regions where we have high-quality data are at least stable.12
To be clear, this does not undermine the fact that some of the world’s fish populations are struggling. Many are in trouble and are at risk of collapse if we do not take action.
But the notion that the world’s fisheries will collapse within decades is wrong. Even the original authors do not stand by this statement.13 The extrapolation of this original claim to the “oceans will be empty by 2048” is nonsense that does not reflect the science that underpins it.
What is the status of global fish stocks?
The health of the world’s fish populations is one of our biggest concerns when it comes to the sustainability of fishing.
Compared to other meats, seafood has a low environmental footprint when it comes to greenhouse gas emissions, land use, and nutrient pollution – we looked at this later on. But with wild fish populations, we have another dimension to consider: what’s happening to their population numbers. When we catch fish faster than they can reproduce, these numbers decline.
Earlier on, we looked at assessments of overfishing, and we found that around one-third of global fish stocks are overfished. [A ‘fish stock’ is a fish population in a given location – Bluefin Tuna in the Pacific Ocean, for example]. This is useful but doesn’t really tell us how fish stocks around the world are doing. As consumers, we want to know what types of fish to buy or where to source them. At the industry, national, or global level, we want to know this so we can take action on the stocks that are not doing well.
What do we know about the health of fish stocks across the world?
Data on global fish stocks is incomplete
There are several methods we use to better understand the health of fish stocks. One method is small-scale scientific surveys in specific regions. This certainly gives us some indication of fish populations, but they are often localized and don’t give us a complete health profile. The second is to do large-scale stock assessments. These assessments have become the bedrock of fisheries management.
The RAM Legacy database – first launched in 2009 – is led by a team at the University of Washington – and is the most widely used in research and is adopted by the UN Fisheries Division. Back in 2009, it covered 166 of the world’s fish stocks, which accounted for around 20% of global fish catch.10 Today, it covers over 1,200 fish stocks, which is more than 50% of the global catch.
It covers many of the world’s key fishing regions: the United States, Canada, Norway, Iceland, Europe, Peru, Chile, Argentina, high-seas tuna fisheries, New Zealand, and Japan, plus most of the major fisheries of South Africa and Australia.
Unfortunately, there are key regions where we have very little data. The database is missing data from most Asian, African, and Latin American fisheries. We see this in the map, which details the coverage of fish stocks in the RAM database. Most fisheries across Europe and the Americas have good coverage. Most fisheries across Asia do not.
We will soon look at what’s happening to fish stocks in the regions for which we have good data. But first we should see what we know (if anything) about the stocks that are missing.
How do fish stock assessments work?
Stock assessments are used by fisheries across the world to understand the health of fish populations and implement strategies to manage their fisheries. For example, they might be used to set catch limits at levels that are sustainable, given the dynamics and health of the fish population.
They are carried out using the ‘ABC’ method. This is the collection of three key metrics:
A = Abundance. Scientists use acoustics and other methods to monitor and estimate the abundance of fish at any given time.
B = Biological factors. Sampled fish are taken to assess the age and population growth rate of the population. For example, we might need to know the ratio of adult versus juvenile fish to estimate the reproduction rate of the population.
C = Catch. Data is collected on how many fish are being caught.
Scientists then used these three inputs – abundance, biology, and catch – to model the population dynamics of the fish stock. Abundance and biology tell us how many fish we would otherwise expect to be there before we remove any. Catch tells us how many we’re taking out. The balance of these two gives us an estimate of how many there really are.
Fish stocks are likely to be poor across much of Asia, Africa and South America
We don't have good stock assessments across Asia, Africa (except South Africa), and much of Latin America. But can we say anything about how they might be doing?
Well, first, the very fact that we don’t have good data is itself bad news. Managing the sustainability of fisheries is a delicate process – to do it well we need continual monitoring of the fish populations, their reproduction rate, and how much fish we’re catching. This balance can change from season to season or even month to month as environmental factors change and affect the dynamics of the ecosystem. Regions that manage fisheries well are constantly monitoring and changing catch limits when necessary.
Fisheries that are not carrying out these assessments will struggle to maintain this balance. That’s most of the fisheries across Asia, Africa, and South America.
Fishing pressure in many of these regions is intense. Bottom-trawling – where large fishing nets are dragged along the seabed – is very high in countries such as China, India, and Indonesia. Maintaining such high rates of fishing without monitoring them closely makes it unlikely that fish stocks are in a healthy state.
One of the ways that we can assess the pressure from trawling is to look at how many times a given area of the seabed is trawled. Some areas are only trawled once every few years. Others are trawled over and over. Research suggests that where stocks are healthy, a net only passes over the same spot once in a period of 3 to 10 years. Across Asia, it’s common for the same area to be trawled 3 to 10 times per year.
This has been confirmed by some smaller scientific surveys in the region. Scientific surveys have periodically monitored stocks in the Gulf of Thailand for decades. They show a large reduction in fish stocks over time. Other surveys of trawling efforts across the region show similar declines. Ask local experts about the state of fish stocks, and most have a similar take: they are in poor condition.14
Of course, it won’t apply to all fisheries across these regions. Some will be well-managed and healthy. But, based on what we know (and especially the fact that we don’t know a lot), the consensus is that many of these fish stocks are not in a healthy place.
Fish stocks across rich nations tend to be healthier
Let’s then turn to the health of fish across the regions for which we do have good assessments. It so happens that these tend to be richer countries: those across Europe, North America, Australia, and Japan. This database covers over 1,200 of these fish stocks, over half of the world’s fish catch.
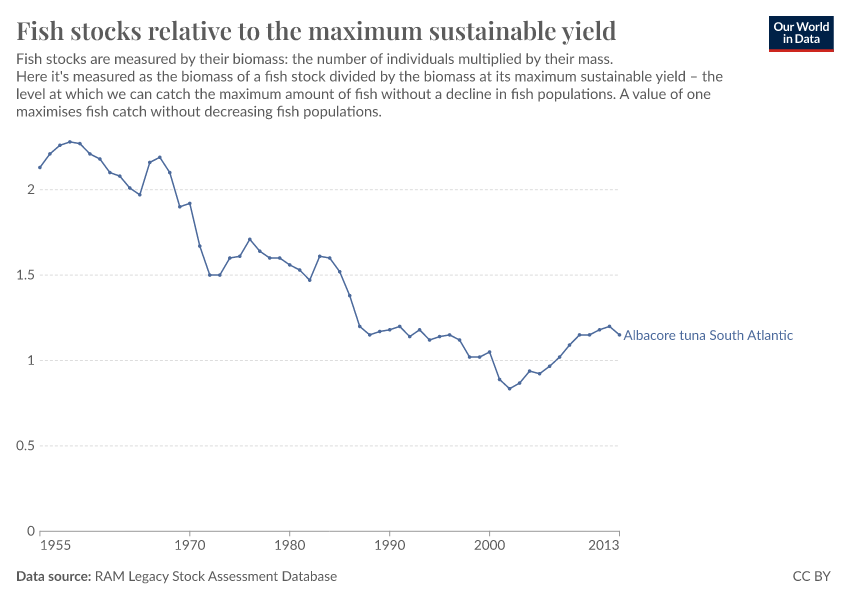
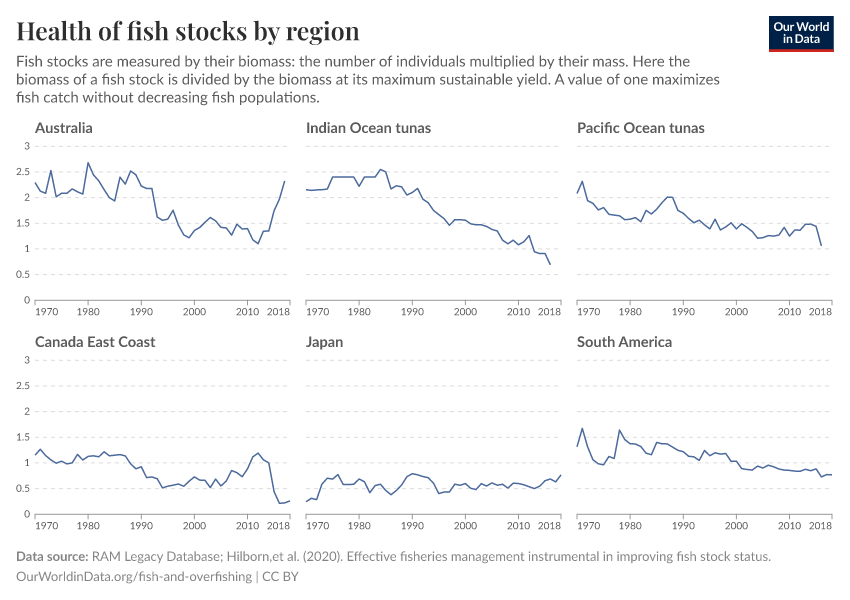
In the chart, we see how these stocks are doing. It shows the biomass of fish populations. That is, essentially, the amount of wild fish there. It’s the number of fish multiplied by their mass. Here, we’re measuring these stocks relative to the ‘maximum sustainable yield’. The maximum sustainable yield is the sweet spot where we can catch as many fish as possible without reducing the fish population below the most productive level.
A value of one is the ‘optimal’. We’re maximizing fish catch while keeping populations stable. A value greater than one is good for fish populations (there are more fish) but not good for humans since we’re missing out on fish catch. A value below one is not good: fish stocks are lower than we’d like, and while we might catch more fish in the short term, we will miss out in the longer term.
You can add more regions using the “Edit countries and regions” button.
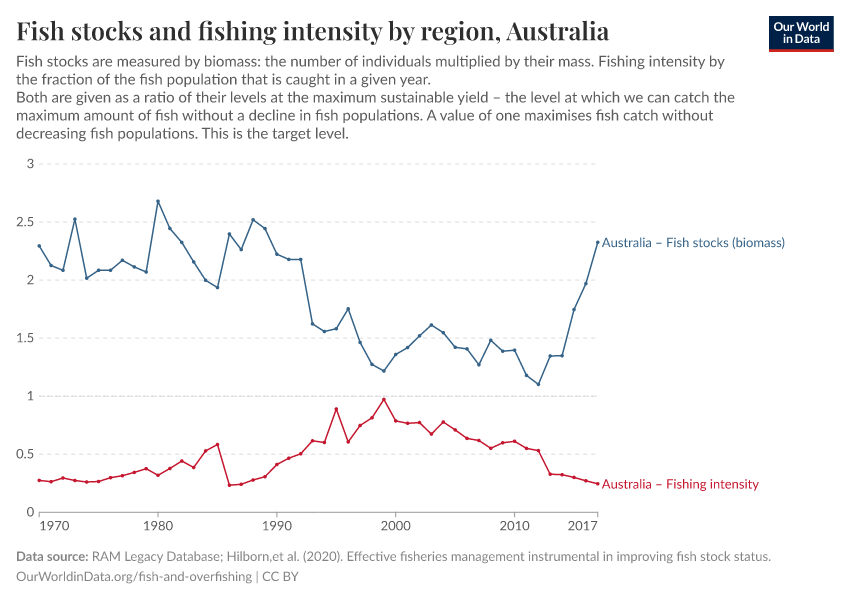
Fish stocks are healthy across most of these regions. Australia, Alaska, the US Northeast and Southeast Coasts, Japan, and Europe Atlantic are all above one another, hovering around this optimal value.
However, there are a few regions that are not doing so well. The Canadian East Coast has seen a large decline in recent years. Assessed stocks in South America and Africa are struggling. The European Mediterranean is not doing well. This is reflected in the fact that the Black Sea is very overfished.

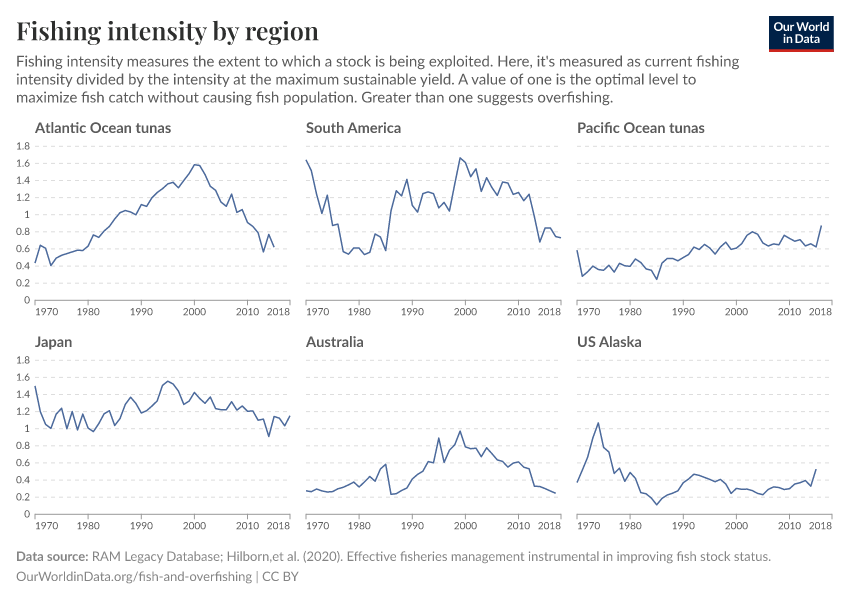
Whether a fish stock is doing well or not is mainly determined by its fishing intensity: what fraction of the population is being caught each year. Fish too much, and the population can’t be maintained.
In this chart, we see levels of fishing intensity across the same regions. Again, this is measured relative to the intensity at the ‘maximum sustainable yield’. An optimal value is one. If the intensity is greater than one, then we’re overfishing.
Fish stocks tend to be a lagging indicator of fishing intensity. So, if we hold fishing intensity too high (above one) – even if only slightly – then stocks will inevitably fall below one until fishing pressures are reduced.

Related chart:
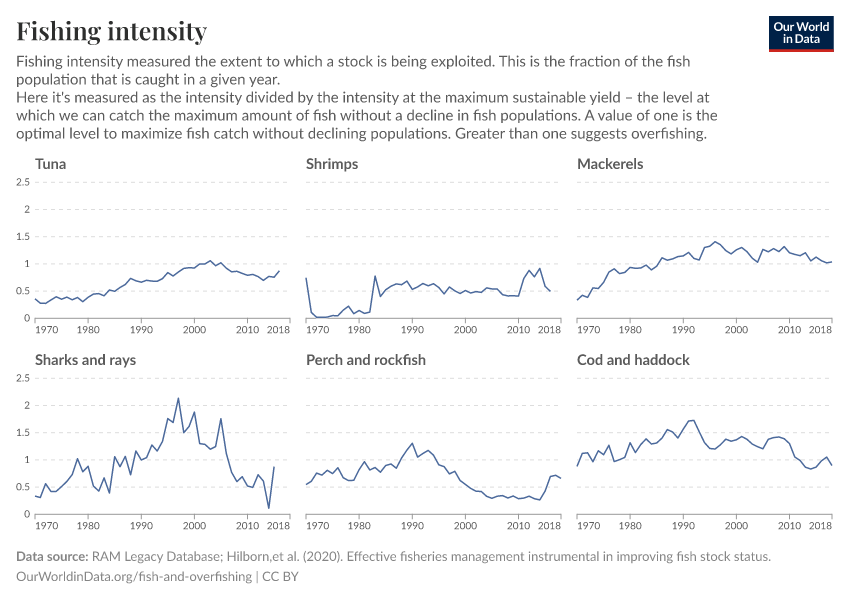
Tuna, cod, sharks: what is the health of different types of fish stocks?
The status of stocks across different regions might tell us where we might find healthy stocks – and, as a result, where we might want to source our fish from – but they’re averaged across many types of fish. It doesn’t tell us about what fish we might want to buy or avoid.
How are stocks of tuna, cod, mackerel, or sharks holding up?
In the chart, we see the same metric as before – fish stocks measured by biomass – across different types.
Across most of the main fish groups – tunas, shrimp, cod, and perch – stocks are at or above ‘one’ – the sweet spot where we catch as many fish as possible while keeping populations stable. That’s good news. Many of our most popular stocks are well-managed and have healthy populations.
A few groups are not faring so well. In recent years, mackerel have dropped below the optimal level due to increased fishing intensity. And sharks are declining rapidly – a worrying trend.
Let’s look at a few of these species in more detail: tuna, which is doing surprisingly well, and sharks, which are not.

Related charts:
Tuna
The health of tuna populations has been a concern for decades. We often hear that tuna are being overfished to extinction. That we should avoid them if we want to eat sustainably.
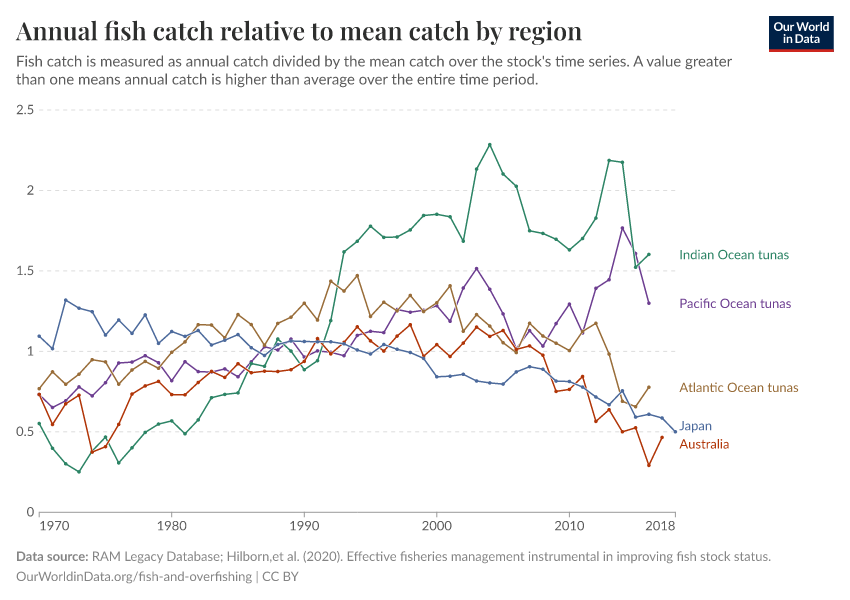
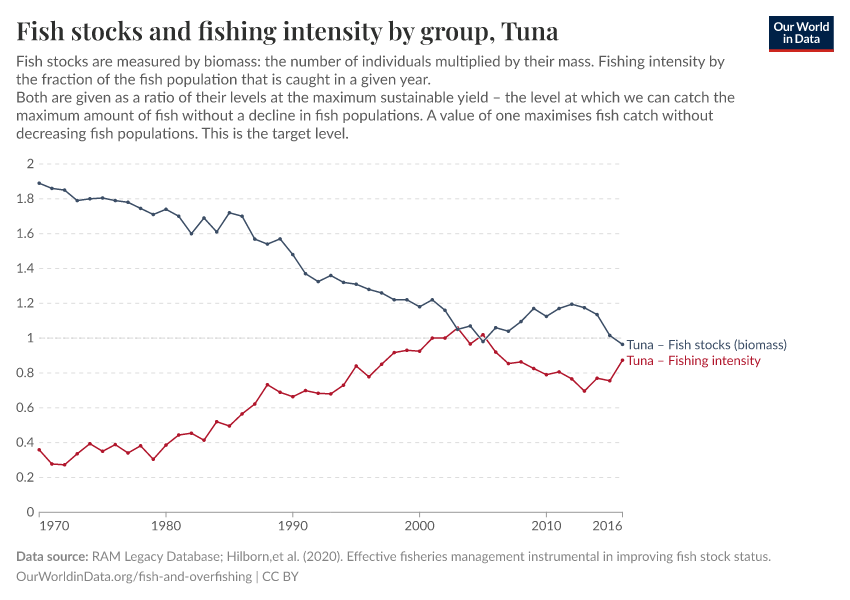
But many tuna populations are now well-managed. Previously, we looked at the aggregate of tuna stocks; we can zoom in further and look at particular regional stocks. In the chart, we see the health of fish stocks across three oceans: the Atlantic, Pacific, and Indian Ocean.
Tunas in the Atlantic and Pacific are managed close to their ‘maximum sustainable yield’. That’s positive news. The trend looks worse for those in the Indian Ocean. Its stocks have now fallen below one and look to be continuing downwards.
Atlantic and Pacific tuna might be a reasonable fish choice. Tuna from the Indian Ocean has less of a guarantee of being from a sustainable source.

However, we can go even further and look at specific tuna species, such as bluefin or yellowfin. We see these stocks in the chart.
Some tuna stocks have recovered through improved management – especially in the US and European waters. From the chart, we see that many are above one: the maximum sustainable yield.
Many of the tuna stocks that were the biggest concern have started to turn things around. We see this in this chart, which now shows fish stocks measured as their total mass in tonnes rather than relative to the maximum sustainable yield. Throughout the 1960s to 1990s, we see a massive decline in tuna populations. The Southern bluefin tuna by more than 90% – from over 8.5 million tonnes to less than one million. The Western Pacific yellowfin fell by three-quarters.
However, since the millennium, better management of fisheries and reduced overfishing have resulted in many of these stocks showing some signs of recovery.
Sharks and rays
While many of the world’s tuna stocks might be starting to recover, shark populations are declining. We previously saw that shark stocks were being overexploited and populations were declining. We see this again in the chart here.
What’s even more concerning is that this only tells us about assessed shark populations. Many more stocks have not been assessed – and these are likely to be in regions where monitoring is poor and illegal catch is poorly regulated. There, shark populations might be in even poorer health.
In general, sharks and rays tend to grow and reproduce more slowly than other fished species, meaning that it takes longer for individuals who have been caught to be replaced. This contributes to their increased extinction risk, reflected in the IUCN Red List. A third of the world's sharks and rays have been assessed as being threatened with extinction15. However, this slow rate of growth and reproduction is not true of all shark and ray species, and some species can support sustainable fisheries 16.

Explore global fish stocks in our data explorer
In our Fish Stocks Data Explorer, we present the key metrics for assessed fish stocks from the RAM Legacy Database.17 This provides a high-resolution breakdown of specific fish stocks across the world.
For general readers, this might be too detailed. However, it could be useful for those with a background in this area to explore specific fish stocks.
Environmental footprint of fishing
One of the best ways to reduce our impact on the environment is by changing what we eat. The research shows us that we can have the biggest impact by eating less meat and dairy. Or substituting lower-impact meats such as chicken and pork for beef and lamb.
But I’m often asked the question: “What about fish and seafood? Is that an environmentally-friendly option?”.
There are lots of types of seafood: not only different species but also ways of producing them. We can catch them in the wild or grow them in fish farms. But in most comparisons of food products, they’re aggregated into one or two categories, such as “marine fish” or “freshwater fish”. This doesn’t really inform us about what type of fish to eat.
Let’s take a closer look at the impacts of specific types of seafood.
Most fish have low environmental impact compared to other meats
‘Environmental impact’ can mean very different things: greenhouse gas emissions, land use, water use or chemical pollution. It’s useful to look at all of these impacts in case there are large trade-offs between them.
In a new study published in Nature, Jessica Gephart and colleagues conducted a meta-analysis of the impacts of fish and seafood across multiple environmental metrics.18 To do this, they combined life-cycle analysis data from studies of wild-caught and farmed seafood products. It covered over 1690 fish farms and 1000 records from fisheries.
These results look at the impacts on-farm and off-farm, up to the farmgate. That means up to the point that harvested or caught fish are brought back to land. It includes all of the inputs into production, such as fish feed or fuel use in fisheries. It does not include post-farm processes such as transport to retail, packaging, or cooking.19
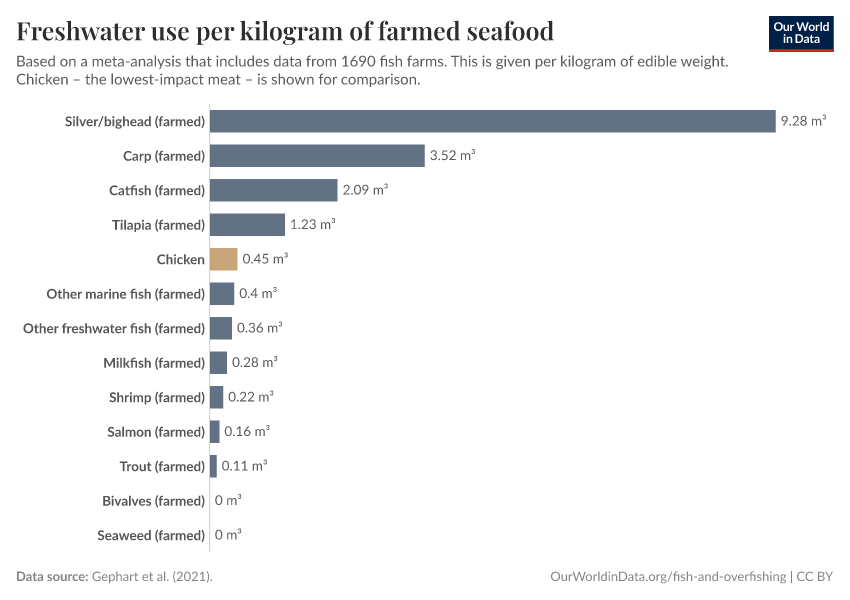
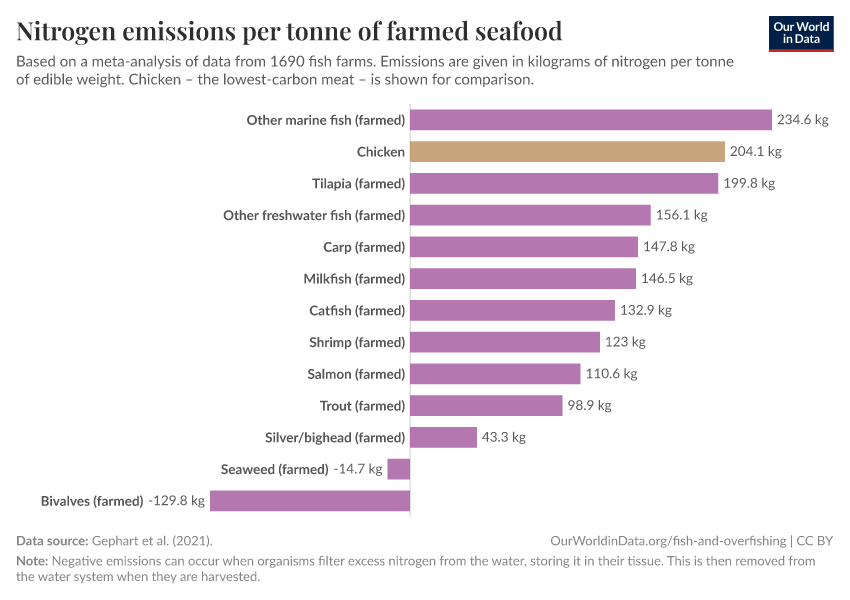
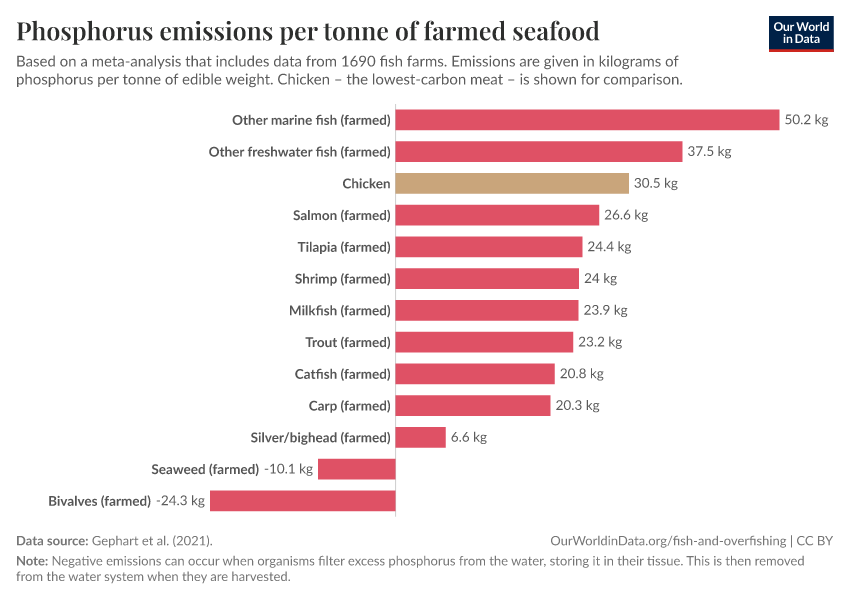
Here, we’re looking at five key metrics: greenhouse gas emissions, land use, freshwater use, and nitrogen and phosphorus pollution. This doesn’t include the sustainability of wild fish stocks, which is obviously another important metric that we need to consider. We looked at what’s happening to global fish stocks earlier on this page.
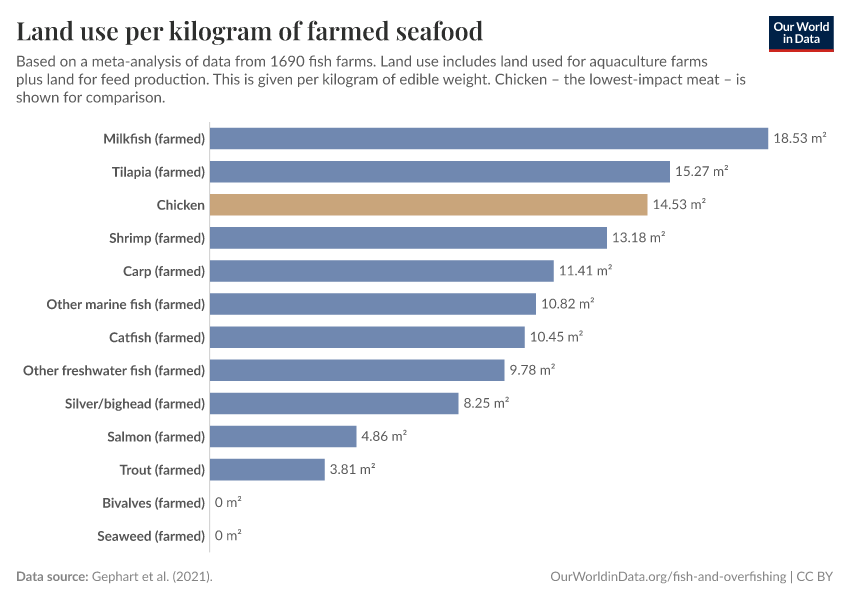
The impacts across the seafood products are shown in the charts. Here, we’re looking at the median across all of the assessed studies.20 These impacts are shown per kilogram of edible weight. That means we’re not including inedible parts such as shells or bones.
Comparing fish to other types of fish is useful. But we also want to know how seafood compares to other protein foods. So, we’ve included chicken for comparison.21 Chicken tends to have the lowest environmental impact of meat and dairy products – much less than beef and lamb and a bit better than pork. So when we make this comparison, we’re really seeing how seafood compares to animal protein with the lowest impact.
Overall, we see that a lot of seafood has a relatively low environmental impact compared to animal protein sources. Many types have a lower carbon footprint than chicken (those that are higher are around 20-30% higher). Most farmed seafood needs less land and freshwater and causes less nitrogen and phosphorus pollution. This is because fish tend to be more efficient than chickens in converting feed into meat, which means they need less feed per kilogram.
There are some exceptions, though: wild flounder, lobster, and shrimp, for example, can have a high carbon footprint. More than double that of chicken.


Related chart:
The impacts of seafood can vary a lot among species
Looking at the median footprints allows us to make quick, general assessments of the high- and lowest-impact species. However, they can hide the variability among a given species based on where and how it’s produced. This makes little difference for some species, but for others, it can have a large impact.
In the chart, we see the spread of greenhouse gas emissions among the different types of seafood. The median of each – as we looked at above – is shown as the thick black line for each bar. The width of the bar shows us how variable this can be: it tells us what the largest and smallest impact can be for each species. Wild-caught seafood is shown in blue; farmed seafood is in red.
Now we see that not only are there large differences in the median between each. There are also large differences in how variable emissions can be. In general, we tend to see that the impacts of farmed seafood are much less variable than wild-caught; the red bars are much thinner than the blue.
Let’s take salmon as an example. The median emissions for farmed and wild-caught salmon are similar; farmed has a slightly lower footprint of 5.1 versus 6.9 kg CO2e per kg. But the big difference comes from the spread of emissions: wild-caught can range anywhere from 1.7 to 17 kg CO2e. That’s a ten-fold difference. Farmed salmon only ranges from 4.1 to 6.2 kg CO2e, a 50% difference between the minimum and maximum. If you choose wild-caught salmon, you could be picking a low-carbon or a high-carbon protein source. It might even be lower than farmed salmon. But if you pick farmed salmon, you are almost guaranteed that it will be relatively low-carbon. We see this across other species, too: see shrimp, for example.
The same is true in our comparison to chicken. Chickens have a very low footprint variation. Wild-caught fish such as salmon or tuna can have a lower or higher footprint depending on where and how it’s caught.
Some choices that will guarantee a relatively low footprint are farmed bivalves (mussels, oysters, and scallops) and seaweed – these are filter-feeding organisms that also sequester carbon and nutrients in their shells. That is partly why they have such low emissions, and they need no additional land either. Farmed salmon, trout, carp, and catfish are also good choices.
Should we eat seafood as part of a sustainable diet?
What do these results tell us about how seafood fits into a sustainable diet?
Again, we should be clear that the most effective way to reduce the impact of your diet is to eat less animal-sourced products overall. On the basis of total protein and calories, plant-based foods such as legumes and soy still have a much lower impact. However, for those who do not want to eliminate animal products completely, seafood can be a good choice. Many types of seafood have a lower impact than chicken. This means they have a much lower impact than foods such as beef or lamb.
As we saw earlier on this page, the status of wild fish stocks is mixed. Effective management of fisheries across Europe and North America means that many of these fish stocks are stable and no longer in decline.11 Unfortunately, we know much less about the health of fish stocks across Asia and much of Africa, but many of these stocks are likely to be overfished. That matters for where you source wild-caught fish; sourcing from European or American fisheries might be a safer choice if you want to ensure they are sustainable.
The issue of wild fish stock depletion is not an issue for farmed seafood. As these fish tend to also have a low carbon and land footprint, farmed fish can be a low-impact source of protein.
Dredging and trawling
Most of the fishing methods we use have some kind of environmental impact – whether it’s burning fuel in fishing boats, unintentionally catching fish or marine animals we don’t want (bycatch), or leaving behind remnants of fishing gear. But dredging – sometimes referred to as bottom trawling – has the largest negative impact.
Bottom trawling drags a structure along the seabed – at various depths in the sediment, depending on the specific method – to dislodge organisms such as crustaceans. It’s an incredibly efficient way to catch seafood. That’s why it’s so common: one-quarter of the world’s fish are caught this way. But it usually comes at an environmental cost.
In this section, we look at how much of the seafloor is trawled, what the consequences are, and what we can do to reduce its impacts.
How much of the seafloor is trawled?
Let’s first look at the question of how much of the seafloor is affected by trawling. Improved satellite and GPS tracking technologies mean that scientists can now map trawling patterns at high resolution.
In a paper published in Nature, Enric Sala and colleagues estimate that around 5 million square kilometers (km2) of seabed is trawled each year.22 In the chart below, I’ve put this into the context of the global seabed area as a whole.
The total ocean seabed spans 361 million km2.23 That’s the top bar in the chart. Most of this is deep ocean, far from the world’s continents, and at depths that we rarely visit. Around 10% of the world’s seabed is shallower than 1000 meters – this threshold includes all of the world’s continental shelves and areas that we’d fish in. That means 37 million km2 of seabed is within our scope. That is shown by the second bar.
Our 5 million km2 of trawled seabed – shown as the bottom bar – is therefore equal to around 13.5% of the explorable seabed. In the context of the total seabed area, it’s 1.4%.
Many have compared this area to the Amazon Rainforest.24 To some extent, the areas do match: the Amazon rainforest spans approximately 5 million km2. But we should be careful about using this comparison. Trawling does not have the same impact as cutting down a primary rainforest. As we will soon see, trawling does kill a lot of life on the seabed, but recovery times can be very quick: in the order of a few months to years. When we cut down the primary rainforest, we lock ourselves into a recovery period of many decades. Maybe even longer.
What’s also important to note is that the same areas are often trawled again and again.25 What this means is that it’s not a different 5 million km2 that’s trawled every year. If that were true, within five years, almost all of the shallow seabed would be trawled. Thankfully, that’s not the case.
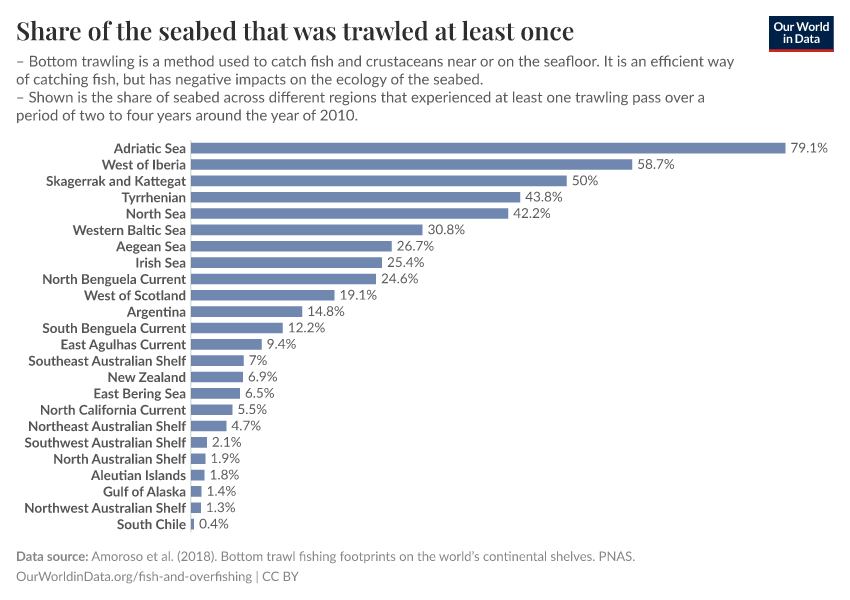
The extent of trawling varies a lot from region to region. In a study published in PNAS, Ricardo Amoroso and colleagues mapped the extent of trawling across different regions.26 They monitored the share of continental shelves – to a depth of 1000m – that was trawled at least once during a period of two to four years.27 Some regions – such as South Chile, Alaska, and the Australian shelves – experienced almost no trawling at all. Others experienced a lot. 80% of the continental shelf in the Adriatic Sea was trawled. 42% of the North Sea was trawled. One-quarter of the shelf in the Irish Sea was. You can see these rates by region here.
What impact does trawling have on wildlife?
Passing a trawl over the seabed can have quite a severe impact on the organisms that live there. How much of the biota is affected depends on a couple of factors, including the type of gear used, the type of sediment, and what lifeforms live there. We might imagine that a coral that sticks out from the seabed will be destroyed while organisms deeper in the sediment might survive.
Researchers have carried out studies to see what impact trawling has on wildlife – either through experimental methods or observing real-world impacts. In an analysis published in PNAS, Jan Geert Hiddink and colleagues brought these experiments together to build a complete picture.28
The impact of trawling really depends on the type of method and gear that’s used. We see that in the chart below, which shows the impact of four types: otter trawling, beam trawling, towed dregs, and hydraulic dredging. On the y-axis, we have the share of organisms that are removed or killed by a single pass of a trawl over the seabed. On the x-axis, we have the depth of the ocean sediment that the trawl reaches.
What we see clearly is that the deeper the trawl digs into the sediment, the more biota we kill. Otter trawls have the lowest impact: they dig just 2.4 centimeters into the sediment, and around 6% of organisms are lost. Beam trawls lose 14%. Towed dredges dig twice as deep, and one-fifth of organisms are killed off. The most damaging method is hydraulic dredging: it digs deep into the sediment at 16 centimeters, and 41% of organisms are destroyed as a result.
Once this area has been affected by trawling, how long does it take for its biodiversity to recover?
For the ecosystem to get back to its pre-trawling state takes a few years if it’s left alone. In their analysis, Hiddink and colleagues found average recovery times (where ‘recovery’ means getting back to 95% of pre-trawling biomass levels) in the range of 1.9 to 6.4 years. The differences here were dependent on the method used – the shallower otter trawls caused less damage and recovered more quickly than the deep hydraulic trawling – and the environmental context, such as the type of seabed. This finding was consistent with previous studies, finding recovery to be in the range of years [this study, for example, reports a 4-5 year recovery time across multiple commercial trawling sites].29
Several years might seem like a long time, but it’s actually pretty fast for an ecosystem to recover. This is why I don’t find the comparison between dredging and rainforest clearing to be a particularly helpful one. If we cut down the Amazon rainforest, it will be decades, if not centuries, before it gets back to its previous state. Thankfully, these seabed communities recover orders of magnitude more quickly. But, of course, they only recover if we leave them alone.
Many countries have reduced the use of trawling
How is bottom trawling changing across the world? Is it becoming more or less common?
Globally, bottom trawling rapidly increased through the second half of the 20th century. But it has not changed much since the 1990s. We see this in the chart.

What has changed is where bottom trawling is happening. Trawling rates were very high across Europe in the 1950s, 60s, and 70s. However, growing concern about the depletion of wild fish stocks has led to a significant reduction in recent decades to allow populations to recover. The cases of the UK, Portugal, and Spain are shown in the chart. Portuguese catch from bottom trawling has fallen by 90% since the 1960s.30 In 2016, the European Commission also banned bottom trawling in deeper water below 800 meters. We see the same in Japan, where the catch peaked in 1972 at 4 million tonnes and has since fallen by around 90% to 400,000 tonnes.
Bottom trawling has been growing elsewhere, though. It has been growing rapidly in China and India since the 1980s. Although these rates have stabilized – or even declined – in the last few years.

What can we do to reduce the impacts of trawling?
Since most methods of trawling create environmental damage, you might suggest that the best option is to eliminate it completely. But in reality, it is still the most efficient method of catching seafood – which is why so many countries continue to use it. We can limit the use of trawling, which, in fact, many countries have. We just saw examples of this across Europe and Japan. But this will come at the cost of catch and income for communities that rely on it.
If we can’t – or don’t want to – eliminate it completely, there are still things we can do to limit its impacts. The types of gear used for trawling can have very different impacts. Some are much more damaging than others. One option is, therefore, to ban specific types of gear rather than completely ban the practice.
Another option is to modify the types of gear used to limit their damage to the seabed. For example, the doors on otter trawls are very destructive; newer designs now limit the amount of impact these doors have on the seafloor. In some cases, they eliminate this contact completely.
Finally, we can ban trawling in specific locations where the habitat is particularly sensitive. For example, not allowing trawling in areas with coral reefs or important biodiverse habitats such as seagrasses. This would allow trawling activity to continue but would protect important areas of our ocean at the same time.
Aquaculture (fish farming)
How much feed for aquaculture comes from fish?
Fish farming – also known as aquaculture – has boomed over the last 50 years. Production has increased more than 50-fold. In fact, we now produce more seafood from aquaculture than we do from wild catch.
This has been good news for the health of global fish stocks. Global demand for seafood might have increased, but wild fish populations are finite. If we push beyond the limits of how quickly fish populations recover, this becomes unsustainable. Aquaculture has, therefore, been an ingenious solution: rather than relying on wild fish, we can produce our own. Nearly all of the growth in seafood production in recent decades has come from aquaculture; wild fish catch has changed very little.
However, there has been one concern about the rise of aquaculture in relation to wild fish stocks. Like any type of animal farming, we need to feed them. Sometimes, we feed them fishmeal and fish oils. Not all aquaculture species are fed from animal sources, but many are. They don’t necessarily need fishmeal and oils in their diets, but fish farmers often use them because they provide an almost perfect balance of essential nutrients such as omega-3 fatty acids.
Many have questioned whether aquaculture is really the solution that it seems. If it is partly fed by wild fish, perhaps more fish farms means more pressure on wild fish stocks?
Here, I take us through the numbers to understand how much wild fish catch really goes towards animal feed, how this is changing over time, and whether this undermines the benefits of aquaculture.
How much fish is used for animal feed?
Let’s first understand the amount of wild fish that is used as feed.
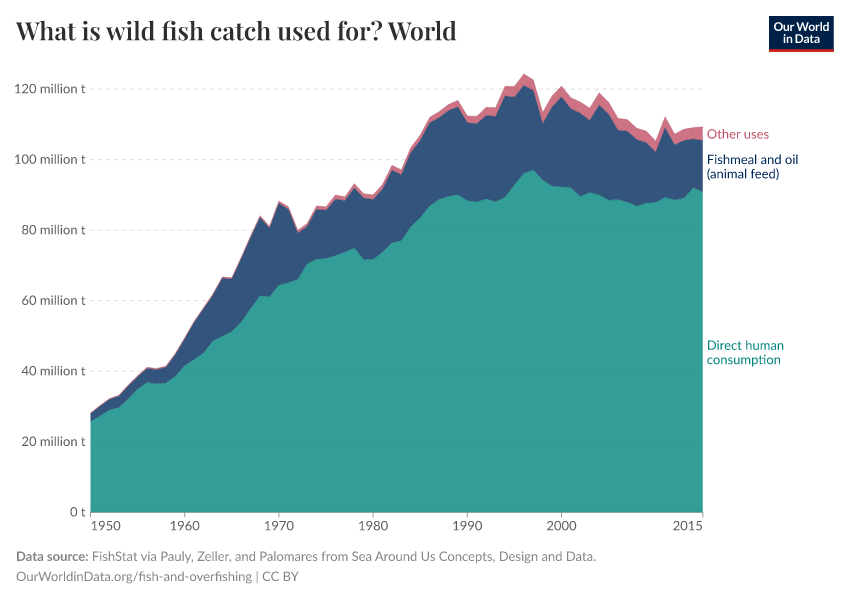
In the chart, we see the breakdown of global fish catch in 2017.31 The world caught around 109 million tonnes of fish. 84% of this was used for direct human consumption. The remaining 16% was turned into fishmeal and oils to use as animal feed. 5% went to land-based livestock such as cows, pigs, and chickens. 11% went to aquaculture as feed for farmed fish. This bottom component is what we’re most interested in.
In the second bar, we see global aquaculture production. We produce around 112 million tonnes of farmed seafood a year. We should be careful not to interpret this as the total input and output of feed for fish farming. It’s not the case that we put 12.6 million tonnes of feed in and magically get 112 million tonnes of fish back. That would massively overstate the efficiency of fish farms. First, fishmeal is just one of many things that we need to fish, so there are other inputs. Second, many aquaculture species are not fed fishmeal or oils at all.
How has the amount of fish used as feed changed over time?
Only a small share of fish catch is used as feed for aquaculture today. However, aquaculture production has grown quickly. If we want to understand how sustainable this is, we need to know how the use of fish for feed has changed over time.
In the chart, we see global fish catch since 1950.32 It is broken down by whether it is used for direct human consumption, animal feed, or other uses (which are mainly industrial uses of oils). First, we see that global fish catch has been relatively stable since 1990. If aquaculture was putting pressure on fish production, it’s not obvious from the total catch.
When we look at the breakdown, we also see that the amount allocated to fishmeal and oil (animal feed) has not changed much since 1990. It increased a lot from the 1950s through to the 1980s. But since 1990, it has actually declined.

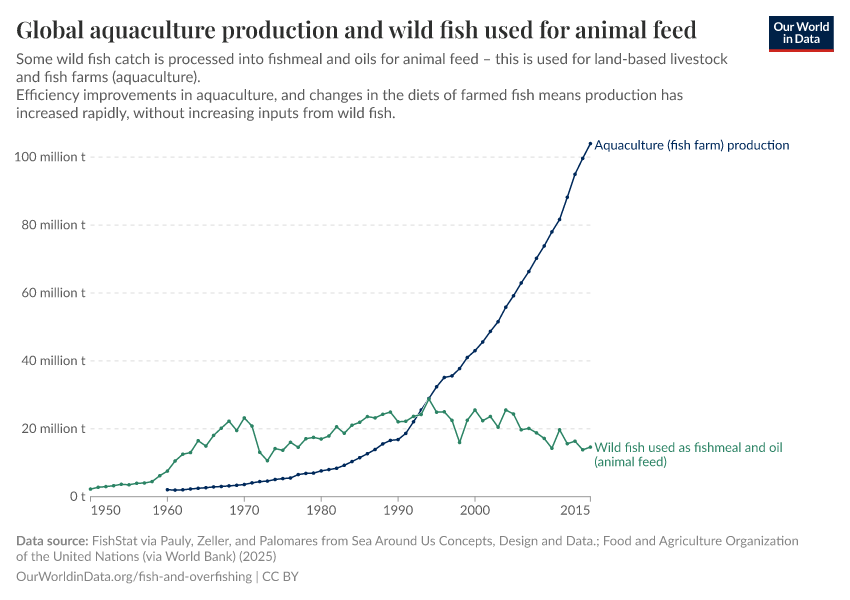
This decline is seen even more clearly in this chart, which shows the amount of wild fish used as animal feed (in blue) and aquaculture production (in red).33 As we will see later, in its infancy, the aquaculture industry was inefficient. To produce one fish, you need several fish as feed inputs. That’s part of the explanation for why feed inputs in the 1960s, 70s, 80s, and 90s were higher than aquaculture production. Thankfully, aquaculture’s reliance on wild fish has declined over the last few decades. This is for several reasons. First, the feed conversion and efficiency of fish farms have improved. Second, we’ve been discovering blends of plant-based ingredients that offer all of the essential nutrients; this reduces the need for fishmeal and oil.
As we can see from the chart, aquaculture production increased by 250% between 2000 and 2015. Meanwhile, fish caught for feed actually declined. Aquaculture’s reliance on wild fish has been weakening. It’s not the case that more and more aquaculture puts more and more pressure on wild fish.

One fish in, three fish out aquaculture is a net producer of seafood
There’s one key metric that we need to understand: the efficiency of fish feed and the FIFO ratio. The Fish In: Fish Out (FIFO) ratio tells us how much fish we need to feed aquaculture species to get one fish back in return. If you have a FIFO greater than 1, you need more fish inputs than you get back from your fish farm. So a ratio of 2 means you need two fish equivalents of fishmeal and oil to be able to produce one fish in return. On the flip side, a ratio of 0.5 means you get two fish back from every fish you put in.
In the chart here, we see the FIFO ratio across all of the most common aquaculture species.34 At the bottom, we see the total across all species fed by fishmeal. This shows the change in FIFO in the two decades from 1997 (the red markers) to 2017 (blue markers).
In 1997, aquaculture used fish feed very inefficiently. The overall ratio was 1.9, meaning almost two fish were required as inputs to produce one fish in return. This has improved massively in the decades since then. In 2017, this ratio was 0.28: we got three fish back from one fish used as input.35 This improvement came from efficiency gains, as well as a switch to other plant-based feed blends.
The FIFO improved for all aquaculture species. Today, this ratio for the most common species – carp, tilapia, and catfishes, shown at the top – is incredibly low. They use very tiny amounts of fishmeal as inputs.
On the other hand, farmed salmon, trout, and eel still have unfavorable ratios. This has improved significantly in recent decades but is still well above 1. Hopefully, this ratio will continue to fall.
Overall, aquaculture is an important solution to meet the growing demand for seafood. We cannot take endless numbers of wild fish from our oceans, so if we want more fish, we’re going to have to produce our own. A few decades ago, aquaculture’s benefits were questionable. But with massive improvements in efficiency, it is now a net producer of seafood. Fears that a growing aquaculture industry would put more and more pressure on wild fish stocks have not come true.
Discards
When fishers go out to catch fish, it would be great if they only caught the fish that they need. If they’re fishing for tuna, they catch their daily quota of tuna and leave the rest of the ecosystem undisturbed. Unfortunately, this is not the case. Fishers also catch marine life that they don’t want.
Catch that is not the species we’re targeting is called by-catch. Fishers sometimes bring by-catch back to land to eat or sell. But often, they will throw these unwanted fish back into the water. The animals they throw back are called discards. Discards can be dead or alive, but the survival rate is low. Some hardy shellfish might survive, but most discarded fish are dead.
There are various reasons why fishers might not want these fish. They might be too small, inedible, damaged, or not give them a good return in the market. Fishers might also have strict quota restrictions on how much they can bring back each day. If they’re over the limit, they will have to throw some fish back.
Discards are obviously negative. First, there is the obvious ethical lens of animal welfare – not only are we killing animals, but we’re killing them without an end use or purpose. Killing for no reason. Second, this is an issue that is often hidden from official statistics. Only ‘landings’ – the fish brought back to land – are recorded in most databases, such as those of the UN fisheries. Discards are not reported. It’s hard to understand fish stocks if large numbers of fish kills are going unmonitored. Maintaining sustainable fish stocks relies on us understanding how quickly fish populations regenerate and balancing this with how much fish we catch. Hidden catches could tip this out-of-balance.
Thankfully, we are not completely blind. Marine scientists do reconstruct and estimate discards. The UN Fisheries Division also carries out periodic – around once every decade – assessments to understand the magnitude of the problem.
How much fish do we discard each year?
Globally, we throw less than a tenth of the fish and marine animals we catch back into the ocean.
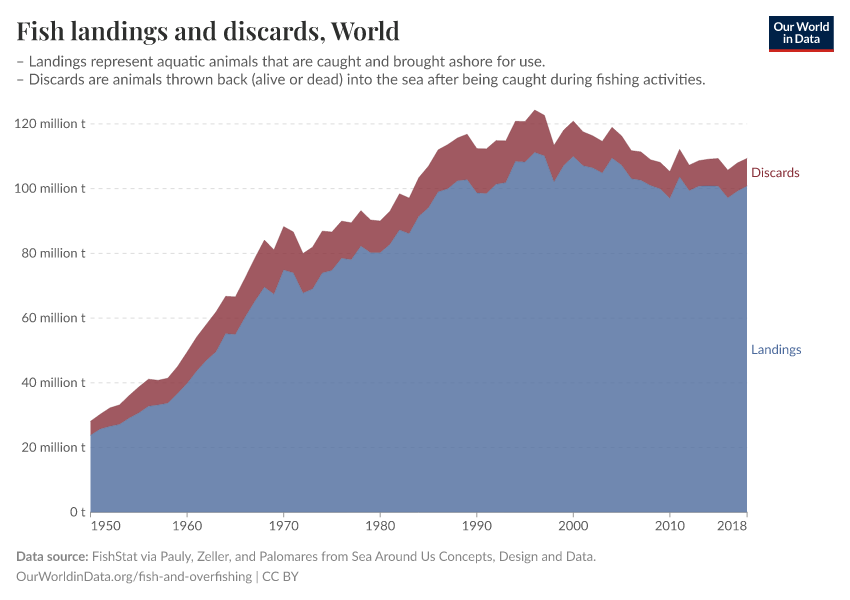
We see this in the chart, which shows global fish catch since 1950. This is split into ‘landings’ – catch that is brought back to land – and ‘discards’, the catch that is thrown back into the ocean. Researchers Dirk Zeller, Daniel Pauly, and Maria Palomares can reconstruct this data from estimates of how many discards are captured from different fishing methods.36 For example, the percentage of catch from bottom trawls that ends up being discarded. Their web platform – Sea Around Us – is an excellent resource for understanding global fisheries.
The chart shows that the majority of the aquatic animals are brought ashore and used for human or animal consumption. The remaining amount is thrown back into the water.
The UN Fisheries Division did an independent assessment of discards and found a similar result.37 It estimated that annual discards (averaged from 2010 to 2014) were around 9.1 million tonnes. That was 10.8% of the total catch.
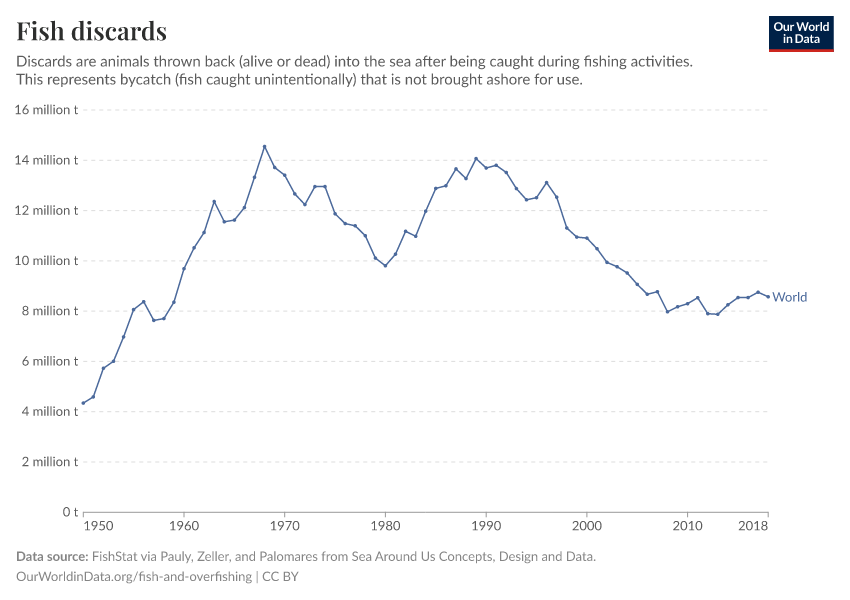
The amount of fish we discard has declined a lot in recent decades. We see this in the other chart, which shows plots that have been discarded since 1950. In the early 1950s, we were throwing around 5 million tonnes of fish away. This increased to 14 million tonnes in 1989. Since then, discards have fallen to around 8 or 9 million tonnes. This is back to levels in the late 1950s.


Which fishing methods are responsible for the most discards?
Some fishing methods generate much more discards than others. You’re not going to generate the same unwanted catch using a fishing rod as you are from bottom trawling – dragging a large net along the seafloor. If you’re doing the latter, you’re going to end up with lots of unwanted animals in your net. It’s difficult to discriminate for the particular species that you want.
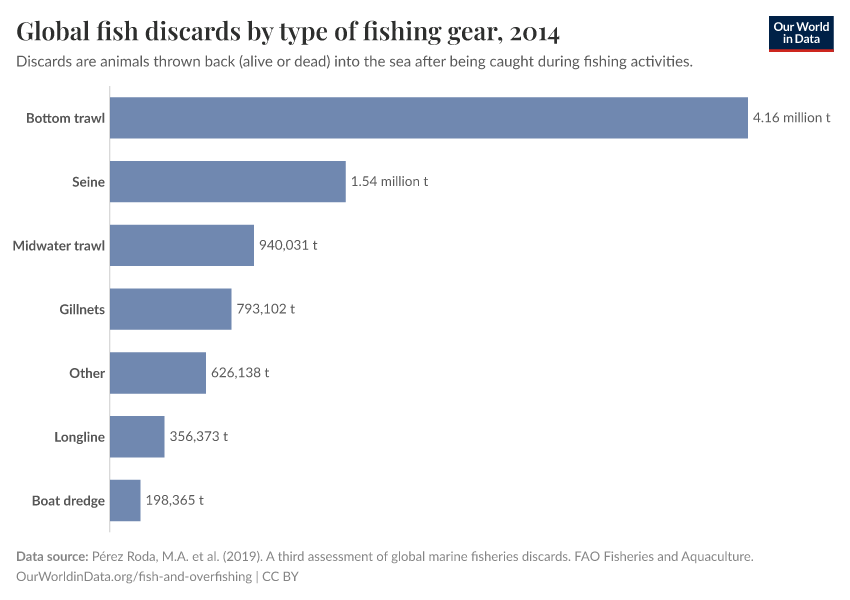
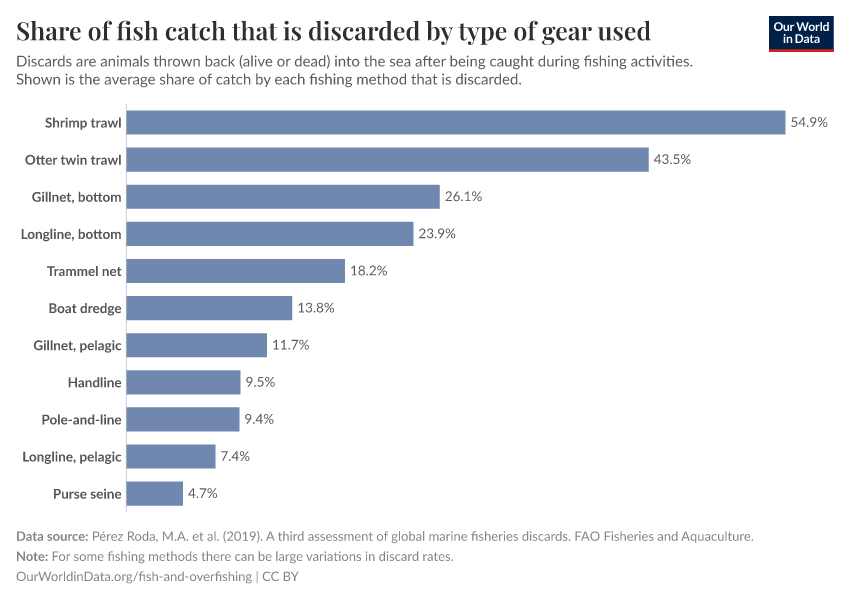
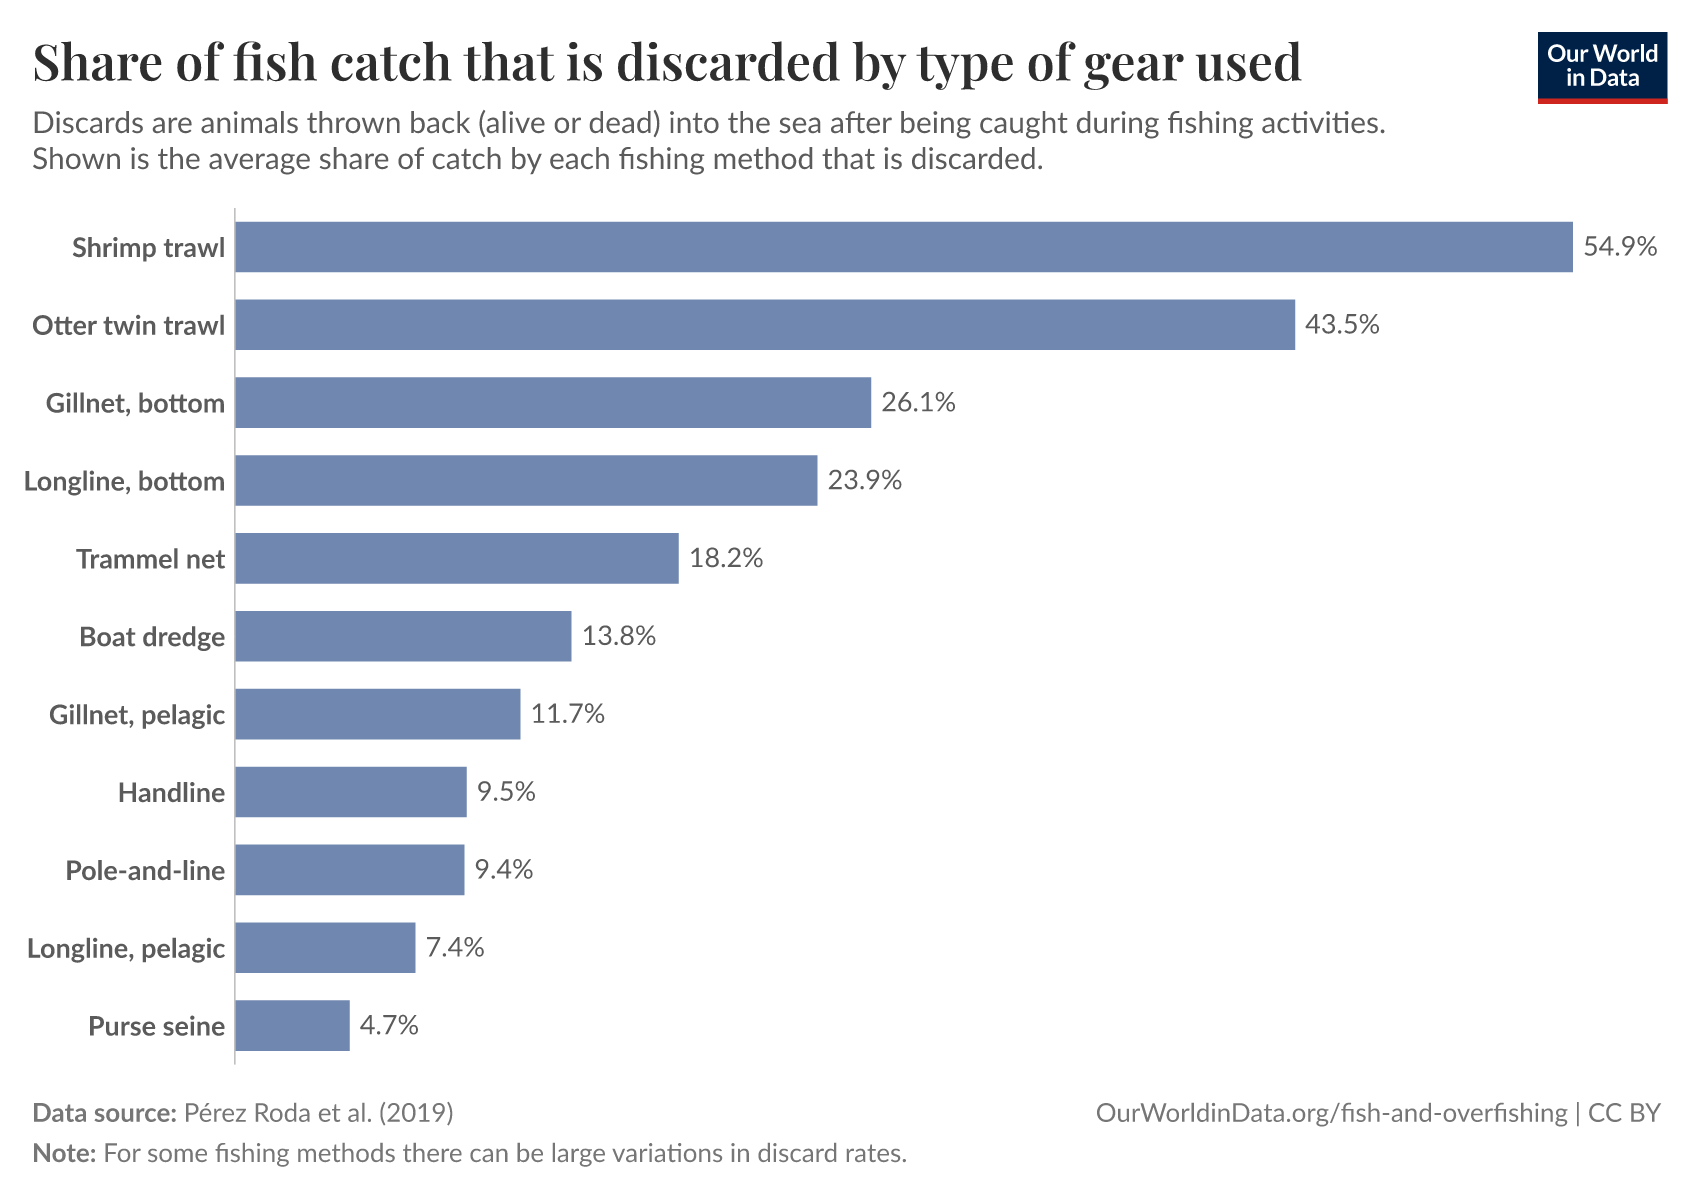
Researchers gather data on how much catch is discarded when different types of fishing gear are used. This gives us what is called the discard rate – what percentage of the total catch is thrown back into the water. The average results across different fishing methods are shown in the chart. Unsurprisingly, trawling has the highest discard rate; half of the catch from shrimp trawls is thrown back in.
The fact that trawling tends to have a high discard rate, and it is the method used to catch a lot of our fish, means that around half of global fish discards come from bottom trawling.


How do we reduce fish discards?
There are no big winners when it comes to discards. Fish are killed needlessly, and the fact that these fish are not sold or eaten means that no one benefits from more income or food. Reducing discards is a good thing.
As we saw earlier, discards have fallen since the 1990s. Why have they declined, and can we learn to replicate it?
One factor has been a rising market value of fish – even the species that fishers do not intend to catch. Fishers are, therefore, incentivized to bring more of their bycatch to land and sell it. That means that even if bycatch did not decline, the amount of discards would.
Some countries have implemented a no-discard policy – a ban on discards at sea.37 This is sometimes called a ‘landing obligation’, which means that fishers must keep all of their caught fish on board and bring them back to land to declare as ‘landings’. This policy was implemented by the European Union and was a core part of its Common Fisheries Policy reform in 2013. If fishers have a quota or limit on how much fish they can catch, they have to be much more careful about by-catch – these unwanted fish will still count towards their quota for the day.
Improved gear has led to much more selective fishing practices. Over time, gear has been adapted to reduce by-catch. Examples of this include changes in the size and shape of mesh and hook, adding ‘escape panels’ to trap nets, or the use of underwater lights or acoustic alarms.38 This has been shown to be effective in multiple contexts.39 Some countries – Belize is one example – go as far as to ban non-selective fishing gear completely.40
Many of the effective solutions to reduce discards rely on effective monitoring and enforcement of fishery policies. This means that countries that have been successful so far tend to be those with strong fisheries policies. Others lag behind, but there’s no reason to think that they could not do the same.
Eliminating by-catch completely might be unrealistic. But the fact that discards have been falling means that we can do something about it.
Marine Protected Areas
How much of the world's ocean is protected?
Marine protected areas (MPAs) are areas of ocean – which includes the water column and seafloor – that have been reserved by law or other effective means to protect part or all of the enclosed environment.
Regulations in marine protected areas can vary but include interventions such as no fishing zones, restrictions on fishing such as the type of gear that can be used, bans or restrictions on activities such as mining, and regulations on inputs to the ocean from rivers and industrial effluents.
How much of the world’s ocean is protected today?
Here, we have to differentiate between national territorial waters – that is, parts of the ocean typically closer to coastlines that countries have national rights over – and international waters (also called the ‘high seas’) that do not belong to any single country. In the chart, we see the amount in each zone that is protected and unprotected.41
As of 2021, 7.7% of the total ocean is protected. This means 92% is unprotected.
We see that much more of the world’s national waters are protected than international ones.

How much of each country’s territorial waters are protected?
In the charts here, we see the share of territorial waters that are protected in each country. This does not include international waters (‘high seas’).


Key Charts on Fish & Overfishing
See all charts on this topic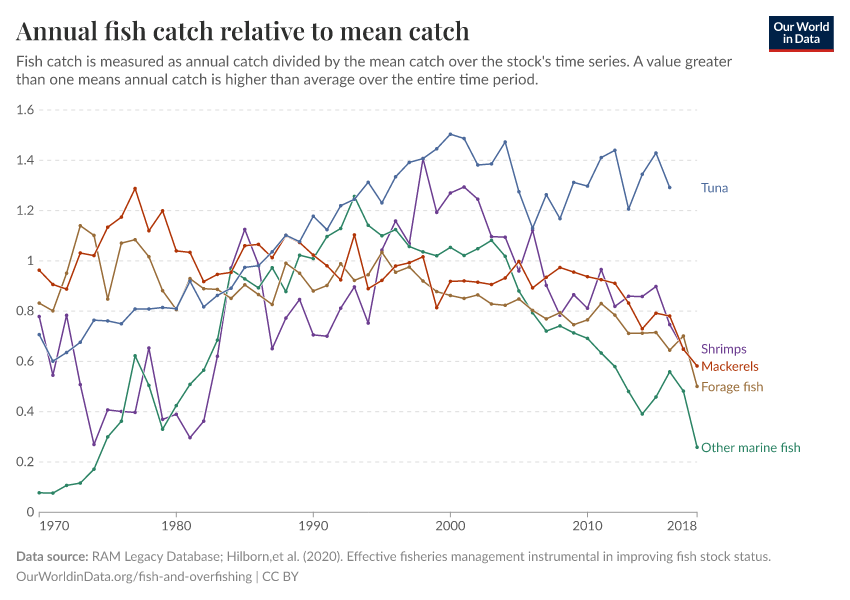


Featured Data on Fish & Overfishing
Endnotes
Schijns, R., Froese, R., Hutchings, J. A., Pauly, D., & Raicevich, S. (2021). Five centuries of cod catches in Eastern Canada. ICES Journal of Marine Science.
Thurstan, R. H., Brockington, S., & Roberts, C. M. (2010). The effects of 118 years of industrial fishing on UK bottom trawl fisheries. Nature Communications, 1(1), 1-6.
Roberts, C. M. The Unnatural History of the Sea (Island Press, 2007).
This data is sourced from the Sea Around Us database published by Pauly, Zeller, and Palomares, available at: http://www.seaaroundus.org/.
This project relies on multiple sources, primarily the FishStat database published by the Food and Agriculture Organization of the United Nations. This is available here: https://www.fao.org/fishery/en/fishstat.
Golden, C. D., Koehn, J. Z., Shepon, A., Passarelli, S., Free, C. M., Viana, D. F., ... & Thilsted, S. H. (2021). Aquatic foods to nourish nations. Nature, 1-6.
By ‘consumption’ here, we mean the amount that’s available for consumers at the retail level. Actual consumption will be a little lower due to consumer food waste.
FAO. 2020. The State of World Fisheries and Aquaculture 2020. Sustainability in action. Rome.
Duarte, C. M., Agusti, S., Barbier, E., Britten, G. L., Castilla, J. C., Gattuso, J. P., ... & Worm, B. (2020). Rebuilding marine life. Nature, 580(7801), 39-51.
Worm, B., Barbier, E. B., Beaumont, N., Duffy, J. E., Folke, C., Halpern, B. S., ... & Watson, R. (2006). Impacts of biodiversity loss on ocean ecosystem services. Science, 314(5800), 787-790.
Worm, B., Hilborn, R., Baum, J. K., Branch, T. A., Collie, J. S., Costello, C., ... & Zeller, D. (2009). Rebuilding global fisheries. Science, 325(5940), 578-585.
Hilborn, R., Amoroso, R. O., Anderson, C. M., Baum, J. K., Branch, T. A., Costello, C., ... & Ye, Y. (2020). Effective fisheries management instrumental in improving fish stock status. Proceedings of the National Academy of Sciences, 117(4), 2218-2224.
We know much less about the status of fish stocks across Asia, Africa, and South America. But from the expert analysis that we do have, it's likely that many stocks across these regions are not managed sustainably or are not improving.
Many have reported that Boris Worm’s 2006 paper has since been retracted. This is not true. However, their subsequent work has brought forward very different conclusions from the original claims.
Melnychuk, M. C., Peterson, E., Elliott, M., & Hilborn, R. (2017). Fisheries management impacts on target species status. Proceedings of the National Academy of Sciences, 114(1), 178-183.
N.K. Dulvy, N. Pacoureau, C.L. Rigby, R.A. Pollom, R.W. Jabado, D.A. Ebert, B. Finucci, C.M. Pollock, J. Cheok, D.H. Derrick, K.B. Herman, C.S. Sherman, W.J. VanderWright, J.M. Lawson, R.H. Walls, J.K. Carlson, P. Charvet, K.K. Bineesh, D. Fernando, G.M. Ralph, J.H. Matsushiba, C. Hilton-Taylor, S.V. Fordham, C.A. Simpfendorfer. Overfishing drives over one-third of all sharks and rays toward a global extinction crisis. Curr. Biol., 3 (2021), pp. 4773-4787,
Dulvy, N. K. et al. Challenges and priorities in shark and ray conservation. Curr. Biol. 27, 565–572 (2017)
Ricard, D., Minto, C., Jensen, O.P., and Baum, J.K. (2012) Evaluating the knowledge base and status of commercially exploited marine species with the RAM Legacy Stock Assessment Database. Fish and Fisheries 13 (4) 380-398. DOI: 10.1111/j.1467-2979.2011.00435.x
Gephart, J. A., Henriksson, P. J., Parker, R. W., Shepon, A., Gorospe, K. D., Bergman, K., ... & Tyedmers, P. (2021). Environmental performance of blue foods. Nature.
[This means we cannot directly compare these results to our comparisons presented here, which do include transport, packaging, and retail].
Our comparison of greenhouse gas emissions includes both wild-caught seafood and seafood from fish farms. Land use, nitrogen and phosphorus emissions, and freshwater use are only shown for farmed seafood – wild-caught fish do not really create these environmental impacts. Farmed fish do require land and can produce nutrient pollution from the production of feed to grow them.
This is the median impact of chicken raised in the US or Europe. Again, this is based on emissions and impacts up to the farm gate. Post-farmgate impacts are not included.
Sala, E., Mayorga, J., Bradley, D., Cabral, R. B., Atwood, T. B., Auber, A., ... & Lubchenco, J. (2021). Protecting the global ocean for biodiversity, food, and climate. Nature, 592(7854), 397-402.
Costello, M. J., Cheung, A., & De Hauwere, N. (2010). Surface area and the seabed area, volume, depth, slope, and topographic variation for the world’s seas, oceans, and countries. Environmental science & technology, 44(23), 8821-8828.
This 1998 paper, for example, compares trawling to Amazonian forest clearcutting.
Watling, L., & Norse, E. A. (1998). Disturbance of the seabed by mobile fishing gear: a comparison to forest clearcutting. Conservation biology, 12(6), 1180-1197.
Hilborn, R., & Hilborn, U. (2019). Ocean Recovery: A sustainable future for global fisheries?. Oxford University Press.
Amoroso, R. O., Pitcher, C. R., Rijnsdorp, A. D., McConnaughey, R. A., Parma, A. M., Suuronen, P., ... & Jennings, S. (2018). Bottom trawl fishing footprints on the world’s continental shelves. Proceedings of the National Academy of Sciences, 115(43), E10275-E10282.
The start and end year of this monitoring varied but was around the year 2010 in each region.
Hiddink, J. G., Jennings, S., Sciberras, M., Szostek, C. L., Hughes, K. M., Ellis, N., ... & Kaiser, M. J. (2017). Global analysis of depletion and recovery of seabed biota after bottom trawling disturbance. Proceedings of the National Academy of Sciences, 114(31), 8301-8306.
Hiddink, J. G., Jennings, S., & Kaiser, M. J. (2006). Indicators of the ecological impact of bottom-trawl disturbance on seabed communities. Ecosystems, 9(7), 1190-1199.
In the 1960s, Portugal was catching around 1 million tonnes each year. Now, this figure is around 100,000. Just 10% of 1960s levels.
Data sourced from: Naylor, R. L., Hardy, R. W., Buschmann, A. H., Bush, S. R., Cao, L., Klinger, D. H., ... & Troell, M. (2021). A 20-year retrospective review of global aquaculture. Nature, 591(7851), 551-563.
This data is sourced from Pauly D., Zeller D., Palomares M.L.D. (Editors), 2020. Sea Around Us Concepts, Design and Data (seaaroundus.org).
The original source is FishStat, the database maintained by the Food and Agriculture Organization of the United Nations.
Note that feed from fishmeal and oils is the combination of feed used for aquaculture and land-based livestock. So, it’s not just feed for fish farms. Over this period, the share going towards aquaculture increased. The share of global fishmeal used by the aquaculture sector increased from 33% in 2000 to 69% in 2016, while the share of global fish oil used by aquaculture rose from 55% to 75%.
Naylor, R. L., Hardy, R. W., Buschmann, A. H., Bush, S. R., Cao, L., Klinger, D. H., ... & Troell, M. (2021). A 20-year retrospective review of global aquaculture. Nature, 591(7851), 551-563.
Naylor, R. L., Goldburg, R. J., Primavera, J. H., Kautsky, N., Beveridge, M. C., Clay, J., ... & Troell, M. (2000). Effect of aquaculture on world fish supplies. Nature, 405(6790), 1017-1024.
Again, we should be careful not to mistake this as the total feed conversion ratio (FCR). Fish farms are fed from other sources. This ratio tells us about fish input, which is only one part of their total diet.
Zeller, D., Cashion, T., Palomares, M., & Pauly, D. (2018). Global marine fisheries discards: A synthesis of reconstructed data. Fish and Fisheries, 19(1), 30-39.
Pérez Roda, M.A. (ed.), Gilman, E., Huntington, T., Kennelly, S.J., Suuronen, P., Chaloupka, M. and Medley, P. 2019. A third assessment of global marine fisheries discards. FAO Fisheries and Aquaculture Technical Paper No. 633. Rome, FAO. 78 pp.
Madhu V. R. (2018). A review of trawl selectivity studies carried out along the Indian coast. Fishery Technology, 55: 1–18.
Wienbeck, H., Herrmann, B., Moderhak, W. & Stepputtis, D. 2011. Effect of netting direction and number of meshes around on size selection in the codend for Baltic cod (Gadus morhua). Fisheries Research, 109(1): 80–88.
Valdemarsen, J.W. & Suuronen, P. 2003. Modifying fishing gear to achieve ecosystem objectives. In M. Sinclair & G. Valdimarsson, eds. Responsible fisheries in the marine ecosystem, pp. 321–341. Wallingford, CABI.
Enever, R., Revill, A.S. & Grant, A. 2009. Discarding in the North Sea and on the historical efficacy of gear-based technical measures in reducing discards. Fisheries Research, 95(1): 40–46.
Hall, S.J. & Mainprize, B.M. 2005. Managing bycatch and discards: how much progress are we making, and how can we do better? Fish and Fisheries, 6(2): 134–155.
Zeller, D., Cashion, T., Palomares, M., & Pauly, D. (2018). Global marine fisheries discards: A synthesis of reconstructed data. Fish and Fisheries, 19(1), 30-39.
UNEP-WCMC and IUCN (2021), Protected Planet: The World Database on Protected Areas (WDPA) and World Database on Other Effective Area-based Conservation Measures (WD-OECM) [Online], September 2021, Cambridge, UK: UNEP-WCMC and IUCN. Available at: www.protectedplanet.net.
Cite this work
Our articles and data visualizations rely on work from many different people and organizations. When citing this topic page, please also cite the underlying data sources. This topic page can be cited as:
Hannah Ritchie and Max Roser (2021) - “Fish and Overfishing” Published online at OurWorldinData.org. Retrieved from: 'https://ourworldindata.org/fish-and-overfishing' [Online Resource]BibTeX citation
@article{owid-fish-and-overfishing,
    author = {Hannah Ritchie and Max Roser},
    title = {Fish and Overfishing},
    journal = {Our World in Data},
    year = {2021},
    note = {https://ourworldindata.org/fish-and-overfishing}
}
Reuse this work freely
All visualizations, data, and articles produced by Our World in Data are completely open access under the Creative Commons BY license. You have the permission to use, distribute, and reproduce these in any medium, provided the source and authors are credited.
The data produced by third parties and made available by Our World in Data is subject to the license terms from the original third-party authors. We will always indicate the original source of the data in our documentation, so you should always check the license of any such third-party data before use and redistribution.
All of our charts can be embedded in any site.