Child and Infant Mortality
Child mortality is one of the world’s largest problems. Around 6 million children under 15 die per year. That’s around 16,000 deaths every day, or 11 every minute.
This devastating statistic reveals the vast number of children whose lives end before they can discover their talents, passions, and dreams as they grow older – and represents the impact of child mortality on so many people’s lives: parents, siblings, families, and communities.
What’s tragic is how many of these deaths are preventable. Most are caused by malnutrition, birth conditions such as preterm birth, sepsis and trauma, and infectious diseases such as pneumonia, malaria, and HIV/AIDS.
These have all declined substantially in many, but not all, parts of the world – child deaths were a grim constant in the past. For most of human history, around 1 in 2 newborns died before reaching the age of 15. By 1950, that figure had declined to around one-quarter globally. By 2020, it had fallen to 4%.
But while humanity has made much progress, there’s still a lot of work to do. To make more progress, it’s essential to have data on child mortality and its causes, and research on how to prevent it.
On this page, you will find data and research on child mortality across the world, how it has changed, its causes, and what we can do about it.
Key Insights on Child Mortality
Child mortality rates have declined substantially over history
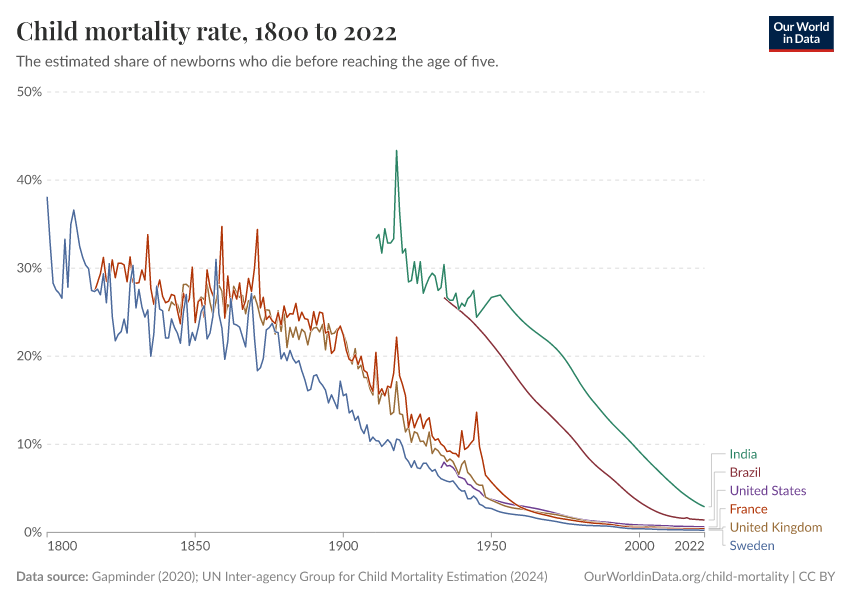
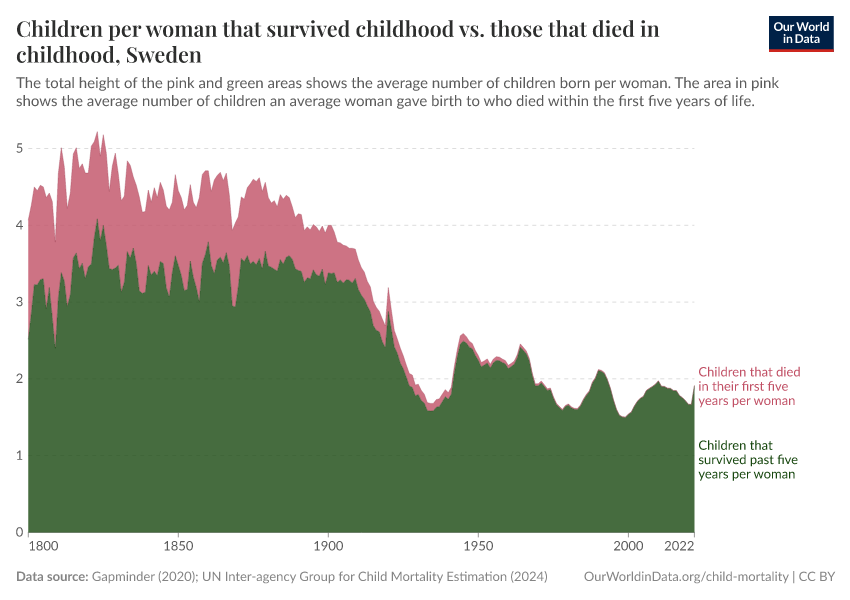
Progress against child mortality has been a recent achievement. Child mortality rates were very high throughout most of human history.
As recently as two centuries ago, around 1 in 2 children died before reaching the end of puberty. Researchers made this observation across many societies, as you can see in the chart. Our ancestors were largely powerless against poverty, famine, and disease, and these calamities were especially devastating for children.
Since then, child mortality has plummeted across the world. By 2020, the global average had declined to 4.3%.
This dramatic decline has resulted from better nutrition, clean water, sanitation, neonatal healthcare, vaccinations, medicines, and reductions in poverty, conflicts, and famine.
The chart also shows that in some wealthy countries – such as Iceland, Japan, and Norway – the share is 0.4%, ten times lower than the global average.
This historical experience, and the lower rates in wealthy countries today, shows us that much more progress is possible.
In this article, we cover this historical development in more detail:
What you should know about this data
- Data for this chart comes from a study by Anthony Volk and Jeremy Atkinson of mortality rates in historical civilizations and hunter-gatherer societies and the United Nations Inter-agency Group for Child Mortality Estimation (UN IGME).1
- Volk and Atkinson describe historical mortality rates as conservative estimates because many are based on child and infant burials, which are less commonly performed and whose remains may have decayed over time. The true mortality rate may have often been higher.
- The UN IGME estimates are based on data from vital registration systems, population censuses, household surveys, and sample registration systems. This includes large-scale surveys such as the UNICEF-supported Multiple Indicator Cluster Surveys (MICS) and USAID-supported Demographic and Health Surveys (DHS), generally repeated every 3 to 5 years. This data is used to statistically model child mortality at different ages and make estimates for countries where underlying data is lacking.2
Youth mortality rates vary widely around the world
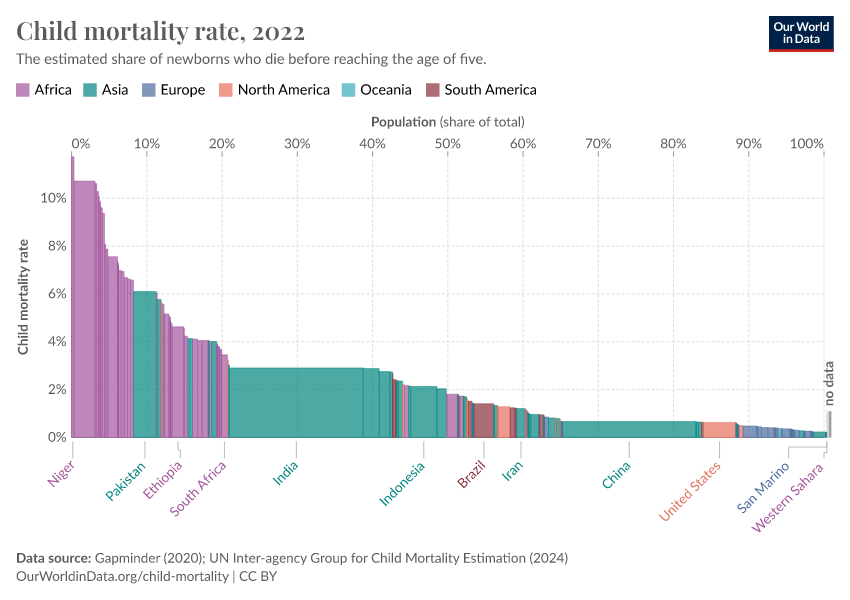
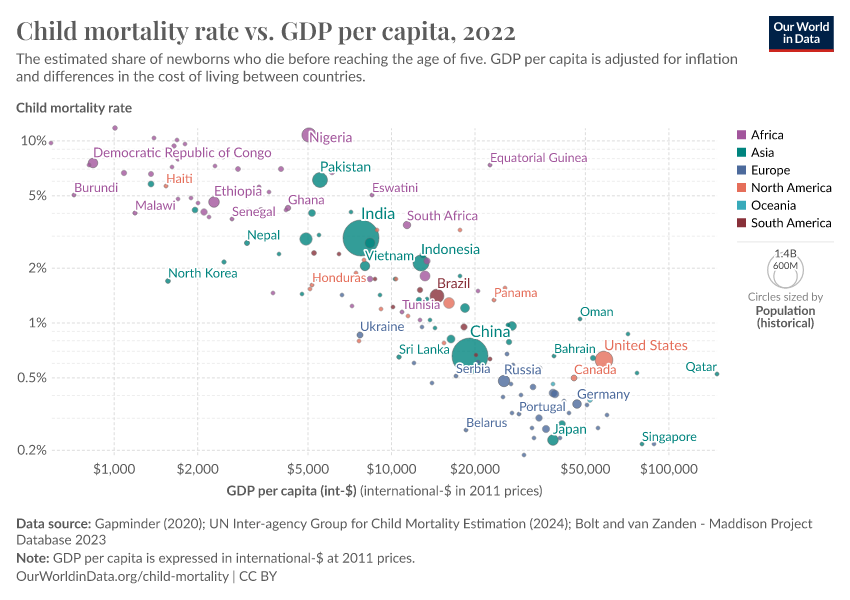
Child mortality rates are much higher in some parts of the world than others. The map shows the share of children who die before they are fifteen years old.
As you can see, countries in Africa, South America, and South Asia have much higher rates.
In Nigeria in 2020, for example, 13% of children die before they are fifteen. In Pakistan, that share was 7%.
In other parts of the world, it was much lower. In Italy, for example, it was 0.4%.
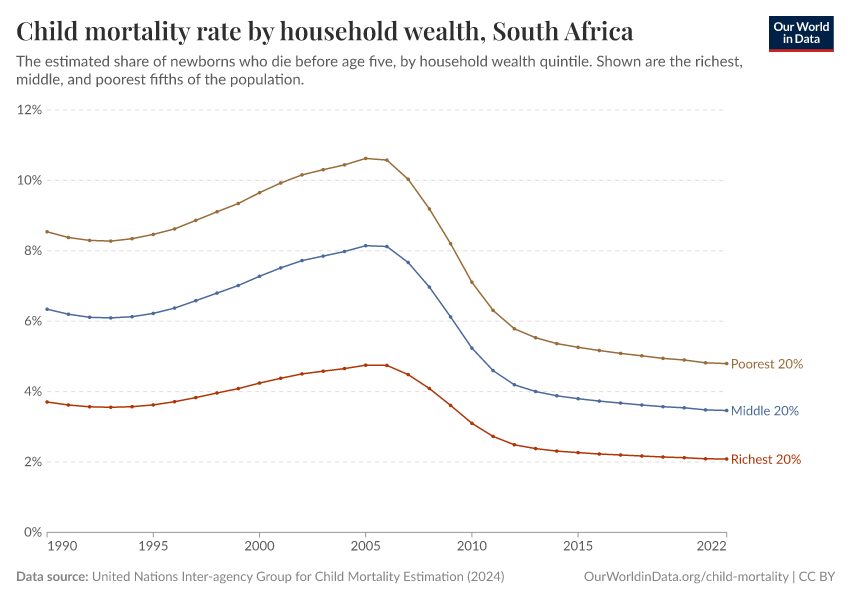
Declines in mortality rates have also varied around the world. In countries in Southern Africa, such as South Africa and Zimbabwe, child mortality increased in the 1990s and 2000s – largely due to the HIV/AIDS epidemic.3
What you should know about this data
- The UN IGME estimates are based on data from vital registration systems, population censuses, household surveys, and sample registration systems. This includes large-scale surveys such as the UNICEF-supported Multiple Indicator Cluster Surveys (MICS) and USAID-supported Demographic and Health Surveys (DHS), generally repeated every 3 to 5 years. This data is used to statistically model child mortality at different ages and make estimates for countries where underlying data is lacking.4

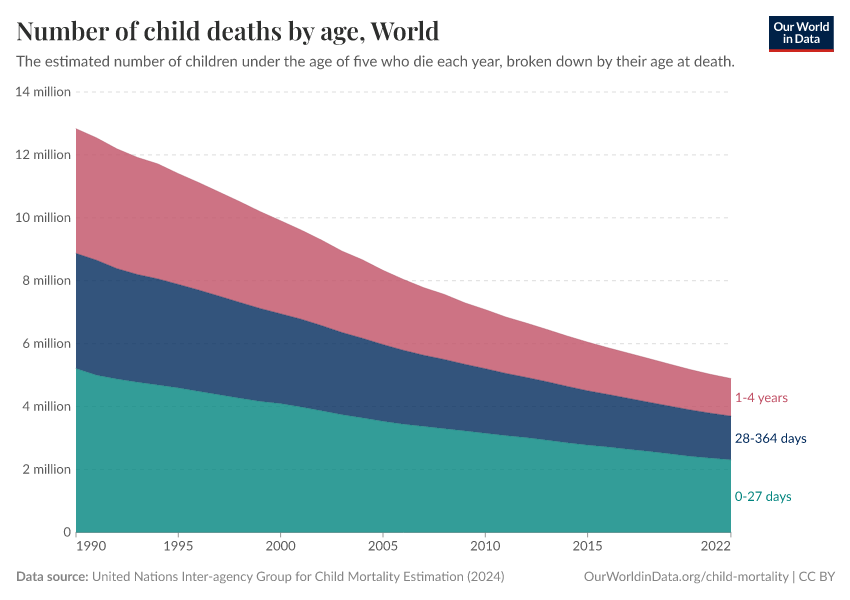
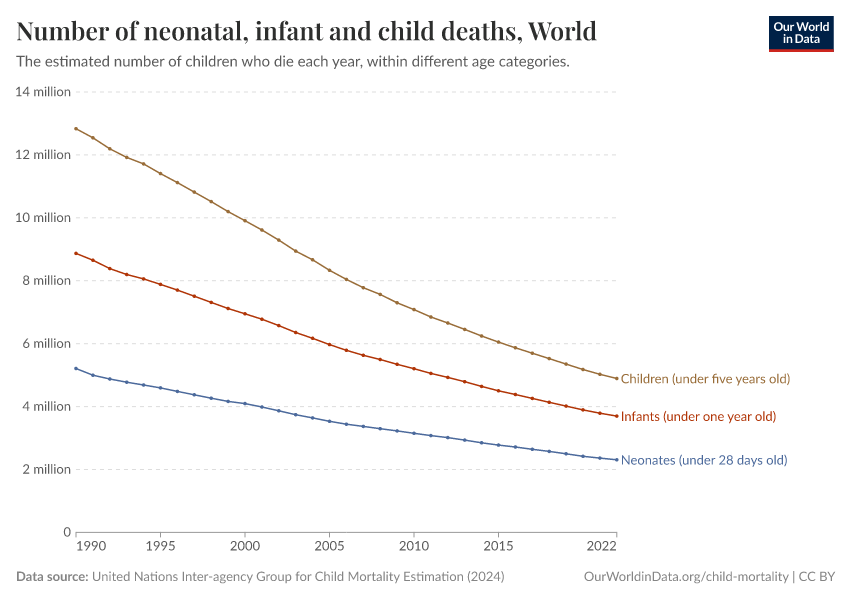
Millions of children die every year
The scale of child mortality is immense and can be hard to grasp. Around 5 million children under five years old die annually.
That’s around 14,000 deaths every day, or ten every minute. Or, thinking of it another way, 5 million is the population of Ireland or Norway.5
This enormous loss of life is also a tragedy felt by people around the children – their parents, siblings, friends, and communities.
Over time, child deaths have declined, even as the global population has risen. But there is still much more progress to be made.
In this article, we cover this in more detail:
What you should know about this data
- The UN IGME estimates are based on data from vital registration systems, population censuses, household surveys, and sample registration systems. This includes large-scale surveys such as the UNICEF-supported Multiple Indicator Cluster Surveys (MICS) and USAID-supported Demographic and Health Surveys (DHS), generally repeated every 3 to 5 years. This data is used to model child mortality at different ages and make estimates for countries lacking underlying data.2

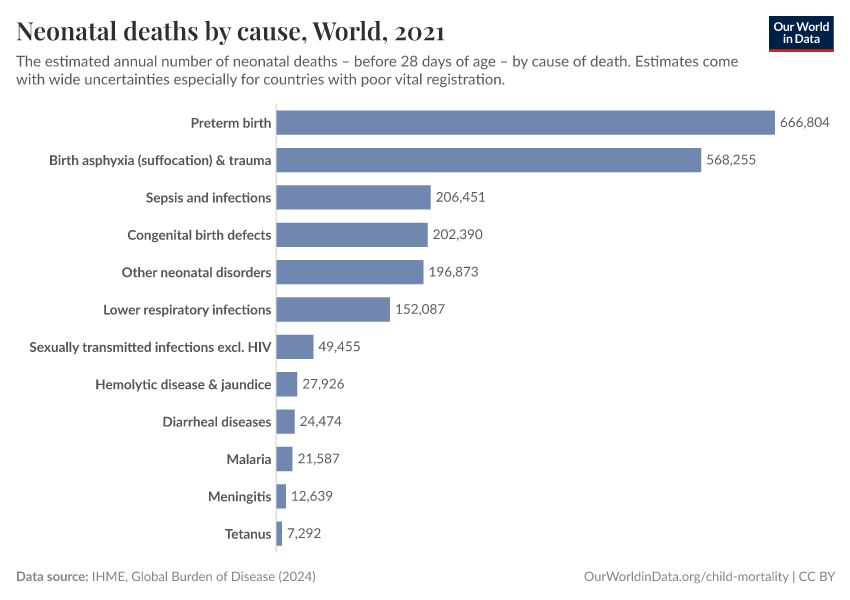
Most children die from preventable causes
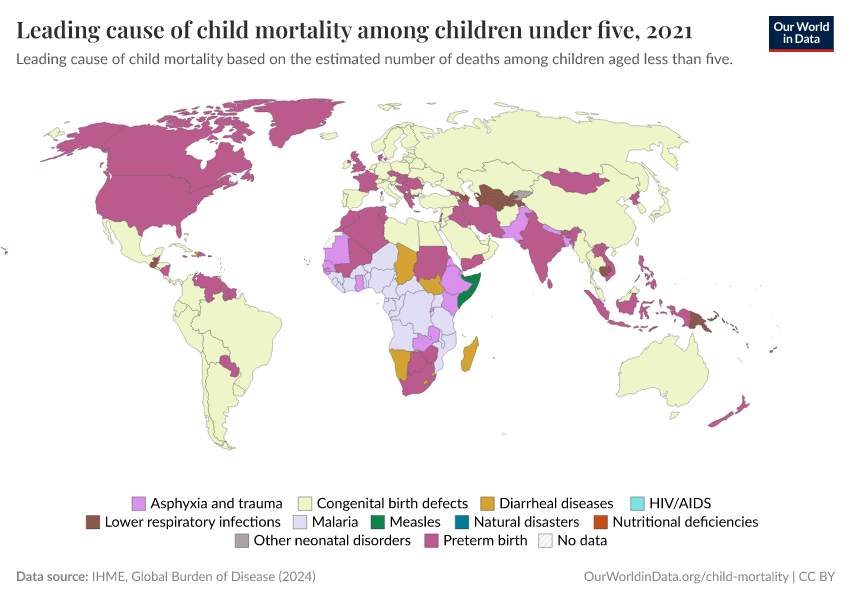
To make progress against child mortality, we need to know what children are dying from.
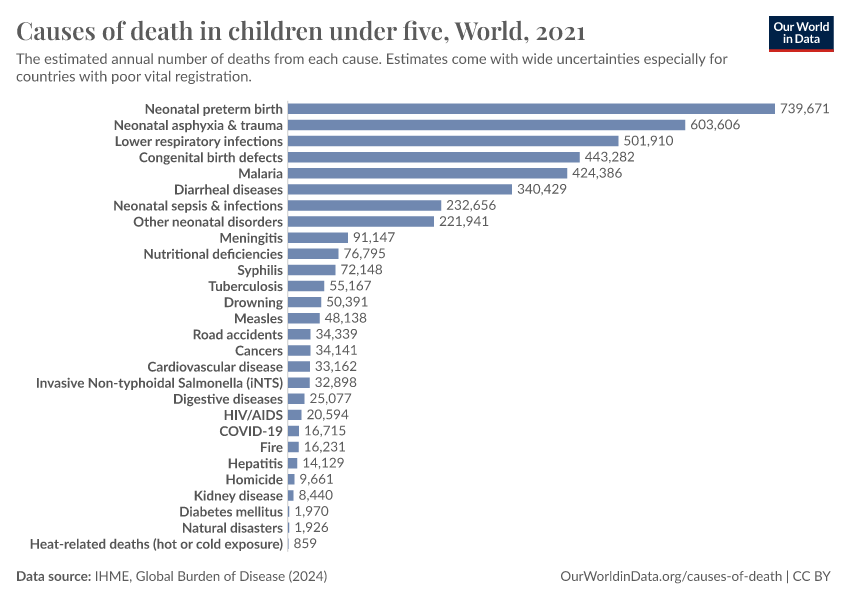
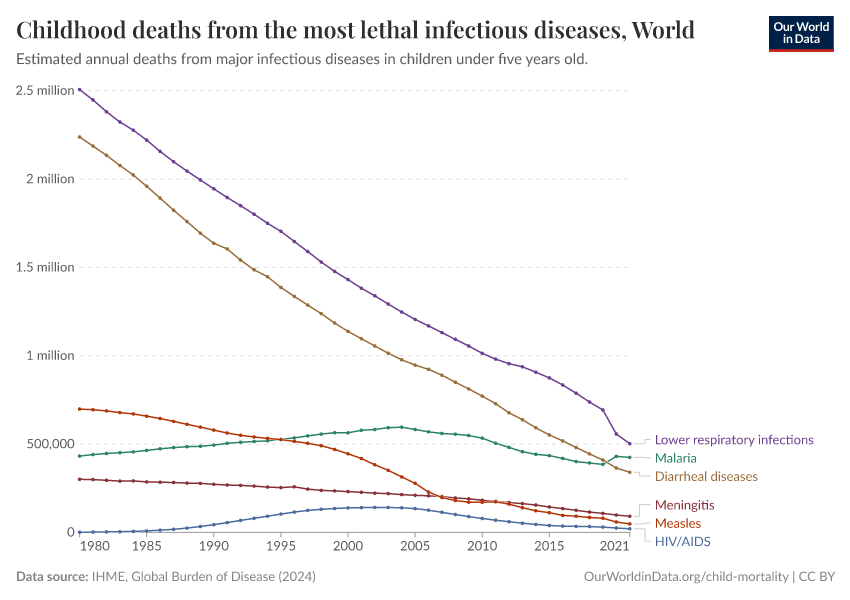
In the chart, you can see global estimates from the publication of the Institute for Health Metrics and Evaluation in 2019. The size of each box corresponds to the number of children under five years old who die from each cause.
Infectious diseases, shown on the left, were most common, killing an estimated 2.17 million children annually. This includes respiratory infections, diarrheal diseases, malaria and meningitis.
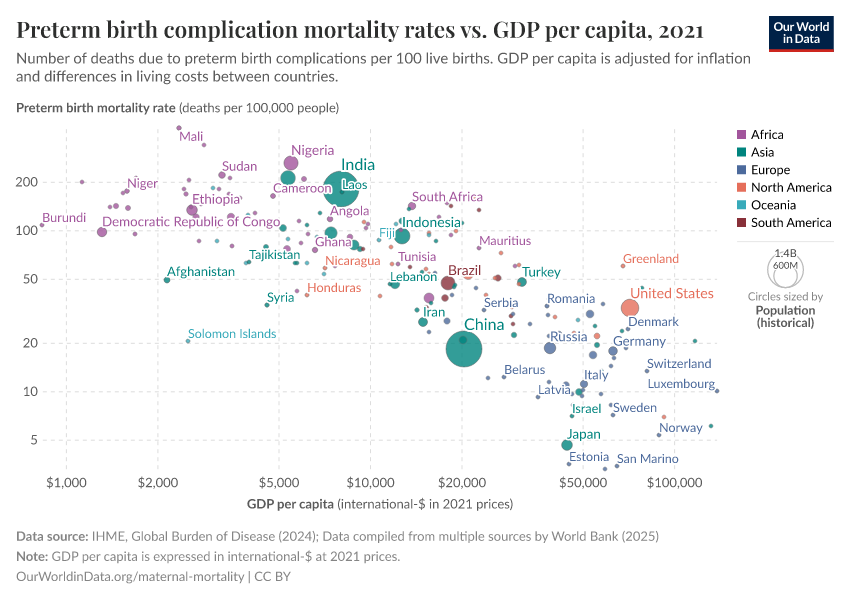
Next were birth disorders, such as preterm birth, neonatal asphyxia (suffocation), and trauma, which together caused an estimated 1.88 million deaths.
Several other causes such as heart abnormalities and malnutrition were also responsible for hundreds of thousands of deaths.
These figures are astonishing because many of these causes are preventable. With vaccination, basic medication, rehydration treatment, nutrition supplementation, and neonatal healthcare, a large share of child deaths could be prevented.
What you should know about this data
- This data comes from the publication by the Institute for Health Metrics and Evaluation (IHME) in 2019.
- These estimates assign each death a single cause, based on data on the ‘underlying cause of death’ listed on death certificates, verbal autopsies, and statistical modeling. This is a simplification, as people often have multiple diseases or injuries that contribute to their death, which may also be listed on death certificates.
- This page discusses data on causes of death globally for 2019, the year before the Covid-19 pandemic started.
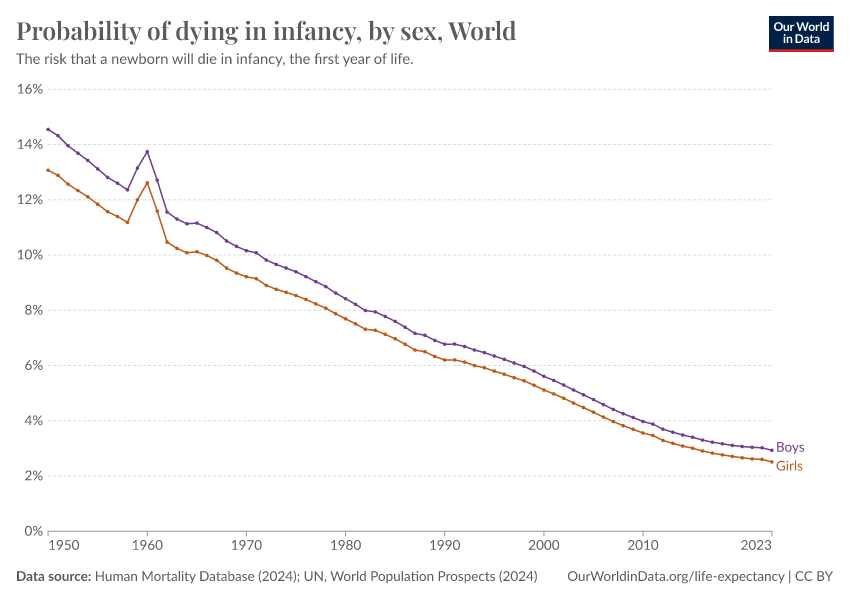
Children are most at risk during the first months of life
The day a child is born is the most dangerous day of life.
In the chart, you can see how the risk of death changes across the first year of life.
The top panel shows the daily death rate per 1,000 infants in the United States.
As you can see, the risk of death is highest just after birth – when they are introduced into a new environment. In the first hours of their lives, some children die from birth complications, suffocation and trauma, sepsis, and other conditions.
Over the following days and weeks, their risks remain high but decline sharply. Months later, the risks continue to decline, although at a slower rate.
There are several reasons for this reduction. One is that infants who are most vulnerable tend to die earlier. Another reason is that infantsʼ vital organs – such as their immune system and lung capacity – become more developed over time, which makes them more capable of survival.6
In the lower panel, the chart shows how the daily deaths accumulate across the year – you can see that most infant deaths occurred in the first few months.
In this article, we cover this in more detail:
What you should know about this data
- This chart shows infant mortality rates between 2017 and 2020, using data from the Centers for Disease Control and Prevention (CDC) in the United States. This covers all infant deaths in the US that were registered with birth and death certificates.
- The scripts I used to create this chart are in our repository.
- The specific mortality rates per day vary between countries and over time.
Research & Writing
More articles on child mortality
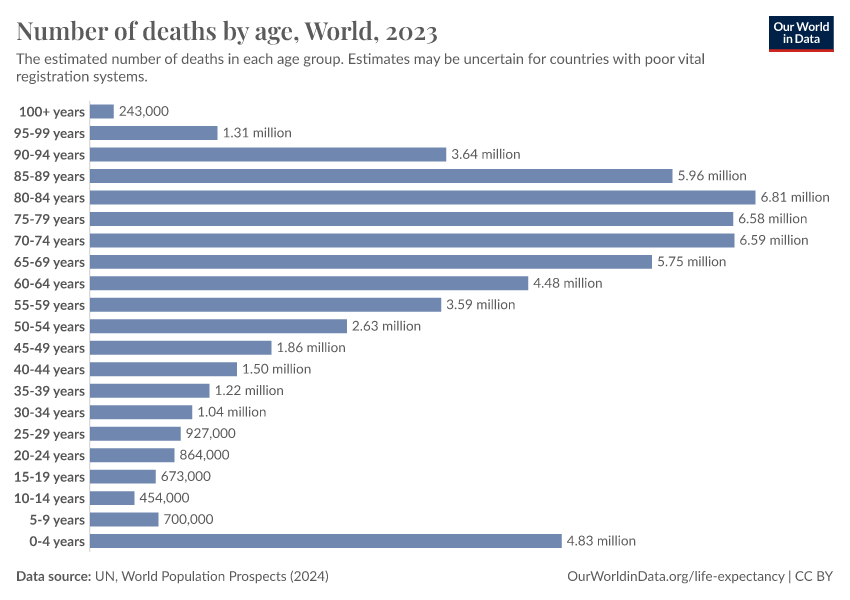
How does the risk of death change as we age – and how has this changed over time?
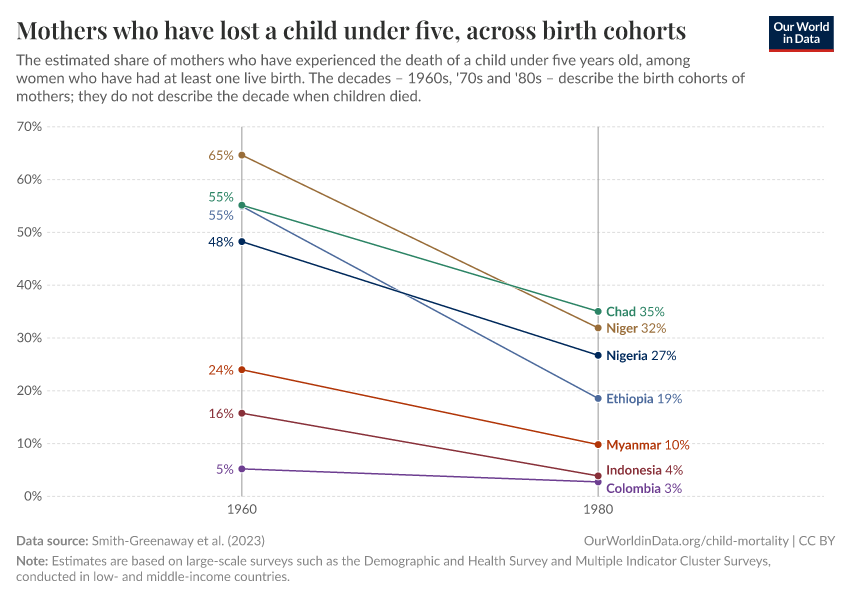
How often did parents see their children die?
How child mortality has declined in the last two centuries
It’s not just about child mortality, life expectancy improved at all ages
Half of all child deaths are linked to malnutrition
Where in the world are babies at the lowest risk of dying?
Children in rich countries are much less likely to die than a few decades ago, but we rarely hear about this progress
Articles on preventing child mortality
Child mortality: achieving the global goal for 2030 would be a huge achievement – but we are currently far away
Malaria: One of the leading causes of child deaths, but progress is possible and you can contribute to it
More than half a million children die from diarrhea each year. How do we prevent this?
Oral rehydration therapy: a low-tech solution that has saved millions of lives
Rotavirus vaccine – an effective tool that prevents children dying from diarrhea
Pneumonia — no child should die from a disease we can prevent
Definitions in child mortality
Key Charts on Child & Infant Mortality
See all charts on this topic


Featured Data on Child & Infant Mortality
Endnotes
Volk, A. A., & Atkinson, J. A. (2013). Infant and child death in the human environment of evolutionary adaptation. Evolution and Human Behavior, 34(3), 182–192. https://doi.org/10.1016/j.evolhumbehav.2012.11.007
United Nations Inter-agency Group for Child Mortality Estimation. (2022). Levels and trends in child mortality: Report 2022. https://childmortality.org/wp-content/uploads/2023/01/UN-IGME-Child-Mortality-Report-2022.pdf
This is because HIV can be transmitted between mother and child.
Bourne, D. E., Thompson, M., Brody, L. L., Cotton, M., Draper, B., Laubscher, R., Abdullah, M. F., & Myers, J. E. (2009). Emergence of a peak in early infant mortality due to HIV/AIDS in South Africa. AIDS, 23(1), 101–106. https://doi.org/10.1097/QAD.0b013e32831c54bd
Ferrand, R. A., Corbett, E. L., Wood, R., Hargrove, J., Ndhlovu, C. E., Cowan, F. M., Gouws, E., & Williams, B. G. (2009). AIDS among older children and adolescents in Southern Africa: Projecting the time course and magnitude of the epidemic. AIDS, 23(15), 2039–2046. https://doi.org/10.1097/QAD.0b013e32833016ce
Hill, K., You, D., Inoue, M., Oestergaard, M. Z., & Technical Advisory Group of the United Nations Inter-agency Group for Child Mortality Estimation. (2012). Child Mortality Estimation: Accelerated Progress in Reducing Global Child Mortality, 1990–2010. PLoS Medicine, 9(8), e1001303. https://doi.org/10.1371/journal.pmed.1001303
See https://childmortality.org/ for more details. United Nations Inter-agency Group for Child Mortality Estimation. (2022). Levels and trends in child mortality: Report 2022. Available here.
In 2021, the estimated population of Ireland was 4.99 million, and Norway's was 5.41 million, according to the UN estimates. You can see more countries’ populations on our page on Population Growth.
Berrut, S., Pouillard, V., Richmond, P., & Roehner, B. M. (2016). Deciphering infant mortality. Physica A: Statistical Mechanics and Its Applications, 463, 400–426. https://doi.org/10.1016/j.physa.2016.07.031
Schöley, J. (2019). The age-trajectory of infant mortality in the United States: Parametric models and generative mechanisms. Annual Meeting of the Population Association of America, Austin, TX. Available here.
Cite this work
Our articles and data visualizations rely on work from many different people and organizations. When citing this topic page, please also cite the underlying data sources. This topic page can be cited as:
Saloni Dattani, Fiona Spooner, Hannah Ritchie, and Max Roser (2023) - “Child and Infant Mortality” Published online at OurWorldinData.org. Retrieved from: 'https://ourworldindata.org/child-mortality' [Online Resource]BibTeX citation
@article{owid-child-mortality,
    author = {Saloni Dattani and Fiona Spooner and Hannah Ritchie and Max Roser},
    title = {Child and Infant Mortality},
    journal = {Our World in Data},
    year = {2023},
    note = {https://ourworldindata.org/child-mortality}
}
Reuse this work freely
All visualizations, data, and code produced by Our World in Data are completely open access under the Creative Commons BY license. You have the permission to use, distribute, and reproduce these in any medium, provided the source and authors are credited.
The data produced by third parties and made available by Our World in Data is subject to the license terms from the original third-party authors. We will always indicate the original source of the data in our documentation, so you should always check the license of any such third-party data before use and redistribution.
All of our charts can be embedded in any site.