Interactive visualization requires JavaScript
Related research and data
Charts
- Annual sea surface temperature anomalies relative to the pre-industrial period
- Annual temperature anomalies
- Antarctic sea ice extent
- Arctic sea ice extent
- Autumn temperature anomalies
- Average annual surface temperature
- Average monthly surface temperature
- Carbon dioxide concentration in the atmosphere
- Change in heat-related death rates vs. Per capita CO₂ emissions
- Concentration of nitrous oxide in the atmosphere
- Countries with national adaptation plans for climate change
- Decadal average surface temperature
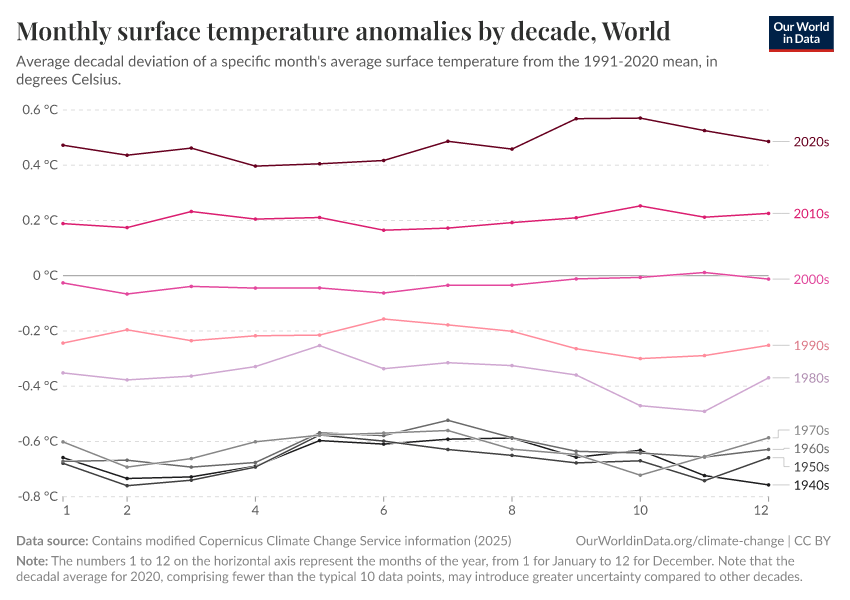
- Decadal temperature anomalies
- Estimated change in the death rate from non-optimal temperatures
- Estimated changes in temperature-related death rates compared to projected death rates
- Financial support provided through the Green Climate Fund
- Glaciers: change of mass of US glaciers
- Global atmospheric CO₂ concentration
- Global atmospheric methane concentrations
- Global atmospheric nitrous oxide concentration
- Global temperature anomalies by El Niño and La Niña and month
- Global temperature anomalies by El Niño and La Niña conditions
- Global temperature anomalies by month
- Global warming contributions by gas and source
- Global warming contributions from fossil fuels and land use
- Global warming: Contributions to the change in global mean surface temperature
- Heat content in the top 2,000 meters of the world's oceans
- Heat content in the top 700 meters of the world's oceans
- Ice sheet mass balance
- Methane concentration in the atmosphere
- Monthly average ocean heat content in the top 2,000 meters
- Monthly average ocean heat content in the top 700 meters
- Monthly average surface temperatures by decadedecadal
- Monthly average surface temperatures by year
- Monthly sea ice extent in the Antarctic
- Monthly sea ice extent in the Antarctic, decadal average
- Monthly sea ice extent in the Arctic
- Monthly sea ice extent in the Arctic, decadal average
- Monthly sea surface temperature anomalies relative to the pre-industrial period
- Monthly surface temperature anomalies by year
- Monthly temperature anomalies
- Nationally determined contributions to climate change
- Ocean acidification: mean seawater pH
- Opinions of young people on the threats of climate change
- People underestimate others' willingness to take climate action
- Projected change in temperature-related death rate vs. GDP per capita
- Projected number of air conditioning units
- Sea ice anomalies in the Antarctic by month
- Sea ice anomalies in the Arctic by month
- Sea level rise
- Seasonal temperature anomalies in the United States
- Share of all deaths attributed to sub-optimal temperatures
- Share of deaths from all causes attributed to cold or heat
- Share of households with air conditioning
- Share of people who believe in climate change and think it's a serious threat to humanity
- Share of people who say their government should do more to tackle climate change
- Share of people who support policies to tackle climate change
- Share of warm-season deaths attributed to heat in a world with and without climate change
- Share that think people in their country should act to tackle climate change
- Snow cover in North America
- Spring temperature anomalies
- Summer temperature anomalies
- Temperature anomalies by month
- Temperature anomalies vs. latitude
- Temperature change relative to the pre-industrial period
- Winter temperature anomalies