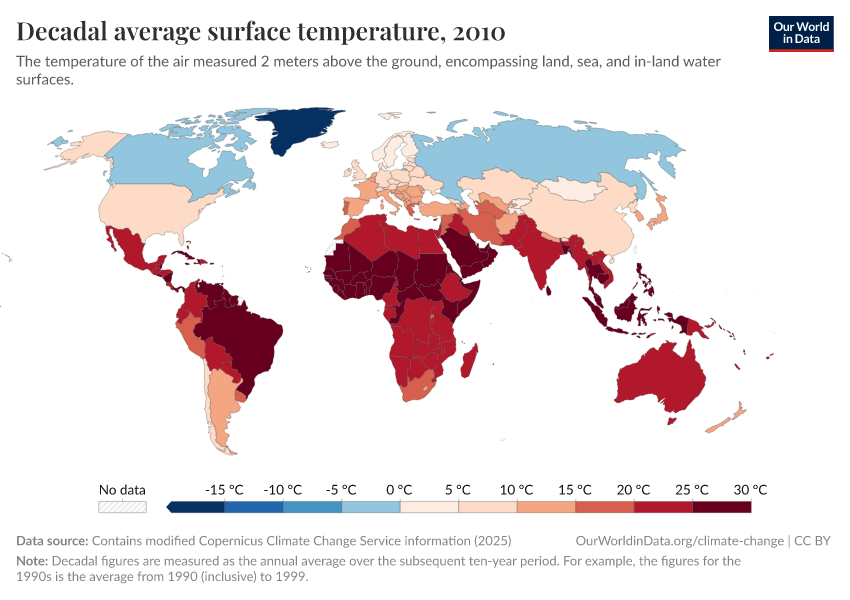
Decadal average surface temperature

What you should know about this indicator
What you should know about this indicator
Sources and processing
This data is based on the following sources
How we process data at Our World in Data
All data and visualizations on Our World in Data rely on data sourced from one or several original data providers. Preparing this original data involves several processing steps. Depending on the data, this can include standardizing country names and world region definitions, converting units, calculating derived indicators such as per capita measures, as well as adding or adapting metadata such as the name or the description given to an indicator.
At the link below you can find a detailed description of the structure of our data pipeline, including links to all the code used to prepare data across Our World in Data.
Notes on our processing step for this indicator
-
Temperature measured in kelvin was converted to degrees Celsius (°C) by subtracting 273.15.
-
Initially, the temperature dataset is provided with specific coordinates in terms of longitude and latitude. To tailor this data to each country, we utilize geographical boundaries as defined by the World Bank. The method involves trimming the global temperature dataset to match the exact geographical shape of each country. To correct for potential distortions caused by the Earth's curvature on a flat map, we apply a latitude-based weighting. This step is essential for maintaining accuracy, especially in high-latitude regions where distortion is more pronounced. The result of this process is a latitude-weighted average temperature for each nation.
-
It's important to note, however, that due to the resolution constraints of the Copernicus dataset, this methodology might not be as effective for countries with very small landmasses. In these cases, the process may not yield reliable data.
-
The derived 2-meter temperature readings for each country are calculated based on administrative borders, encompassing all land surface types within these defined areas. As a result, temperatures over oceans and seas are not included in these averages, focusing the data primarily on terrestrial environments.
-
Global temperature averages and anomalies are calculated over all land and ocean surfaces.
-
Decadal average temperature is calculated by averaging the annual temperature values for each decade.
Reuse this work
- All data produced by third-party providers and made available by Our World in Data are subject to the license terms from the original providers. Our work would not be possible without the data providers we rely on, so we ask you to always cite them appropriately (see below). This is crucial to allow data providers to continue doing their work, enhancing, maintaining and updating valuable data.
- All data, visualizations, and code produced by Our World in Data are completely open access under the Creative Commons BY license. You have the permission to use, distribute, and reproduce these in any medium, provided the source and authors are credited.
Citations
How to cite this page
To cite this page overall, including any descriptions, FAQs or explanations of the data authored by Our World in Data, please use the following citation:
“Data Page: Decadal average surface temperature”, part of the following publication: Hannah Ritchie, Pablo Rosado, and Veronika Samborska (2024) - “Climate Change”. Data adapted from Contains modified Copernicus Climate Change Service information. Retrieved from https://archive.ourworldindata.org/20260210-110915/grapher/decadal-average-surface-temperature.html [online resource] (archived on February 10, 2026).How to cite this data
In-line citationIf you have limited space (e.g. in data visualizations), you can use this abbreviated in-line citation:
Contains modified Copernicus Climate Change Service information (2025) – with major processing by Our World in DataFull citation
Contains modified Copernicus Climate Change Service information (2025) – with major processing by Our World in Data. “Decadal average surface temperature” [dataset]. Contains modified Copernicus Climate Change Service information, “ERA5 monthly averaged data on single levels from 1940 to present 2” [original data]. Retrieved February 16, 2026 from https://archive.ourworldindata.org/20260210-110915/grapher/decadal-average-surface-temperature.html (archived on February 10, 2026).