Gdoc/Admin

Plastic Pollution

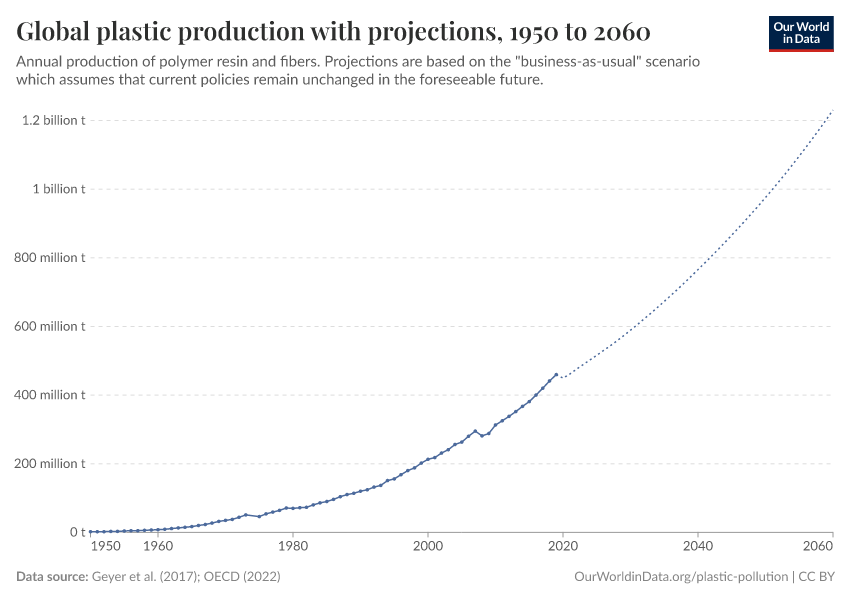
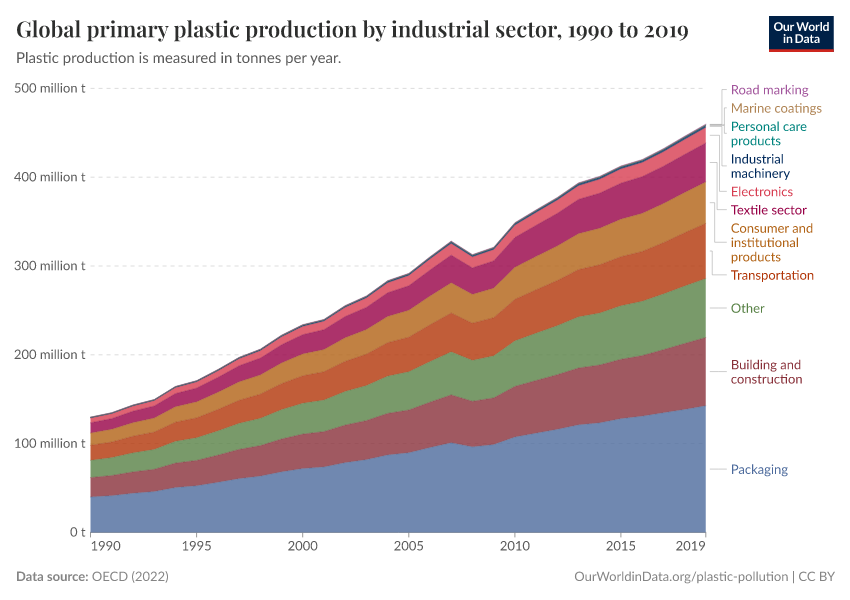
Plastic production has sharply increased over the last 70 years. In 1950, the world produced just two million tonnes. It now produces over 450 million tonnes.

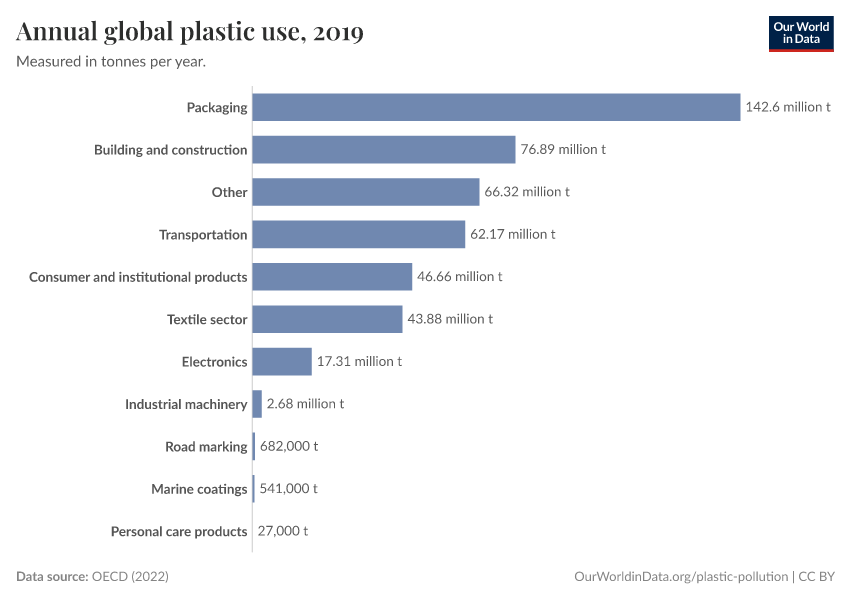
Plastic has added much value to our lives: it’s a cheap, versatile, and sterile material used in various applications, including construction, home appliances, medical instruments, and food packaging.

However, when plastic waste is mismanaged – not recycled, incinerated, or kept in sealed landfills – it becomes an environmental pollutant. One to two million tonnes of plastic enter our oceans yearly, affecting wildlife and ecosystems.

Improving the management of plastic waste across the world – especially in poorer countries, where most of the ocean plastics come from – is therefore critical to tackling this problem.

On this page, you can find all of our data, visualizations, and writing on plastic pollution.

You can also find a summary of this material in our slide deck.

Key Insights on Plastic Pollution

Plastic production has more than doubled in the last two decades

The first synthetic plastic – Bakelite – was produced in 1907, marking the beginning of the global plastics industry.

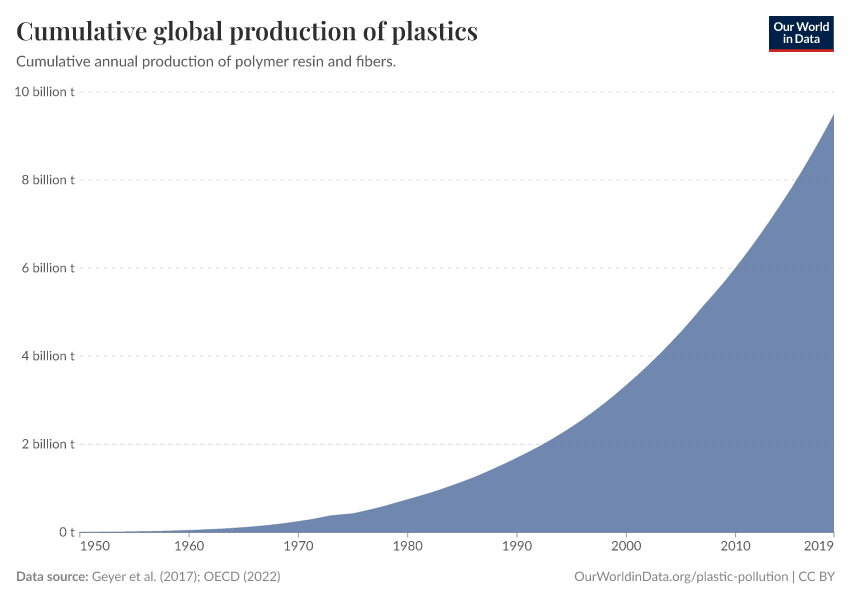
However, rapid growth in global plastic production didn’t happen until the 1950s. Over the next 70 years, however, annual production of plastics has increased nearly 230-fold to 460 million tonnes in 2019.

Even just in the last two decades, global plastic production has doubled.

Around 0.5% of plastic waste ends up in the ocean

The world produces around 350 million tonnes of plastic waste each year.

Estimates vary, but recent high-quality studies suggest that between 1 and 2 million tonnes of plastic enter the oceans annually.1

That means 0.5% of plastic waste ends up in the ocean.

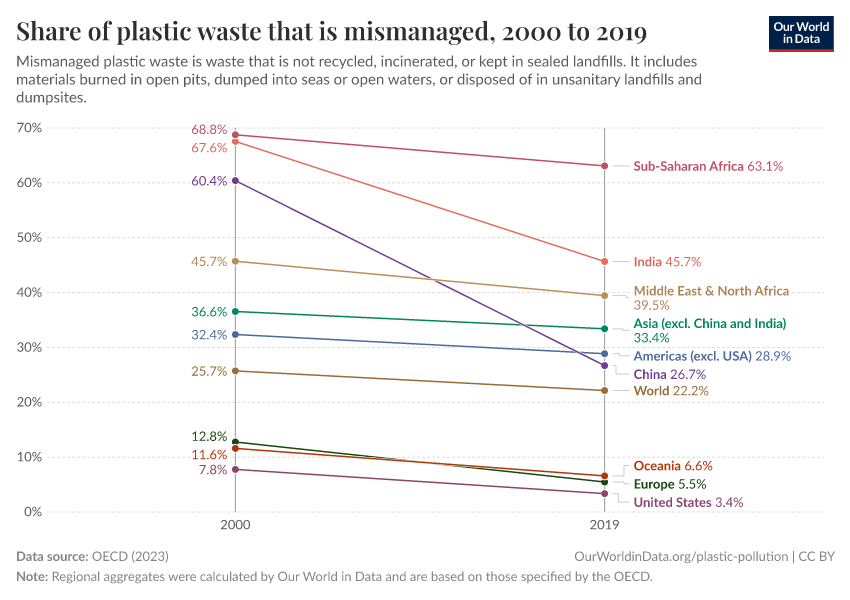
The chart shows that around one-quarter of plastic waste is mismanaged, meaning it is not recycled, incinerated, or stored in sealed landfills. This makes it vulnerable to polluting the environment.

As shown in the chart, some of this is leaked to the environment; a further fraction makes its way to the ocean.

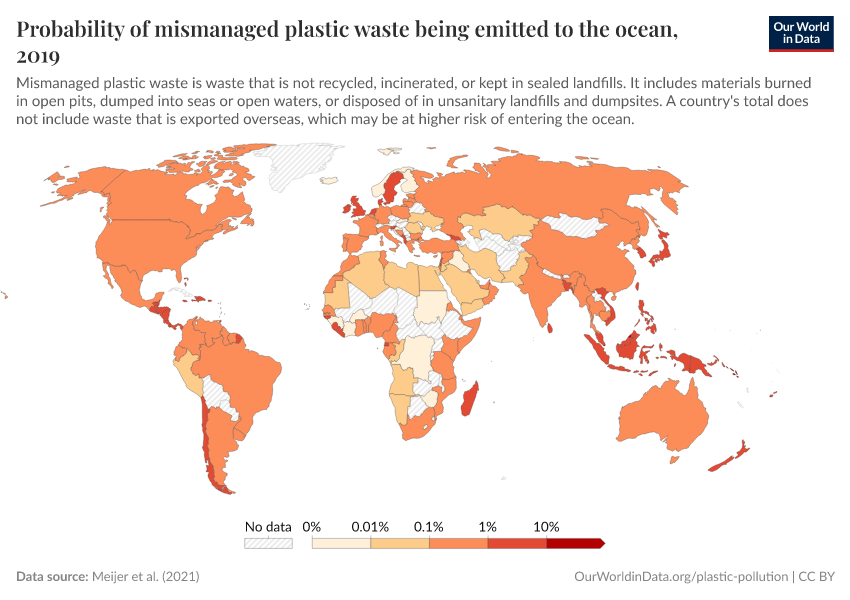
The probability that mismanaged plastic waste enters the ocean varies a lot across the world, depending on factors such as the location and length of river systems, proximity to coastlines, terrain, and precipitation patterns.

What you should know about this data
  • This data comes from the OECD’s Global Plastic Outlook.2
  • The model first uses estimates of the influx of plastics into natural environments based on widely-used metrics such as population density, GDP per capita, waste statistics, terrain and distances from rivers and coastlines.
  • It then tries to model the transport and movement of plastics in these environments based on the density of plastics, and what is know about how they behave (for example, denser plastic tends to sink, whereas lighter plastics are buoyant and move towards the ocean).
  • The uncertainties around these estimates are large. However, previous studies have found similar results, suggesting that around 1 million tonnes of plastic ends up in the ocean each year.3 Earlier estimates were as high at 8 million tonnes.
Bar chart showing the amount of plastic waste, how much is mismanaged, leaked to the environment, and transported to the ocean.

Around 350 million tonnes of plastic waste is generated, but just 1.7 million tonnes is transported to the ocean. That's 0.5%.

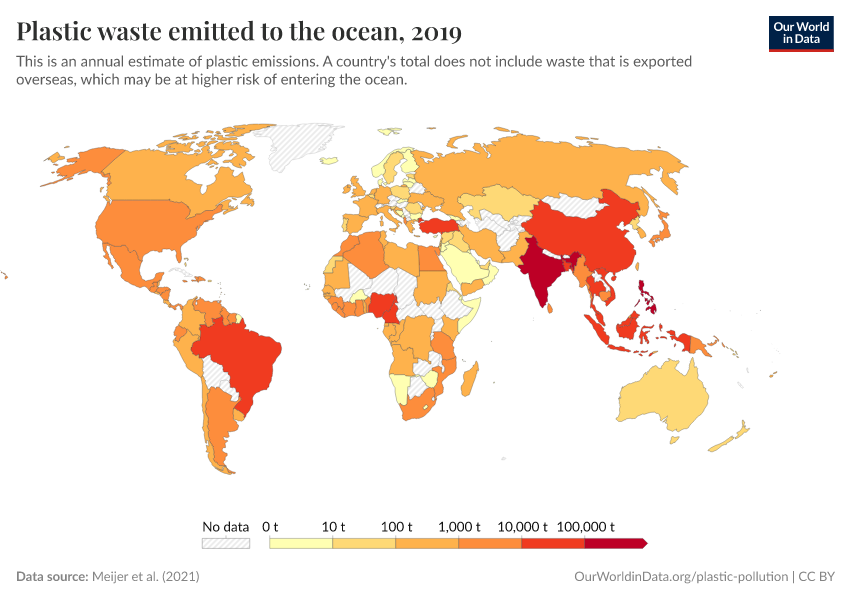
Most ocean plastics today come from middle-income countries

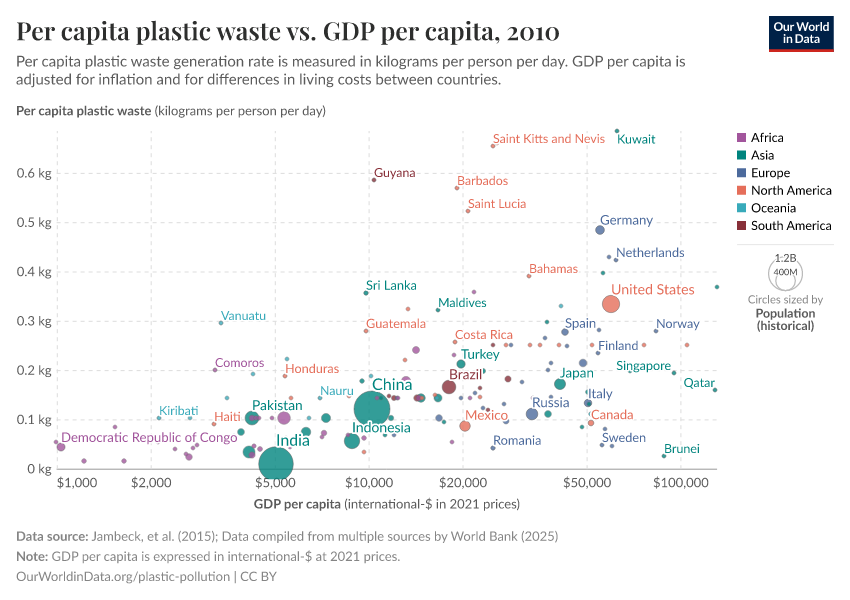
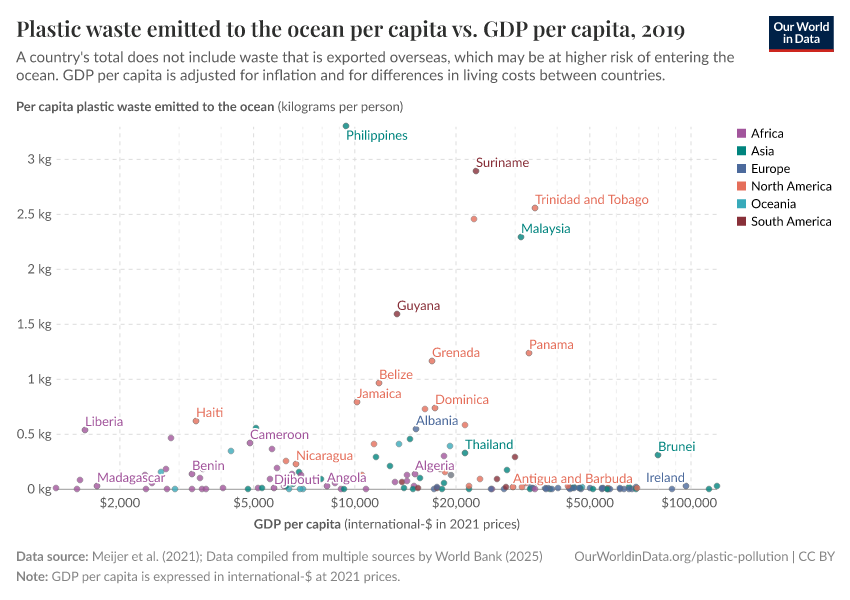
Rich countries tend to produce the most plastic waste per person.

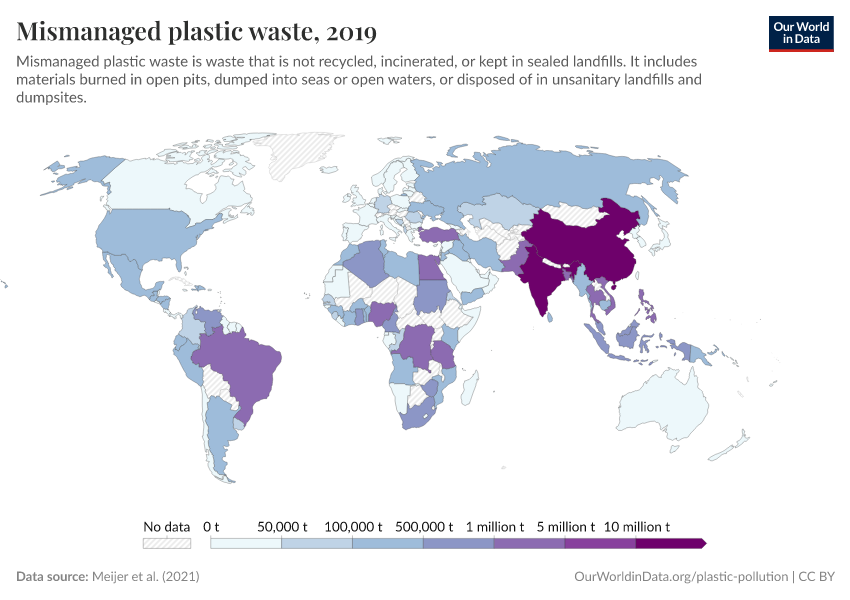
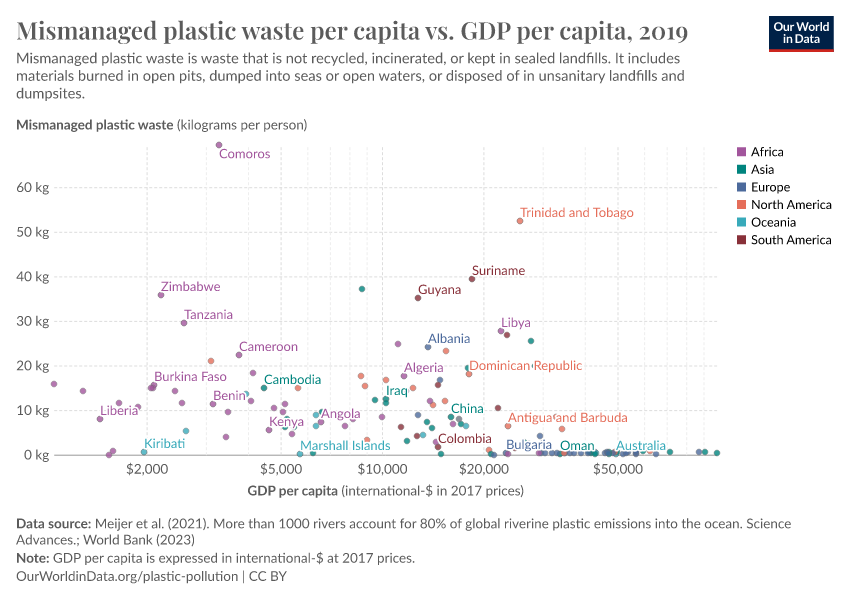
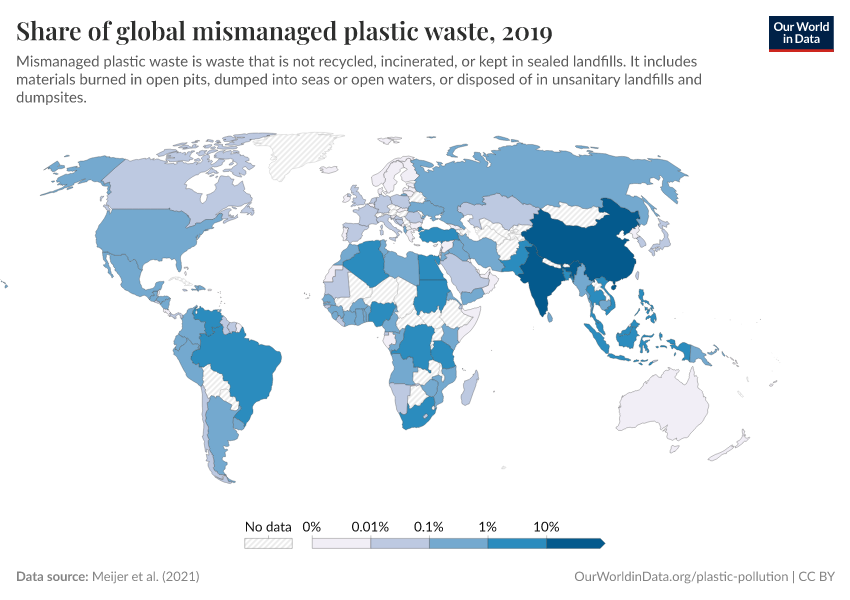
But what’s most important for plastic pollution is how much of this waste is mismanaged, meaning it is not recycled, incinerated, or kept in sealed landfills. Mismanagement means it’s at risk of leaking to the environment.

Mismanaged waste tends to be much higher in low-to-middle-income countries. This is because these countries tend to have poorer waste management infrastructure.

As is shown in the chart, most plastic flowing into the ocean today comes from middle-income countries – particularly across Asia.4

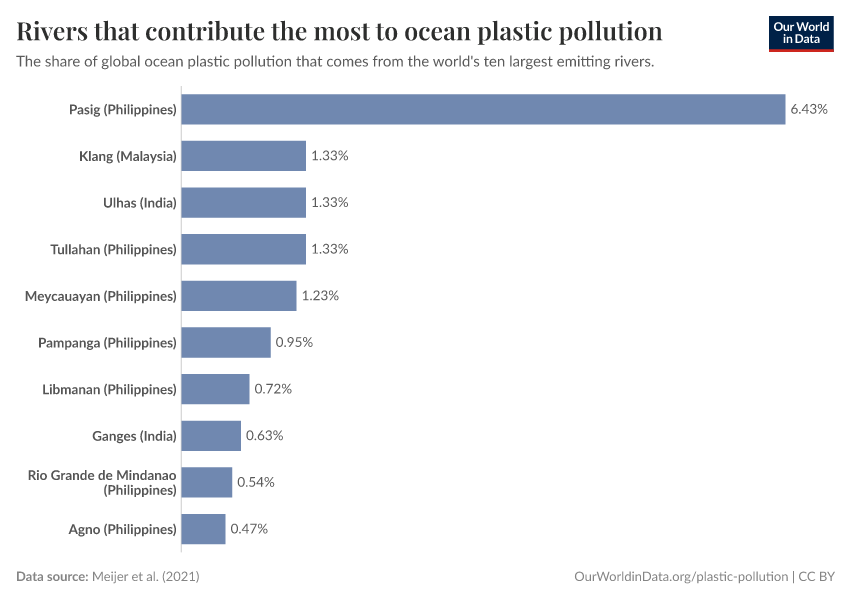
Which countries and rivers emit the most plastic to the ocean? What does this mean for solutions to tackle plastic pollution?

What you should know about this data
  • This data comes from the study by Lourens Meijer et al. (2021), which uses updated methods to estimate national and regional plastic inputs to the ocean.5
  • It combines estimates of mismanaged waste with high-resolution mapping of factors such as terrain, winds, precipitation, and river patterns to estimate how likely mismanaged waste is to be carried from rivers to the ocean.
  • Previous studies have given similar regional estimates. A 2017 study estimated that Asian countries contributed 86% of plastic emissions to the ocean.6

Only a small share of plastic gets recycled

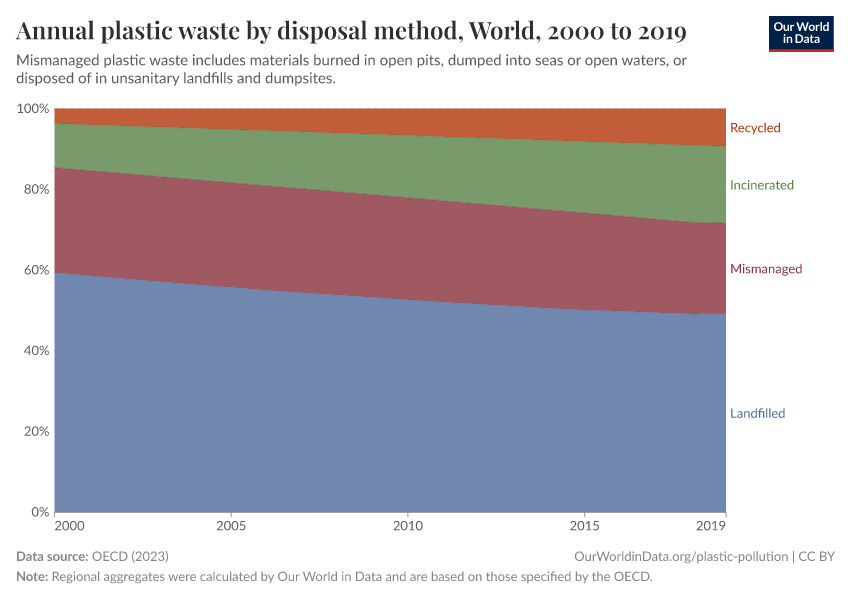
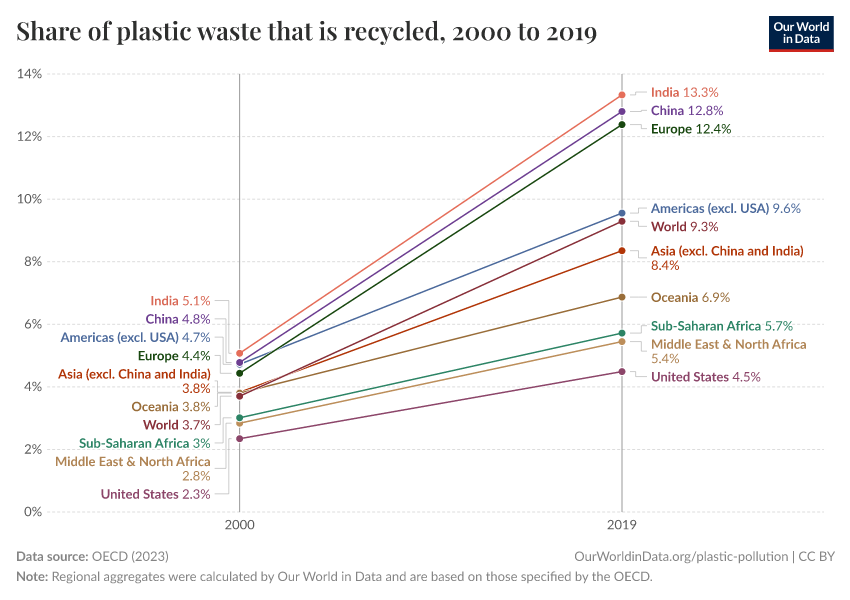
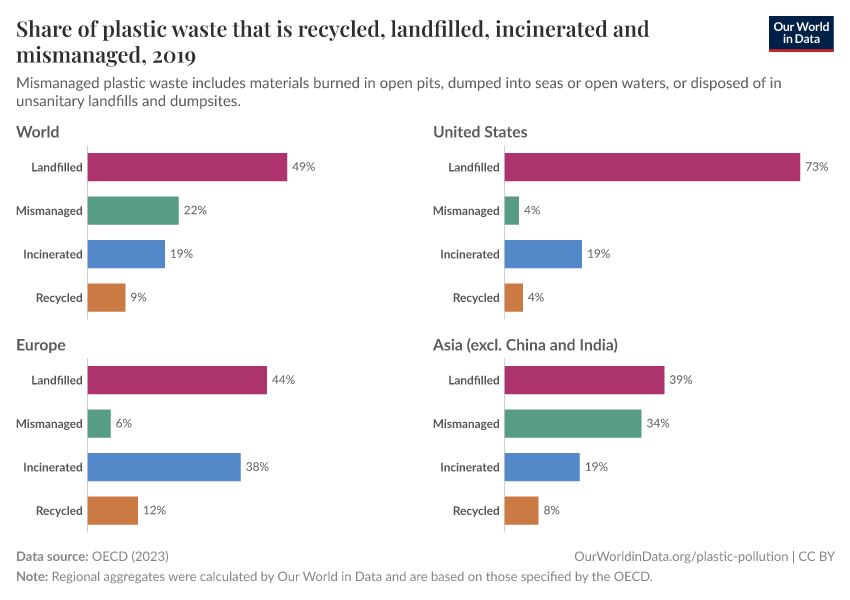
While we might think that much of the world’s plastic waste is recycled, only 9% is.

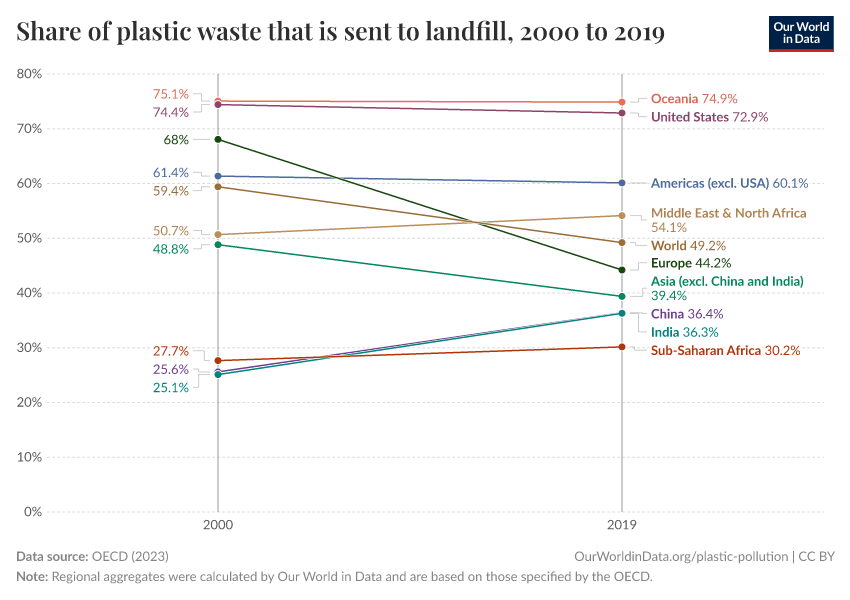
Half of the world’s plastic still goes straight to landfill. Another fifth is mismanaged – meaning it is not recycled, incinerated, or kept in sealed landfills – putting it at risk of being leaked into rivers, lakes, and the ocean.

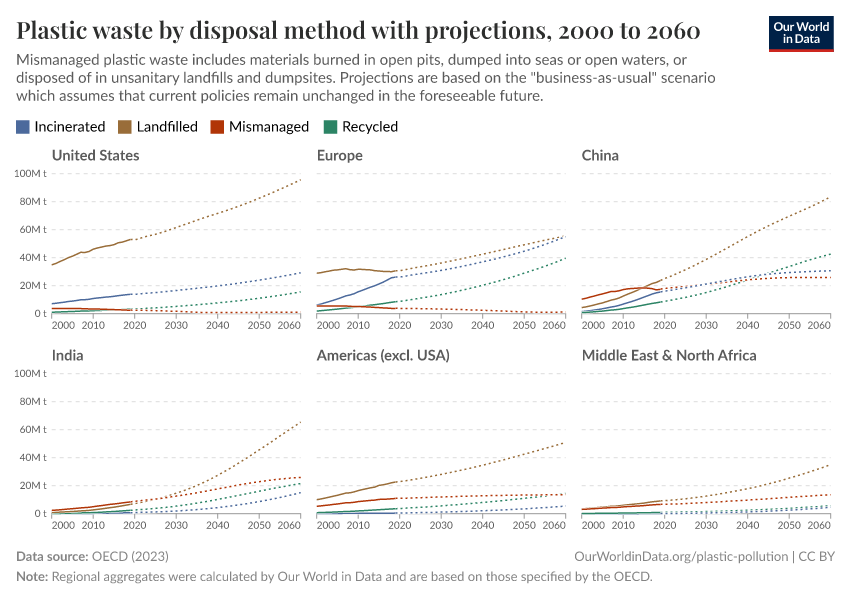
This chart gives the breakdown of waste management strategies across regions.

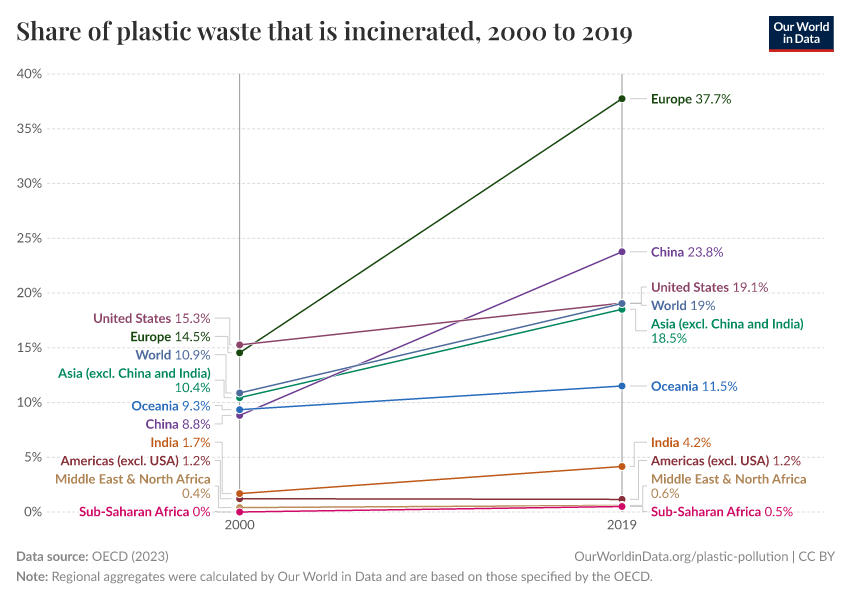
Waste management varies greatly: incineration is high in Europe, while three-quarters of plastics in the United States go to landfills.

Better waste management is key to ending plastic pollution

Improving waste management strategies is crucial to ending plastic pollution.

It is a solvable problem, and making a difference here would do much more to reduce plastic pollution than even considerably reducing plastic production. Even if the world used half as much, we’d still have significant amounts of plastic flowing into our rivers and oceans.

To end plastic pollution, waste needs to be adequately managed. Around one-fifth of plastics are still mismanaged, meaning they are not recycled, incinerated, or kept in sealed landfills.

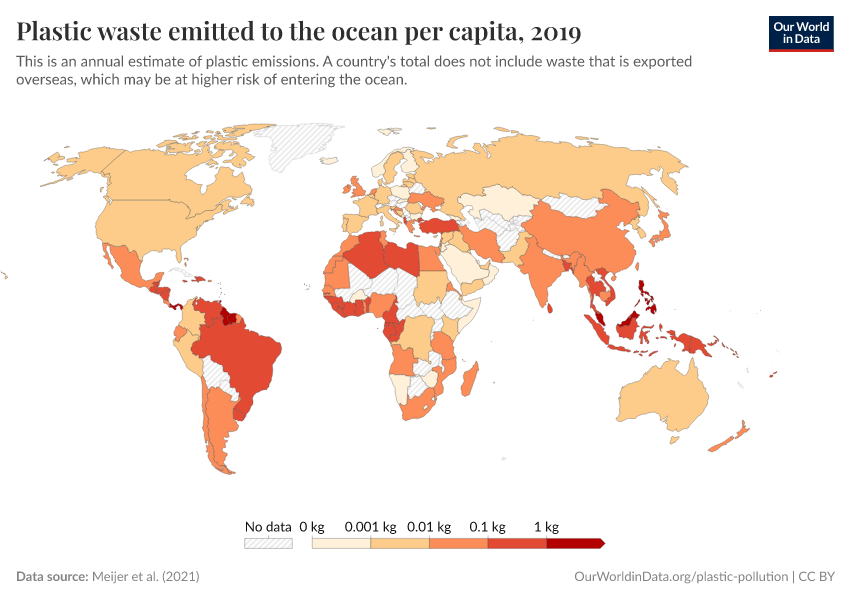
The amount of mismanaged plastic waste varies across the world but tends to be much higher in low-to-middle-income countries. This is shown in the chart in per capita terms.

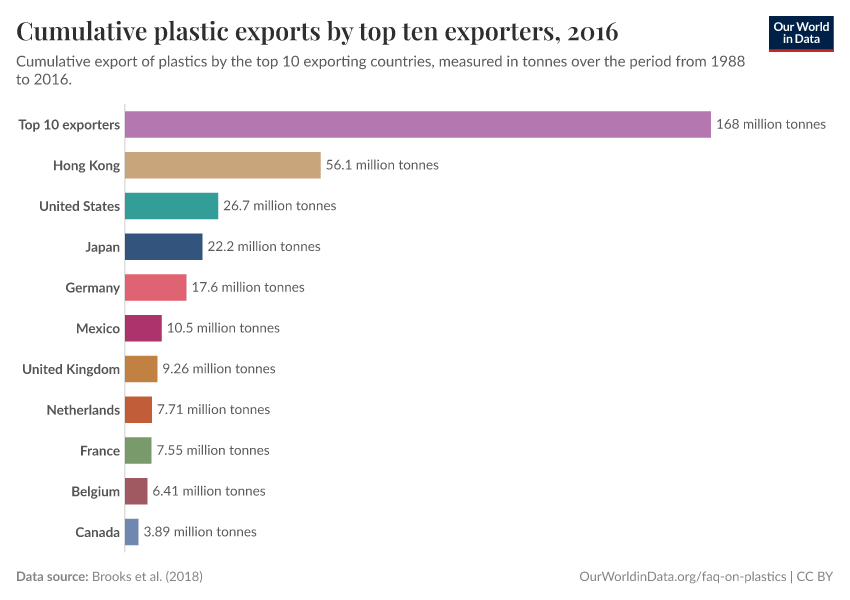
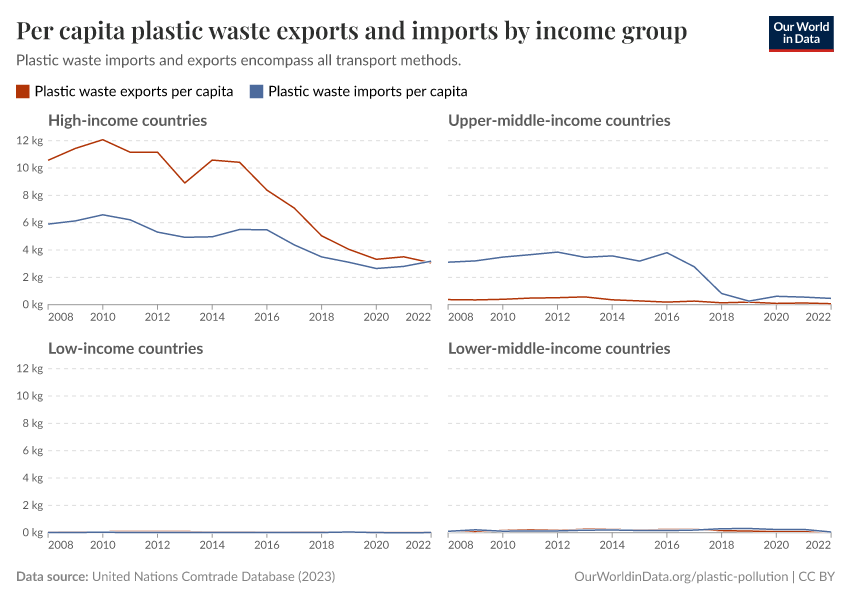
Domestic policies to improve waste management will be crucial, but richer countries can also contribute through foreign investments in waste management infrastructure.

What you should know about this data
  • This data comes from the study by Lourens Meijer et al. (2021), which uses updated methods to estimate national and regional plastic inputs to the ocean.5
  • It combines estimates of mismanaged waste with high-resolution mapping of factors such as terrain, winds, precipitation, and river patterns to estimate how likely mismanaged waste is to be carried from rivers to the ocean.
  • Previous studies have given similar regional estimates. A 2017 study estimated that Asian countries contributed 86% of plastic emissions to the ocean.6

Explore Data on Plastic Pollution

Research & Writing

Interactive Charts on Plastic Pollution

Endnotes

  1. OECD (2022), Global Plastics Outlook: Economic Drivers, Environmental Impacts and Policy Options, OECD Publishing, Paris, https://doi.org/10.1787/de747aef-en.

    Meijer, L. J., Van Emmerik, T., Van Der Ent, R., Schmidt, C., & Lebreton, L. (2021). More than 1000 rivers account for 80% of global riverine plastic emissions into the ocean. Science Advances, 7(18), eaaz5803.

  2. OECD (2022), Global Plastics Outlook: Economic Drivers, Environmental Impacts and Policy Options, OECD Publishing, Paris, https://doi.org/10.1787/de747aef-en.

  3. Meijer, L. J., Van Emmerik, T., Van Der Ent, R., Schmidt, C., & Lebreton, L. (2021). More than 1000 rivers account for 80% of global riverine plastic emissions into the ocean. Science Advances, 7(18), eaaz5803.

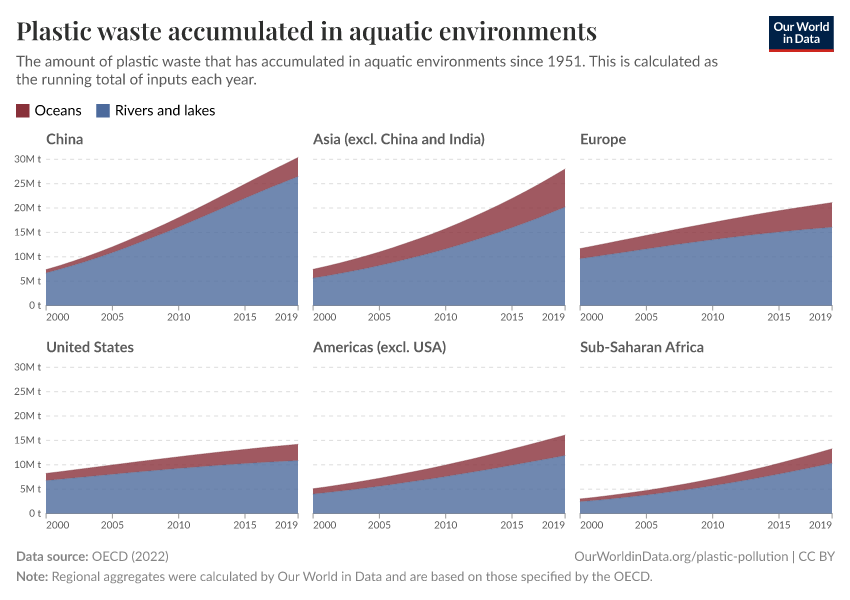
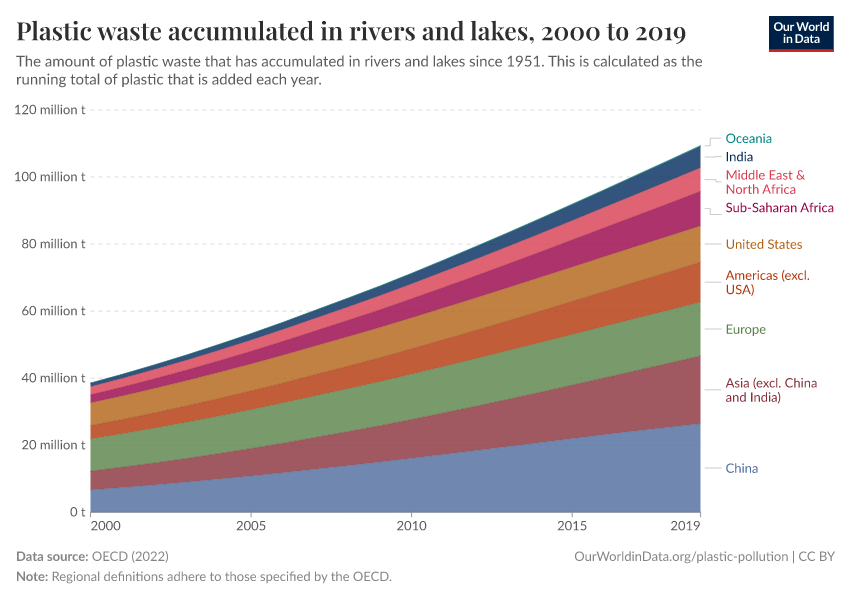
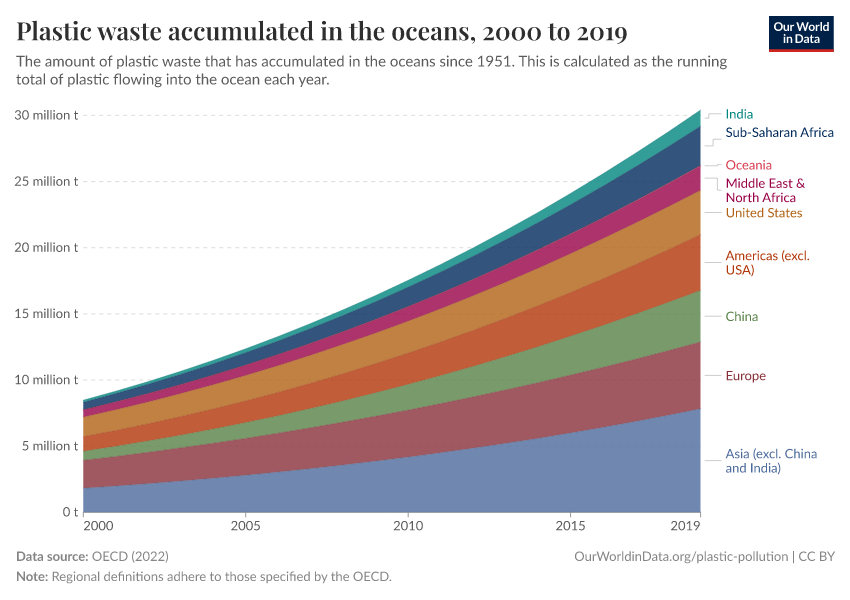
  4. But this was not always the case: richer countries have been polluting the oceans for longer periods. If we look at accumulated stocks of plastics in the ocean, higher-income countries across Europe and North America play a larger role than they do today.

  5. Meijer, L. J., Van Emmerik, T., Van Der Ent, R., Schmidt, C., & Lebreton, L. (2021). More than 1000 rivers account for 80% of global riverine plastic emissions into the ocean. Science Advances, 7(18).

  6. Lebreton, L. C., Van der Zwet, J., Damsteeg, J. W., Slat, B., Andrady, A., & Reisser, J. (2017). River plastic emissions to the world’s oceans. Nature Communications, 8, 15611.

Cite this work

Our articles and data visualizations rely on work from many different people and organizations. When citing this topic page, please also cite the underlying data sources. This topic page can be cited as:

Hannah Ritchie, Veronika Samborska and Max Roser (2023) - “Plastic Pollution” Published online at OurWorldinData.org. Retrieved from: 'https://ourworldindata.org/plastic-pollution' [Online Resource]

BibTeX citation

@article{owid-plastic-pollution,
    author = {Hannah Ritchie and Veronika Samborska and Max Roser},
    title = {Plastic Pollution},
    journal = {Our World in Data},
    year = {2023},
    note = {https://ourworldindata.org/plastic-pollution}
}
Our World in Data logo

Reuse this work freely

All visualizations, data, and code produced by Our World in Data are completely open access under the Creative Commons BY license. You have the permission to use, distribute, and reproduce these in any medium, provided the source and authors are credited.

The data produced by third parties and made available by Our World in Data is subject to the license terms from the original third-party authors. We will always indicate the original source of the data in our documentation, so you should always check the license of any such third-party data before use and redistribution.

All of our charts can be embedded in any site.