Most plastic in the Great Pacific Garbage Patch comes from the fishing industry
More than three-quarters of floating plastic debris comes from fishing activities.
The Great Pacific Garbage Patch (GPGP) is a gyre of marine debris, in the central North Pacific Ocean. It lies a few hundred miles north of Hawaii. It’s an area where large amounts of floating plastics have accumulated as a result of ocean currents.
The composition of the plastics in the GPGP are quite different from the rest of the ocean. Most of the plastic that enters the ocean comes from land-based sources – it comes from rivers or is swept towards coastlines.
Of the plastic entering the ocean, only small amounts are carried far offshore; most plastic either sinks to the seabed, or stays close to the shoreline.
The accumulation of plastics in the middle of the ocean can be quite different. We know this from taking large samples of the plastics in the GPGP. Laurent Lebreton and his colleagues have been doing large-scale surveys for years.
In a 2018 paper they found that, by mass, around 46% of the plastics were fishing nets and ropes. This was around 60% for plastics larger than 5 centimeters1
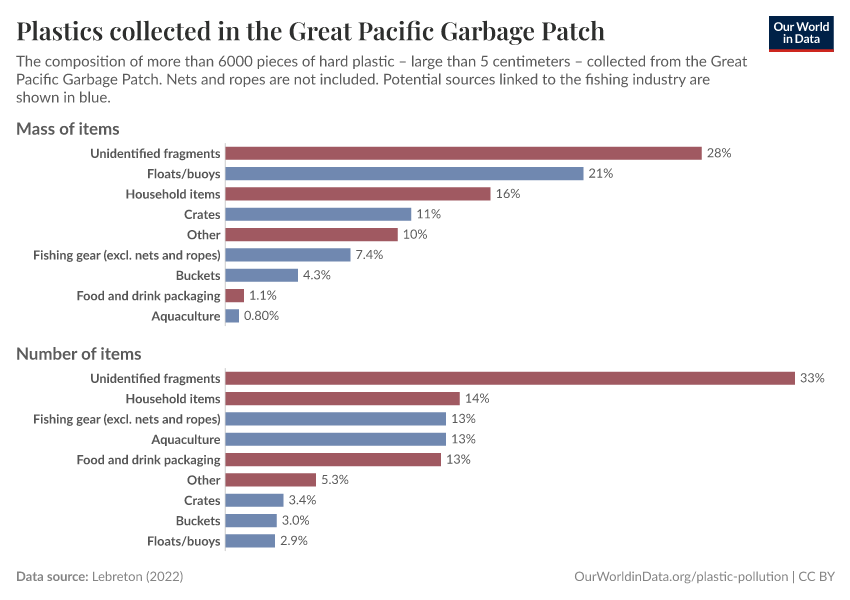
In 2022 they published another study, this time looking at the composition of hard plastics – large plastics that were larger than 5 centimeters but excluding nets or ropes.2 They retrieved over 6000 pieces of hard plastic, with the identified sources shown in the chart below.
The breakdowns are shown in terms of the number of pieces found, and the mass of debris found.
Around one-third of the plastics were small fragments that couldn’t be identified.
You can see that in terms of mass, a significant fraction of plastic comes from aquaculture and fishing materials. Add floats and buoys and crates to this, and these industries contributed around 40% of the hard plastics by mass.
Combine this with nets and ropes, and the researchers conclude that between 75% and 86% of floating plastics larger than 5 centimeters could be from abandoned, lost or discarded fishing gear.

Researchers could use language markings to estimate where this plastic came from. Most originated in just a handful of countries: Japan and China both contributed one-third each, 15% from South Korea; 5% from the United States; and 3% from Taiwan. The rest was split among other countries.
One of the reasons that Japan is thought to contribute so highly was that the 2011 Tōhoku earthquake and tsunami washed large amounts of debris offshore. Nonetheless, this research suggests that only a small number of industrialized fishing nations contribute most of the plastic in the GPGP.
Endnotes
Lebreton, L., Slat, B., Ferrari, F., Sainte-Rose, B., Aitken, J., Marthouse, R., ... & Reisser, J. (2018). Evidence that the Great Pacific Garbage Patch is rapidly accumulating plastic. Scientific reports, 8(1), 1-15.
Lebreton, L., Royer, S. J., Peytavin, A., Strietman, W. J., Smeding-Zuurendonk, I., & Egger, M. (2022). Industrialised fishing nations largely contribute to floating plastic pollution in the North Pacific subtropical gyre. Scientific Reports, 12(1), 12666.
Cite this work
Our articles and data visualizations rely on work from many different people and organizations. When citing this article, please also cite the underlying data sources. This article can be cited as:
Hannah Ritchie (2023) - “Most plastic in the Great Pacific Garbage Patch comes from the fishing industry” Published online at OurWorldinData.org. Retrieved from: 'https://archive.ourworldindata.org/20251125-173858/plastic-great-pacific-garbage.html' [Online Resource] (archived on November 25, 2025).BibTeX citation
@article{owid-plastic-great-pacific-garbage,
    author = {Hannah Ritchie},
    title = {Most plastic in the Great Pacific Garbage Patch comes from the fishing industry},
    journal = {Our World in Data},
    year = {2023},
    note = {https://archive.ourworldindata.org/20251125-173858/plastic-great-pacific-garbage.html}
}
Reuse this work freely
All visualizations, data, and code produced by Our World in Data are completely open access under the Creative Commons BY license. You have the permission to use, distribute, and reproduce these in any medium, provided the source and authors are credited.
The data produced by third parties and made available by Our World in Data is subject to the license terms from the original third-party authors. We will always indicate the original source of the data in our documentation, so you should always check the license of any such third-party data before use and redistribution.
All of our charts can be embedded in any site.