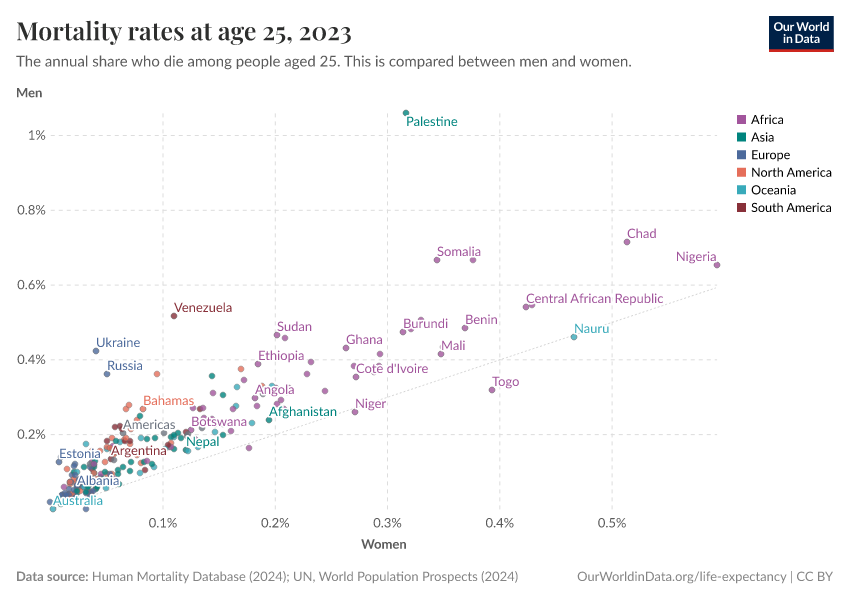
Interactive visualization requires JavaScript
Related research and data
Charts
- Annual death rate by age group
- Annual death rate from all causes
- Annual death rates at different ages
- Annual death rates at different ages in females
- Annual death rates at different ages in males
- Annual death rates in people of different ages, by sex
- Average number of years living with disability or disease
- Country with highest female life expectancy
- Crude death rate
- Death rate from conflict and terrorismIHME, age-standardized
- Death rate from conflict and terrorismIHME, crude
- Death rates from different causesWHO Mortality Database, age-standardized
- Deaths from conflict and terrorismIHME, GBD
- Healthy life expectancyWHO GHO data
- Healthy life expectancy and years lived with disability or disease
- Healthy life expectancy vs. health spending per capita
- How do death rates in each age group contribute to the overall sex gap in life expectancy?
- Life expectancyover the long-run
- Life expectancyHMD, UN WPP
- Life expectancy
- Life expectancyUN WPP data
- Life expectancyWHO GHO data
- Life expectancyOECD data
- Life expectancy at age 15
- Life expectancy by gender
- Life expectancy by sexHMD, UN WPP data
- Life expectancy for people of different ages
- Life expectancy in men
- Life expectancy in women
- Life expectancy of women vs. menUN WPP
- Life expectancy projections
- Life expectancy versus lifespan inequality
- Life expectancy vs. GDP per capitaWorld Bank
- Life expectancy vs. GDP per capitaMaddison, historical
- Life expectancy vs. health spendingOECD
- Life expectancy vs. health spendingWorld Bank
- Life expectancy, including UN projectionsUN WPP data
- Life expectancy, source comparison
- Lifespan inequality: Gini coefficient by sex
- Lifespan inequality: Gini coefficient in men
- Lifespan inequality: Gini coefficient in women
- Median age
- Modal age at death in adults
- Mortality rates at age 65
- Number of deaths by ageUN
- Number of deaths, by world region
- Period versus cohort life expectancy
- Probability of dying in infancy, by sex
- Probability of dying that year, among females
- Probability of dying that year, among males
- Probability that a man will outlive a woman
- Remaining life expectancy at different ages
- Remaining life expectancy at different ages, in females
- Remaining life expectancy at different ages, in males
- Sex gap in life expectancy
- Sex gap in life expectancy at age 45
- Sex gap in life expectancy at different ages
- Sex gap in life expectancy versus GDP per capita
- Sex gap in life expectancy versus child mortality
- Sex ratio in life expectancy
- Sex ratio in life expectancy at different ages
- Share in extreme poverty vs. life expectancy
- Share of men and women expected to survive to the age of 65
- Share of men expected to survive to the age of 65
- Share of women expected to survive to the age of 65
- Survival ages across the population
- Years lived with disability vs. health spending per capita