Interactive visualization requires JavaScript
Related research and data
- If the world adopted a plant-based diet, we would reduce global agricultural land use from 4 to 1 billion hectares
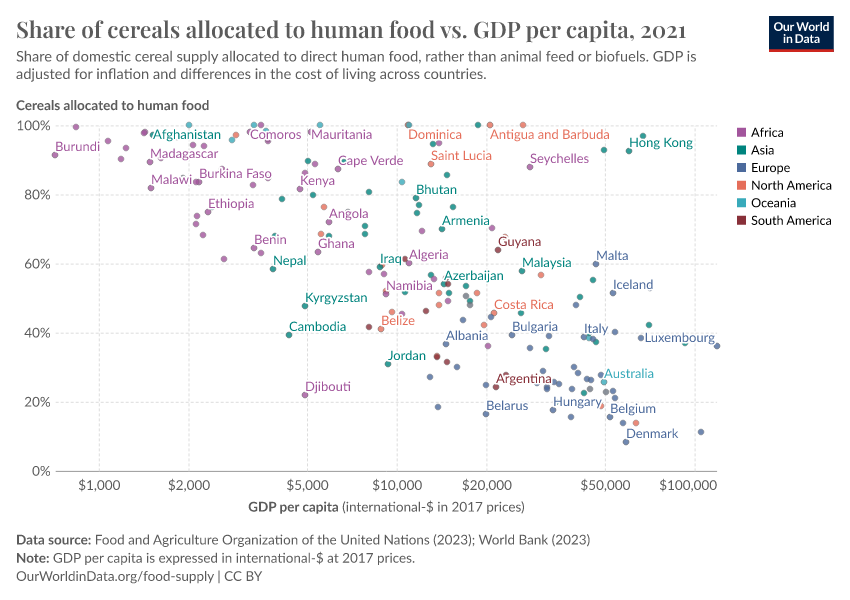
- Richer countries often use much of their crops for animal feed and biofuels
Charts
- Animal protein consumption
- Calorie supply by food group
- Cereals: which countries are net importers and exporters?
- Cocoa bean consumption per person
- Cropland per person over the long-term
- Daily meat consumption per person
- Daily per capita fat supply
- Daily per capita fat supply vs. GDP per capita
- Daily per capita protein supply
- Daily per capita protein supply vs. GDP per capita
- Daily per capita supply of calories vs. GDP per capita
- Daily protein supply from animal and plant-based foods
- Daily protein supply of animal origin vs. plant origin
- Daily supply of calories per person
- Fish catch per unit of fishing power
- Food loss index
- Food supply vs. life expectancy
- Global food production: how much comes from Ukraine & Russia?
- Maize exports from Ukraine and Russia in perspective
- Meat supply per person
- Net trade of food products as a share of domestic supply
- Palm oil imports
- Per capita sources of protein
- Protein supply from animal foods vs. GDP per capita
- Share of adults who are obese vs. daily protein supply
- Share of calories from cereals, roots, and tubers vs. GDP per capita
- Share of calories in each food group that are lost or wasted
- Share of dietary energy derived from protein vs. GDP per capita
- Share of dietary energy supply from carbohydrates vs. GDP per capita
- Share of dietary energy supply from fats vs. GDP per capita
- Share of global food loss and waste by region
- Share of people who are undernourished vs. daily supply of calories
- Share of the daily calorie supply that comes from animal protein
- Share of the population defined as severely food insecure vs. undernourished
- Total reserves in months of imports
- Vegetable oil production
- Vegetable oil supply per person vs. GDP per capita
- Vegetable supply per person vs. GDP per capita
- Wheat exports from Ukraine and Russia in perspective
- Yields of key staple crops