Excess mortality during the Coronavirus pandemic (COVID-19)
Excess mortality during COVID-19
What is “excess mortality”?
Excess mortality is a statistical term that refers to the additional number of deaths, from all causes, during a crisis, above the level we expect to see in “normal” conditions.1
In this case, we’re interested in comparing the number of deaths during the COVID-19 pandemic to the number we would have expected had the pandemic not occurred. This is a very important statistic that cannot be known but can be estimated in several ways.
Excess mortality is a more comprehensive measure of the total mortality impact of the pandemic, compared to the number of confirmed COVID-19 deaths. This is because it captures not only confirmed deaths, but also COVID-19 deaths that were not accurately diagnosed and reported2 as well as deaths from other causes that are attributable to disruptions and overall crisis conditions.3
In the section “Excess mortality during COVID-19: background”, we discuss the relationship between confirmed COVID-19 deaths and excess mortality in further detail.
How is excess mortality measured?
Excess mortality is measured as the difference between the number of deaths actually reported during a given period, versus the “baseline” number of deaths expected during that period if the COVID-19 pandemic had not occurred.
Excess deaths = Number of reported deaths – Number of expected deaths
The baseline number of expected deaths can be estimated in several different ways.
We use estimates produced by Ariel Karlinsky and Dmitry Kobak as part of their World Mortality Dataset (WMD).4 To produce this estimate, they first fit a regression model for each region using historical death data from 2015–2019.5 They then use the model to project the number of deaths we might normally have expected in 2020–2024.6 Their model captures both seasonal variation and year-to-year trends in mortality.
For more details on this method, see the study by Karlinsky and Kobak (2021).7
Previously, we had used a different baseline for expected deaths: the average number of deaths over the years 2015–2019.8
We made this change because using a simple five-year average for the baseline has important limitations. A major limitation is that it does not account for year-to-year trends in mortality. For example, increases in the annual number of deaths due to a growing and aging population would lead to an increasing number of baseline deaths over time. Therefore, using the previous five-year average could lead to misestimating excess mortality.
On the other hand, the WMD projection accounts for year-to-year trends and does not suffer from this limitation. Our charts using the five-year average are still accessible in the links in the sections below.
For reported deaths, we have sourced our data from both WMD and the Human Mortality Database.
The P-score: a measure of excess mortality that is more comparable across countries
The raw number of excess deaths gives us a sense of scale, but it is less comparable between countries because they can have large differences in population sizes and annual expected deaths.
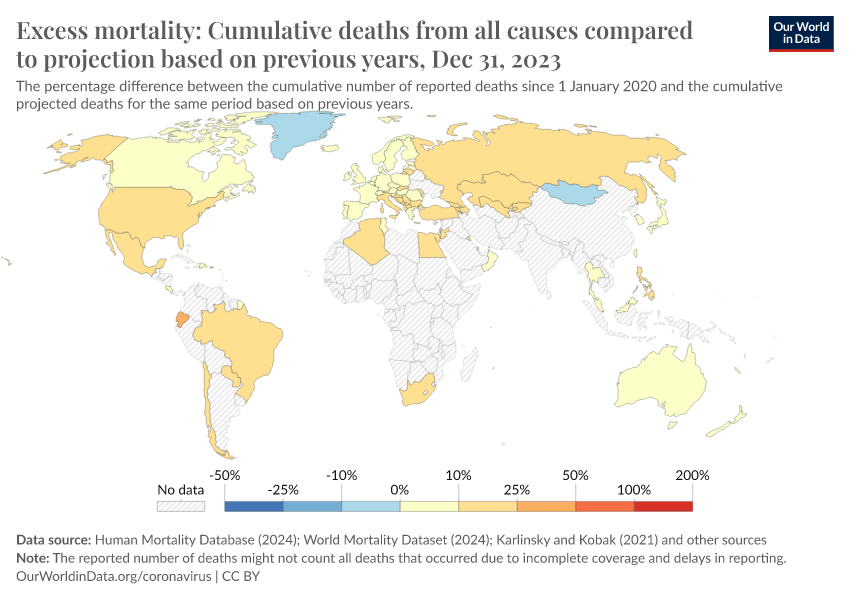
To help make better comparisons between countries, we measure excess mortality as the percentage difference between the reported and projected number of deaths.
This metric is called the “P-score”, and we calculate it as:9
P-score = [ (Reported deaths – Projected deaths) / Projected deaths ] x 100
For example, if a country had a P-score of 100% in a given week in 2020, it would mean that the country had a death count for that week that was 100% higher than the projected death count for that week, in other words, twice as high.
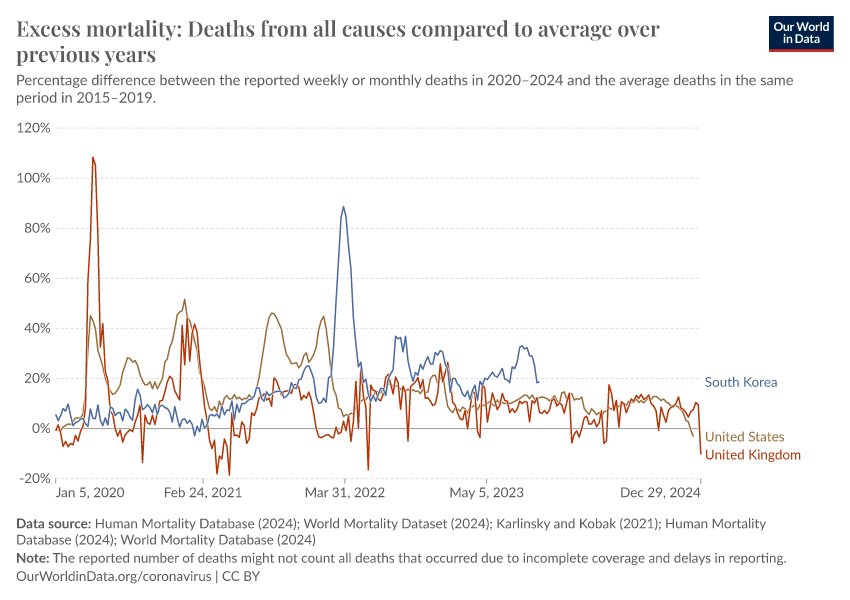
Excess mortality P-scores
The chart here shows excess mortality during the pandemic for all ages using the P-score.
Important points about excess mortality figures to keep in mind
The reported number of deaths might not count all deaths that occurred. This is the case for two reasons:
- First, not all countries have the capacity to register and report all deaths. In many low- and middle-income countries, a large share of deaths are not recorded in vital registries. This is often because of a lack of hospitals, healthcare staff, and infrastructure to register deaths. These problems may be worsened during the pandemic.10
- Second, there are delays in death reporting, which means mortality data can be provisional and incomplete in the weeks, months, or even years after a death occurs — even in richer countries with high-quality mortality reporting systems.11 The extent of the delay varies by country. For some, the most recent data points are clearly very incomplete and therefore inaccurate — we do not show these clearly incomplete data points.12
The date associated with a death may refer to when the death occurred or when it was registered. This varies by country. Death counts by date of registration can vary day-by-day even if there is no actual variation in deaths, for example, due to registration delays or the closure of registration offices on weekends and holidays. It can also be the case that deaths are registered, but the date of death is unknown — this is the case for Sweden.13
The dates of any particular reporting week might differ slightly between countries. This is because countries that report weekly data define the start and end days of the week differently. Most follow the international standard ISO 8601, which defines the week as from Monday to Sunday, but not all countries follow this standard.14 In the charts on this page we use the ISO 8601 week end dates from 2020–2024.15
Weekly reported deaths might not be directly comparable to monthly reported deaths. For instance, because excess mortality calculated from monthly data tends to be lower than the excess calculated from weekly data.16
For more discussion and detail on these points, see our article with John Muellbauer and Janine Aron as well as the methods and metadata from the Human Mortality Database and World Mortality Dataset.

Related charts:
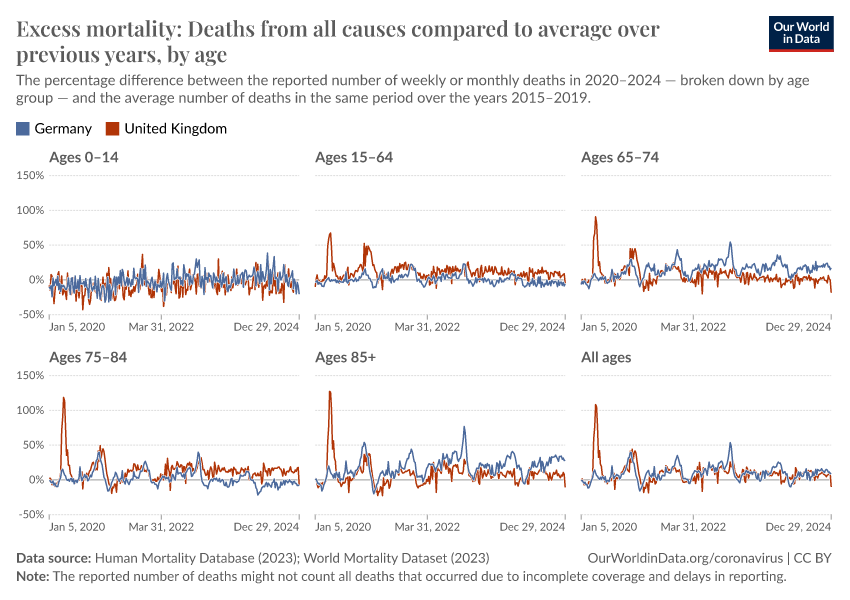
Excess mortality P-scores by age group
The chart here shows P-scores broken down by age groups. The mortality risk from COVID-19 and other respiratory diseases increases exponentially with age.
Countries whose data on reported deaths is sourced from the World Mortality Dataset are not included in this chart because the data is not broken down by age. However, WMD does provide the projected baselines used for calculating P-scores by age in this chart.17
Why is it informative to look at P-scores for different age groups?
The chart in the previous section showed P-scores for all ages — these are affected by differences in the mortality risk by age and countries’ age structures.
For example, countries with older populations will tend to have higher overall P-scores by default.
Looking at the P-scores within age groups is therefore informative when comparing countries.

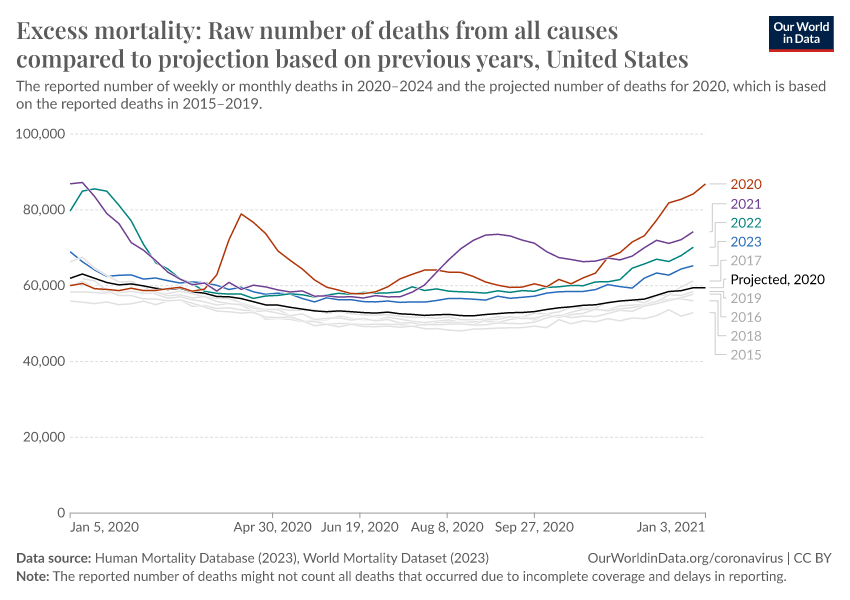
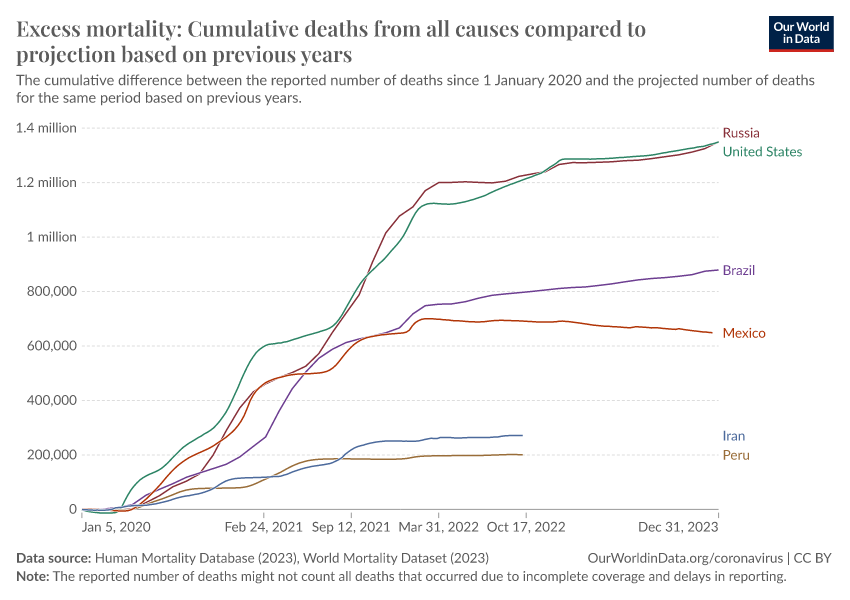
Excess mortality using raw death counts
Besides visualizing excess mortality as a percentage difference as we have with the P-scores, we can also look at the raw death count as shown in the chart here.
The raw death count gives us a sense of scale: for example, the US suffered roughly 480,000 excess deaths in 2020, compared to 350,000 confirmed COVID-19 deaths during that year.
However, this measure is less comparable across countries due to large differences in population sizes. You can see the death counts for other countries by clicking “Change country” on the chart.

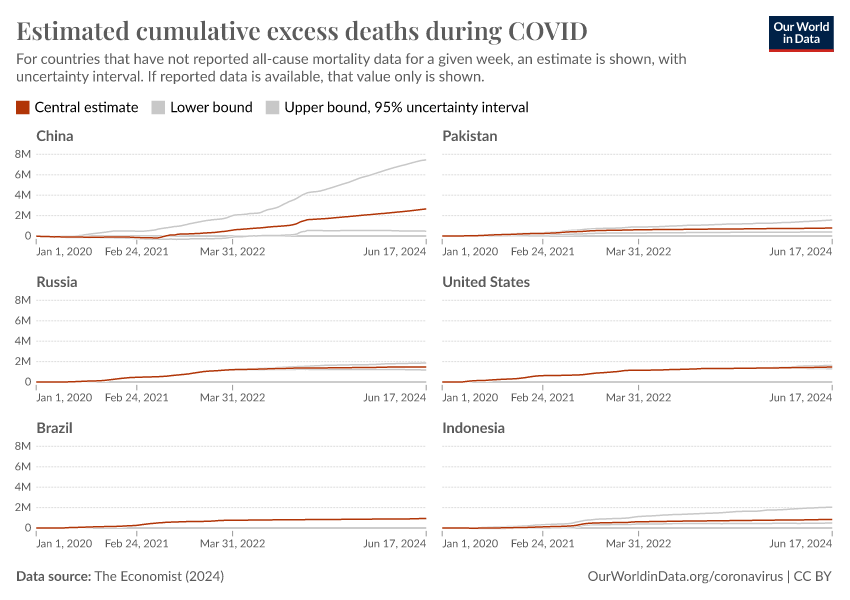
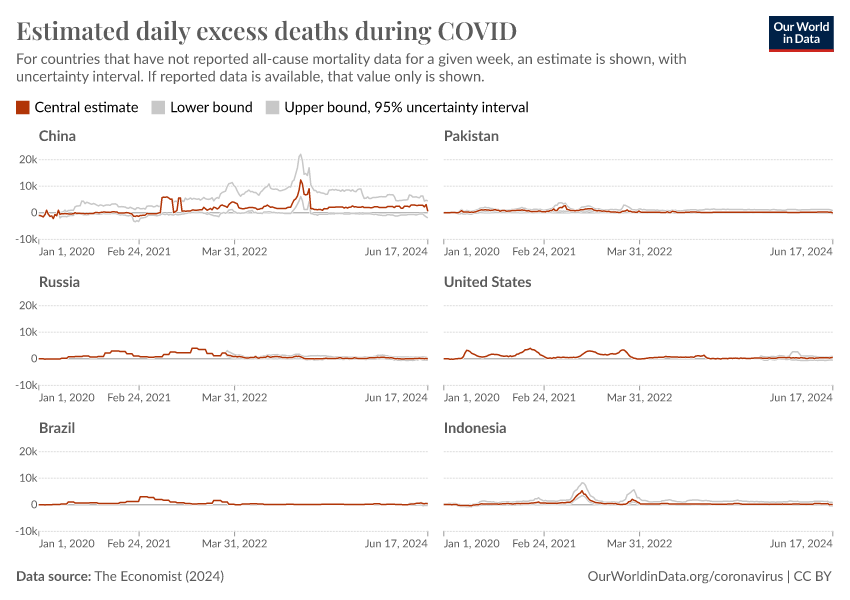
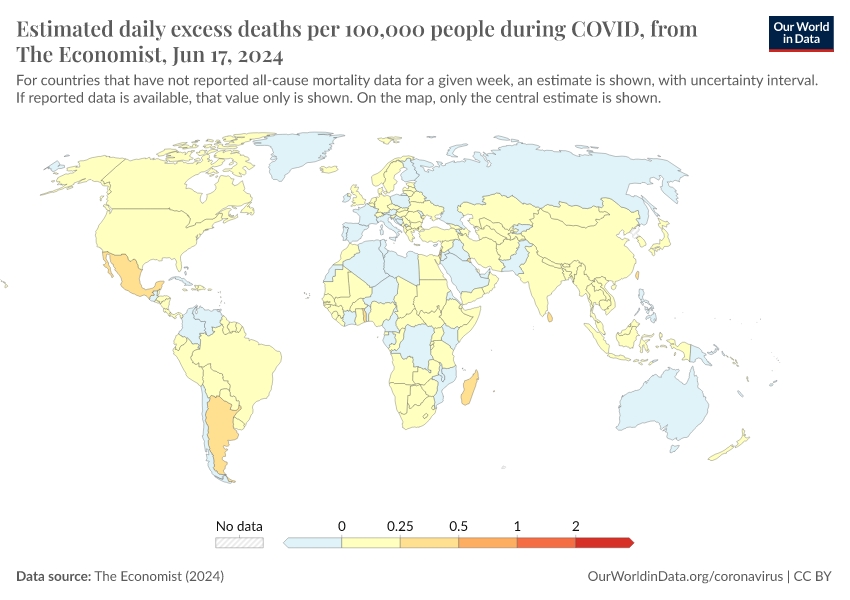
Estimated excess mortality from The Economist
Many countries have not reported any data on all-cause mortality during the pandemic. If we want to estimate the total impact of the pandemic on deaths in those countries, or at a global scale, we must find a way to estimate this death toll.
The Economist built a machine-learning model to estimate the number of excess deaths in 223 countries and regions.18 From these country-level estimates, they have calculated global statistics.
Globally, their model estimates that the total number of excess deaths is two to four times higher than the reported number of confirmed deaths due to COVID-19.19
What should we conclude from these estimates?
This research by The Economist is one of the most comprehensive and rigorous attempts to estimate the pandemic’s impact on mortality at the global level. However, the estimates come with a great deal of uncertainty because of the large amount of missing data, such as due to poor death registration, and the known limitations even for data that is available.
We can think of them as our best educated — but still ballpark — estimates. Some of the specific statistics are highly uncertain, as the large uncertainty intervals show.
But the overall conclusion remains clear: in many countries, and globally, the number of confirmed deaths from COVID-19 is far below the pandemic’s full death toll.

Related charts:

Related charts:
Estimated excess mortality from the World Health Organization
On 5 May 2022, the WHO published estimates of the number of excess deaths for 194 countries and regions, as well as a global total. These estimates cover the period from the start of 2020 to the end of 2021.
Similar to The Economist, the WHO estimates that the total number of excess deaths is substantially higher than the number of confirmed deaths due to COVID-19.
Though broadly similar, the estimates from the WHO and The Economist differ because they use different methods to estimate both the baseline of expected deaths and all-cause mortality data in countries that have not reported deaths during 2020 and 2021.
You can compare the estimates in the chart here, and read in more detail about the methods of the WHO and The Economist.


Excess mortality: our data sources
Our World in Data relies on data from the Human Mortality Database, the World Mortality Dataset, The Economist, and the World Health Organization
In our presentation of excess mortality figures, we rely on reported all-cause mortality data from the Human Mortality Database (HMD) and the World Mortality Dataset (WMD). We also present model estimates of excess deaths published by The Economist and the WHO.
We have calculated P-scores from the reported death data provided by HMD and WMD, and from the projections provided by WMD.
Our work belongs to everyone
Download the complete Our World in Data COVID-19 dataset
- All our code is open-source
- All our research and visualizations are free for everyone to use for all purposes
Human Mortality Database
The Human Mortality Database (HMD) is maintained by a team of researchers based at the University of California, Berkeley, USA and the Max Planck Institute for Demographic Research in Rostock, Germany.
HMD has been publishing updates on all-cause mortality for around 40 countries as part of its Short-term Mortality Fluctuations (STMF) project since May 2020.20
HMD updates its data weekly. The data is sourced from Eurostat and national statistical agencies — a full list of sources and detailed information for each country’s data series can be found in the HMD methods. The HMD was our sole source of data until 20 February 2021.
You can read more about HMD's STMF project in the article below.21
World Mortality Dataset
The World Mortality Dataset is maintained by the researchers Ariel Karlinsky and Dmitry Kobak. WMD has been publishing updates on all-cause mortality for over a hundred countries and regions since January 2021. The data is not broken down by age so we only include it in our all-age charts.22
As of 20 September 2021, we use WMD's projected deaths for 2020–2024 as our baseline for the expected deaths had the COVID-19 pandemic not occurred. We use this baseline for all countries and regions, including for deaths broken down by age group.23
WMD updates its data weekly. Their data is sourced from the Human Mortality Database, Eurostat, and national statistical agencies.24 A full list of sources and information for each country’s data series can be found on WMD’s GitHub repository.
You can read more about WMD in their study.25
The Economist
The Economist built a machine-learning model to estimate the number of excess deaths during the pandemic for 223 countries and regions. From these country-level estimates, they calculated a global figure.
The Economist presents the model estimates and details their sources in their article “The pandemic's true death toll.” They describe their model methodology in their article “How we estimated the true death toll of the pandemic.”
World Health Organization
The WHO published estimates of the number of excess deaths during 2020 and 2021 for 194 countries and regions, as well as a global total.
The WHO presents the model estimates in the following reports:
- Global excess deaths associated with COVID-19 (modelled estimates)
- Msemburi et al. (2023). The WHO estimates of excess mortality associated with the COVID-19 pandemic. Nature.
The WHO describes the methodology in the following reports:
- Methods for estimating the excess mortality associated with the COVID-19 pandemic
- Knutson et al. (2023). Estimating global and country-specific excess mortality during the Covid-19 pandemic. The Annals of Applied Statistics.
Other publicly available data on excess mortality
International organizations are not publishing an international database on excess mortality
Unlike statistics on confirmed COVID-19 deaths — for which several organizations such as the WHO, ECDC, and Johns Hopkins University have collated data for all countries — there is no single source of data on excess mortality.
No data source has data for all countries because excess mortality statistics come from a limited number of countries.
This is a major problem for policymakers, researchers, and the general public who need to understand the ongoing pandemic.
Several media publications and regional data sources are publishing public databases
In addition to the Human Mortality Database and the World Mortality Dataset, several media publications and regional data sources have been publishing excess death data for some countries.
- The Economist published the first database on excess mortality on GitHub. Its reporting on the topic can be found here. We show their global estimates of excess mortality in the section here.
- The New York Times publishes its dataset on excess mortality on GitHub. Its reporting on the topic can be found here.
- The Financial Times publishes its dataset on excess mortality on GitHub. Its reporting on the topic can be found here.
- The Washington Post publishes its dataset on excess mortality in the US on GitHub. The GitHub page also contains links to the Post's reporting on the topic.
- Eurostat publishes downloadable data for European countries on its website.
Excess mortality during COVID-19: background
What is the relationship between confirmed COVID-19 deaths and excess mortality?
In our work on the COVID-19 pandemic, we visualize the number of confirmed COVID-19 deaths for all countries. We update this data weekly based on figures published by the World Health Organization (WHO).
But these confirmed deaths figures may differ from the excess mortality figures, which better capture the total impact of the pandemic on deaths, for several reasons:
- Some countries only report COVID-19 deaths that occur in hospitals — people who die from the disease at home may not be recorded
- Countries differ in how they report COVID-19 deaths: some include only where COVID-19 test has returned positive — others may include deaths where a doctor has determined there was a probable COVID-19 infection
- Death reporting systems may be limited or dysfunctional — this is particularly true in poorer countries
- The pandemic may result in increased deaths from other causes for a number of reasons including weakened healthcare systems; fewer people seeking treatment for other health risks; or less available funding and treatment for other diseases, such as HIV/AIDS, malaria, and tuberculosis.26
- The pandemic may have resulted in fewer deaths from other causes. For example, the mobility restrictions during the pandemic might have led to fewer deaths from road accidents. Or there may have been fewer deaths from respiratory infections such as influenza because of social distancing. In some individuals, COVID-19 may have resulted in only a slightly earlier death, and they may have died from another cause soon after.
Because COVID-19 "competes" with other causes of death like the flu, this means that COVID-19 deaths are not by default excess deaths.
Therefore, it is possible for there to be more confirmed COVID-19 deaths than excess deaths, for there to be confirmed COVID-19 deaths without any excess deaths, or for there to be negative numbers of excess deaths in some countries.
This all makes clear that the two statistics — confirmed deaths due to COVID-19 and excess mortality — can be related in ways that are not straightforward.
This is because they are giving a perspective on different questions:
- The number of confirmed COVID-19 deaths is often an underestimate of the number of actual COVID-19 deaths, and often underestimates the overall impact of the pandemic on mortality. But, in contrast to excess deaths, it contains information about the cause of death.
- The excess mortality includes not only those who have died from COVID-19 but also deaths from all other causes — and these numbers may also be changing due to the overall pandemic conditions.
This means both metrics are needed to understand the total impact of the pandemic on deaths.
Excess mortality statistics will only be available for a minority of countries
When the goal is to monitor a global pandemic, the excess mortality metric can come with large uncertainties, especially in poor countries. This is because excess mortality data is unfortunately not available in countries with limited death registration and statistical institutions, and this data will continue to be missing for previous years.
Excess mortality can only be calculated using accurate, regular data on mortality from previous years. Only a limited number of countries have statistical agencies with the capacity and infrastructure to report the number of people who died in a given month, week, or even day. For most low—and middle-income countries, such data is not available for previous years.
Read more in our article:
As we saw above, this data is typically only available for richer countries with high-quality data reporting systems.
Researchers can draw on some other sources to estimate excess mortality — such as burial records, household surveys, and other sources — or on data from subnational regions within poorer countries, such as their capital. But many countries lack even this underlying data.
Our work belongs to everyone
Download the complete Our World in Data COVID-19 dataset
- All our code is open-source
- All our research and visualizations are free for everyone to use for all purposes
Endnotes
Checchi, F., & Roberts, L. (2005). Interpreting and using mortality data in humanitarian emergencies. Humanitarian Practice Network, 52.
For example, if no COVID-19 test was conducted, or a country’s death reporting system failed to register deaths as COVID deaths.
Crisis conditions include situations such as health systems being overwhelmed, resources being diverted away from other health problems, or fewer people seeking treatment for other health risks.
A working paper with data from England estimates that for every 30 COVID deaths there is at least one avoidable non-COVID excess death in hospitals. See Fetzer and Rauh (2022) Pandemic Pressures and Public Health Care: Evidence from England.
We use this estimate as of 20 September 2021.
Or as many years from this period as are available.
Before 18 January 2022, WMD published a projection only for 2020 to avoid further extrapolation from the historical data. As of 18 January 2022, they do publish—and we use—separate projections for each year (that is, 2020, 2021, 2022, 2023, and so on).
Karlinsky, A. and Kobak, D. (2021). Tracking excess mortality across countries during the COVID-19 pandemic with the World Mortality Dataset. eLife, DOI: 10.7554/eLife.69336.
Except for a few countries for which we only have data from the years 2016 or 2017 to 2019; for details see this spreadsheet and the Human Mortality Database metadata.
We calculate P-scores using the reported deaths data for 2020–2024 from HMD and WMD — see here for country-by-country source information — and the projected deaths for 2020–2024 from WMD (which we use for all countries and regions, including for deaths broken down by age group).
See this spreadsheet for the UN-estimated death registration coverage of the countries in our dataset. Despite the estimates, the actual coverage might be lower due to the burden of the pandemic. For analysis of this under-reporting see the recent paper by Whittaker et al (2021) Under-reporting of deaths limits our understanding of true burden of covid-19.
For instance, a 2016 CDC study of the delay in the US found that after four weeks, only 54% of deaths had been registered; by eight weeks the figure was 75%, and it didn't reach 100% until almost a year after the date of death. Though the CDC does note that “Data timeliness has improved in recent years, and current timeliness is likely higher than published rates.” In fact, the CDC estimated that “63% of all U.S. deaths are reported within 10 days of the date of death, but there is significant variation between states.”
Clearly incomplete data is marked by a large, abrupt drop in the death count — often well below the five-year average — and a pattern of substantial upward revision to the count from recent periods.
In 2020, for instance, there were an estimated ~2500 such deaths; see here for details.
Before 27 September 2021, we did not include these deaths in Sweden's data series because our source at the time, the Human Mortality Database, did not include them.
As of 27 September 2021, however, we do include these deaths with unknown dates — we switched sources for Sweden to the World Mortality Dataset (WMD), which does include these deaths. See here for how WMD does this: https://github.com/akarlinsky/world_mortality#sweden-weekly.
For instance, England & Wales define the week as from Saturday to Friday.
This enables easy comparisons of weekly deaths across the years in the chart, but it means we show a date that is slightly incorrect (plus or minus a few days) for the other years. This is because the same numbered week falls on slightly different dates in different years; for example, Week 1 2020 ended on 5 January 2020, while Week 1 2021 ended on 10 January 2021. For more details see this resource with ISO 8601 week dates across the years.
The reason for this is that the monthly data smooths the weekly fluctuations, resulting in lower estimates. Source: D. Jdanov, Human Mortality Database, personal communication, 11 February 2021.
These baselines are produced according to the same method described in Karlinsky and Kobak 2021.
To read The Economist's article presenting the model estimates, see: https://www.economist.com/graphic-detail/coronavirus-excess-deaths-estimates
To read about the model methodology, see: https://www.economist.com/graphic-detail/2021/05/13/how-we-estimated-the-true-death-toll-of-the-pandemic
Similar results were reported in March 2022 by researchers from the Institute for Health Metrics and Evaluation, publishing in the journal The Lancet.
They found that "Although reported COVID-19 deaths between Jan 1, 2020, and Dec 31, 2021, totaled 5.94 million worldwide, we estimate that 18.2 million (95% uncertainty interval 17.1–19.6) people died worldwide because of the COVID-19 pandemic (as measured by excess mortality) over that period."
The full citation is –
Wang, H., et al. (2022). Estimating excess mortality due to the COVID-19 pandemic: a systematic analysis of COVID-19-related mortality, 2020–21. The Lancet.
HMD only includes countries with the highest quality and most comprehensive mortality statistics, with breakdowns by age and sex and many years of historical data. Because of this, only select countries with very robust and capable statistical agencies are included.
Németh L., Jdanov D.A., Shkolnikov V.M. (2021) An open-sourced, web-based application to analyze weekly excess mortality based on the Short-term Mortality Fluctuations data series. PLoS ONE 16(2): e0246663. https://doi.org/10.1371/journal.pone.0246663
However, the WMD does provide the projected baselines that we show for calculating P-scores in the by-age chart.
Before 18 January 2022, WMD published a projection for 2020 only to avoid further extrapolation from the historical data. As of 18 January, they do publish—and we use—separate projections for 2020, 2021, and 2022.
We present the reported deaths data sourced directly from HMD, not WMD.
Karlinsky, A. and Kobak, D. (2021). Tracking excess mortality across countries during the COVID-19 pandemic with the World Mortality Dataset. eLife, DOI: 10.7554/eLife.69336.
A working paper with data from England estimates that for every 30 COVID deaths there is at least one avoidable non-COVID excess death in hospitals. See Fetzer and Rauh (2022) Pandemic Pressures and Public Health Care: Evidence from England.
Cite this work
Our articles and data visualizations rely on work from many different people and organizations. When citing this article, please also cite the underlying data sources. This article can be cited as:
Edouard Mathieu, Hannah Ritchie, Lucas Rodés-Guirao, Cameron Appel, Daniel Gavrilov, Charlie Giattino, Joe Hasell, Bobbie Macdonald, Saloni Dattani, Diana Beltekian, Esteban Ortiz-Ospina, and Max Roser (2020) - “Excess mortality during the Coronavirus pandemic (COVID-19)” Published online at OurWorldinData.org. Retrieved from: 'https://archive.ourworldindata.org/20260731-064548/excess-mortality-covid.html' [Online Resource] (archived on July 31, 2026).BibTeX citation
@article{owid-excess-mortality-covid,
    author = {Edouard Mathieu and Hannah Ritchie and Lucas Rodés-Guirao and Cameron Appel and Daniel Gavrilov and Charlie Giattino and Joe Hasell and Bobbie Macdonald and Saloni Dattani and Diana Beltekian and Esteban Ortiz-Ospina and Max Roser},
    title = {Excess mortality during the Coronavirus pandemic (COVID-19)},
    journal = {Our World in Data},
    year = {2020},
    note = {https://archive.ourworldindata.org/20260731-064548/excess-mortality-covid.html}
}
Reuse this work freely
All visualizations, data, and articles produced by Our World in Data are completely open access under the Creative Commons BY license. You have the permission to use, distribute, and reproduce these in any medium, provided the source and authors are credited.
The data produced by third parties and made available by Our World in Data is subject to the license terms from the original third-party authors. We will always indicate the original source of the data in our documentation, so you should always check the license of any such third-party data before use and redistribution.
All of our charts can be embedded in any site.