Build on top of our work freely
- All our code is open-source
- All our research and visualizations are free for everyone to use for all purposes
No country knows the total number of people infected with COVID-19. All we know is the infection status of those who have been tested. All those who have a lab-confirmed infection are counted as confirmed cases.
This means that the counts of confirmed cases depend on how much a country actually tests. Without testing there is no data.
Testing is our window onto the pandemic and how it is spreading. Without data on who is infected by the virus we have no way of understanding the pandemic. Without this data we can not know which countries are doing well, and which are just underreporting cases and deaths.
To interpret any data on confirmed cases we need to know how much testing for COVID-19 the country actually does.
Because testing is so very crucial to understanding the spread of the pandemic and responding appropriately we have focused our efforts on building a global dataset on COVID-19 testing.
- The testing dataset is updated around twice a week. The latest version is always available in the section below.
- And as with all our work, it is freely accessible for everyone. The data can be downloaded here on GitHub.
How many tests are performed each day?
Related charts:
This chart shows the number of daily tests per thousand people. Because the number of tests is often volatile from day to day, we show the figures as a three-day rolling average.
What is counted as a test?
The number of tests does not refer to the same in each country – one difference is that some countries report the number of people tested, while others report the number of tests (which can be higher if the same person is tested more than once). And other countries report their testing data in a way that leaves it unclear what the test count refers to exactly.
We indicate the differences in the chart and explain them in detail in our accompanying source descriptions.
How many total tests have been performed?
Related charts:
This chart shows the total number of tests per thousand people.
In all our charts you can download the data
We want everyone to built on top of our work and therefore we always make all our data always available for download. Click on the ‘Data’-tab below the chart and you can download the shown data for all countries in a simple to use csv file.
How to interact with this chart
As before you can add and compare any selection of countries using the Add country button. You can also change the time period shown by adjusting the blue time slider.
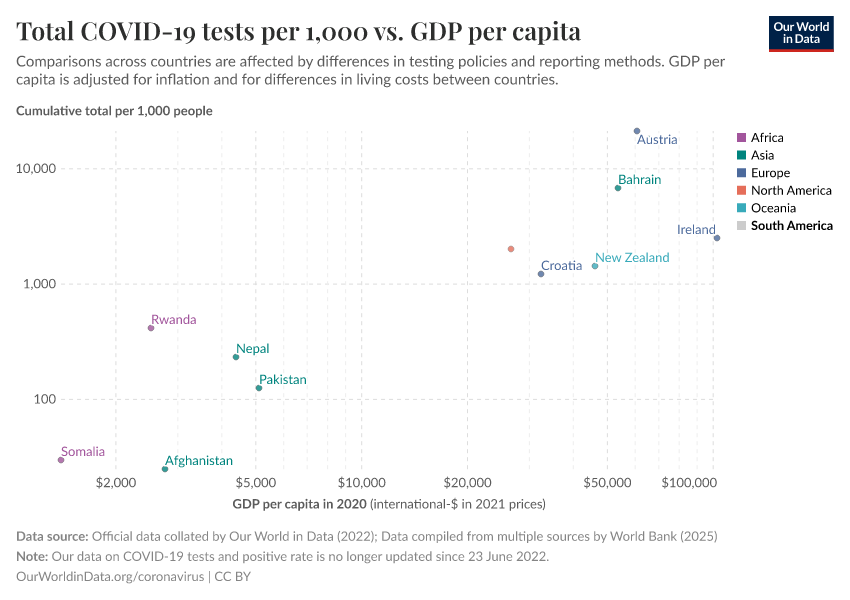
World map: total tests performed relative to the size of population
Related charts:
This map shows you how the total number of tests per thousand people compares across all countries in our dataset.
How to interact with this chart
- By moving the time slider (below the map) you can see how testing coverage has changed over time.
- You can focus on a particular world region using the dropdown menu to the top-right of the map.
- Hovering over a country lets you see the exact number.
Tests per case: how many tests to find one COVID-19 case?
Related charts:
This chart brings our data on testing together with the data on confirmed cases.
The chart answers the question: How many tests did a country do to find one COVID-19 case?
• Some countries – for example Taiwan and Vietnam – did a large number of tests per each confirmed case.
• For others the ratio is more than two orders of magnitude lower. These countries found a case for every few tests they did.
→ We discuss what this chart can – and can not – tell us about the data from a particular country in: What can data on testing tell us about the pandemic?
How to interact with this chart
As before you can add and compare any selection of countries using the Add country button.
No country knows the true number of people infected with COVID-19. All we know is the infection status of those who have been tested.
The total number of people that have tested positive – the number of confirmed cases – is not the total number of people who have been infected. The true number of people infected with COVID-19 is much higher.
Whilst there is no way to infer the true number of infections from testing data, it can help give us a strong indication of the quality of a country’s data on the pandemic and an idea of how informative the number of confirmed cases in a country may be.
Testing coverage
The chart here shows a measure of testing coverage – tests per thousand people.
Countries are reporting testing data in different ways: some report the number of tests, others report the number of people tested. This distinction is important – people may be tested many times, and the number of tests a person has is likely to vary across countries.1
Across different countries, we see an enormous range in testing coverage. In Iceland there have been more than 100 tests per thousand people – far more than in any other country. In Indonesia, testing coverage is very low – only 0.1 tests per thousand people.2
Generally, we would expect that more testing means more reliable data on confirmed cases, for two reasons.
Firstly, a greater degree of testing provides us with a larger ‘sample’ of people for which their infection status is known. If everybody was tested, we would know the true number of people who are infected.
Secondly, it may be the case that countries with a high capacity for testing do not need to ration tests as much. Where the capacity for testing is low, tests may be reserved (or ‘rationed’) for particularly high-risk groups. Such rationing is one of the reasons that tested people are not representative of the wider population.
As such, where testing coverage is higher, the ‘sample’ of tested people may provide a less biased idea of the true prevalence of the virus.3
Download the data: we make our full testing dataset, alongside detailed source descriptions, available on Github.
The number of tests per confirmed case
A further complication with using testing coverage as an indicator of reliability, is that the number of tests needed to have an accurate picture of the spread of the virus varies over the course of an outbreak.
At the beginning of an outbreak, where the number of people infected with the virus is low, a much smaller number of tests are needed to accurately assess the spread of the virus.
As the virus infects more people, testing coverage also needs to expand in order to provide a reliable picture of the true number of infected people.
For this reason it is helpful to look at the number of tests performed for each confirmed case. This gives us an indication of the scale of testing that accounts for the different stages each country may be in its outbreak.
The bar chart shows the number of tests, or people tested per confirmed case. The data can also be viewed over time in this chart.
The key insight from this metric is that there are very large differences between countries.
In some countries the number of tests are many times higher than the number of confirmed cases. As of 11 April, in Vietnam more than 400 tests had been conducted for each confirmed case. In Taiwan and Russia there had been around a hundred tests for each confirmed case.
But in other countries testing is very low relative to the number of confirmed cases. The US, the UK and Ecuador had performed around 5 tests or fewer for every confirmed case.
Download the data: we make our full testing dataset, alongside detailed source descriptions, available on Github.
What can we learn from these measures about the pandemic?
Both testing coverage and the number of tests per confirmed case help us understand what we can know about the true spread of the virus from data on confirmed cases.
But it is the number of tests per confirmed case that is arguably the most helpful in this regard, because this accounts for the fact that a smaller outbreak requires less testing.
Consider for instance the difference between three countries: the UK, Australia and Taiwan.
These countries are highlighted in the chart here, which shows the number of tests per million against the number of confirmed cases per million. The dotted comparison lines show the points on the chart where the number of tests are a fixed number of times larger than the number of confirmed cases – 2, 5, 10, 20, 50, 100, 200 and 500 times larger.
In terms of testing coverage the UK appears to be ahead of Taiwan, with at least twice the number of people tested per thousand, as of 11 April.4
But on the same date, there were 60 times more confirmed cases per million in the UK than in Taiwan – 1,035 per million and 16 cases per million respectively.
So whilst testing relative to population size is higher in the UK, testing relative to the size of the outbreak is much, much higher in Taiwan.
As of 11 April, in Taiwan one case was confirmed for every 120 tests. In the UK, a case was confirmed in fewer than every four tests.5
In Australia, testing coverage is much higher than in Taiwan. But in terms of the number of tests per confirmed case, the countries are much closer – one case was confirmed for every 55 tests in Australia as of 11 April. A number of issues with the data on testing – discussed here – mean that small differences between countries should not be overinterpreted.
But the very large differences – such as those seen between Taiwan, Australia and the UK – do tell us something important about the quality of the data.
A country that performs very few tests for each case it confirms is not testing widely enough for the number of confirmed cases to paint a reliable picture of the true spread of the virus. Whilst those people with the most severe symptoms may have been tested in such countries, there are likely to be many times more people with mild or no symptoms that were never tested.
Testing in the UK has not kept pace with the advancing outbreak. The number of people tested per confirmed case fell rapidly throughout March and early April – from more than 400, to less than 4. The current low level of testing, relative to the size of the outbreak, suggests that the true number of infections in the UK is likely to be far higher than the number of confirmed cases.
The large number of tests for each confirmed case in Taiwan and Australia suggests that the number of confirmed cases paint a much more reliable picture of the true number of infections in these countries.
Researchers from the London School of Hygiene and Tropical Medicine – Timothy Russel, Joel Hellewell, Sam Abbott and others – reach similar conclusions about the UK and Australia via a different method.6 They estimate the degree to which countries’ confirmed cases may underestimate total symptomatic cases by applying the case fatality rate (we explain this metric in detail here) observed in large studies in China and South Korea to data on the number of COVID-19 deaths in countries around the world.
They estimate that in Australia the number of confirmed cases reflect more than three quarters of the total number of symptomatic cases in the country. For the UK, they estimate that confirmed cases represent less than one in twenty symptomatic cases.7
As such, the gap between the UK and Australia in terms of the true number of infections is likely to be far higher than that indicated by their confirmed cases.
The intuition behind these researchers’ estimates is that where the number of confirmed cases looks low against the number of deaths, this is a clear indication that the true number of cases is likely to be much, much higher. But the fundamental reason for this is the limited extent of testing.
The rate of tests per case thus gives us another useful way of approaching the same question, by looking at the extent of testing relative to the number of cases directly.
The importance of testing
Testing is our window onto the pandemic and how it is spreading. Without testing we have no way of understanding the pandemic.
It is one of our most important tools in the fight to slow and reduce the spread and impact of the virus. Tests allow us to identify infected individuals, guiding the medical treatment that they receive. It enables the isolation of those infected and the tracing and quarantining of their contacts.8 And it can help allocate medical resources and staff more efficiently.9
In addition, testing for COVID-19 also informs our understanding of the pandemic and the risks it poses in different populations.
This knowledge is important if we are to properly assess the interventions that should be implemented, including very costly interventions such as social distancing and the shutdown of entire regions and industries.
Why data on testing is needed
Without data on COVID-19 we cannot possibly understand how the pandemic is progressing.
Without data we cannot respond appropriately to the threat; neither as individuals nor as a society. Nor can we learn where countermeasures against the pandemic are working.
The number of confirmed cases is what informs us about the development of the pandemic.
But the confirmation of a case is based on a test. The World Health Organization defines a confirmed case as “a person with laboratory confirmation of COVID-19 infection”.10
Reliable data on testing is therefore necessary to assess the reliability of the data that informs us about the spread of the pandemic: the data on cases and deaths.
Different types of tests for COVID-19
There are many different technologies for COVID-19 testing, some currently available and some still in development. Trackers of the development, regulatory status and commercial release of different types of COVID-19 test are being compiled by Johns Hopkins University and the medical industry news website, 360Dx.
Broadly, we can divide these different tests into two kinds:
- those that test for the presence of the virus, aiming to establish whether an individual is currently infected. The most common way of performing a test of the first type is with a ‘PCR’ test.11
- those that test for the presence of antibodies, aiming to establish whether an individual has been infected at some point in the past.
Currently, we aim to include only these PCR tests in our testing dataset.
We do this for the following reasons:
- Our focus is on using testing data to help properly interpret the data we have on confirmed cases and deaths. Case confirmation is generally based on a positive result from a PCR test, in line with WHO recommendations.12 So including antibody tests in our figures would mean they were less useful for this purpose.
- Other kinds of test beyond PCR are not yet being widely used. This also means that data on how many of these tests have been conducted is very limited. Including such data in our counts when it is available would reduce the comparability of our data across countries.
- There are technical differences in how results from these different tests should be interpreted. Current data suggests that other existing testing technologies are subject to very different rates of false positive and false negative results than PCR tests.13 This is another reason why aggregating the data across these different types of test is not the best way of using testing data to help us understand the epidemic.
Our checklist for COVID-19 testing data
Different countries publish their testing data according different definitions. In order to make meaningful comparisons between countries and over time, the figures need to be interpreted alongside an understanding of these differences.
This means that, in addition to the numbers, detailed descriptions are needed to make clear what the numbers precisely mean. For each country in our dataset, we provide source descriptions detailing all the information that we have been able to find. However, many countries currently do not provide sufficient documentation.
For citizens to trust and understand the published data, and for countries to learn from each other, it is crucial that every country provides the data on testing in a clearly documented way.
To help guide users and producers of testing data, we provide the following checklist of questions. Clear answers to these questions are what is needed to properly interpret and compare published numbers.
1) Is there no data – or it is just hard to find?
Many countries are not yet providing official figures. Others do not do so on a regular basis. The first question to ask, then, is if there is any testing data for a given country.
Equally important is to make the available data findable. Currently, the available data is often not easy to find, because some countries are releasing figures at unpredictable intervals in ad-hoc locations (including social media or press conferences).
2) What testing technologies are being used?
There are many different technologies for COVID-19 testing, some of which are already implemented, some currently available but not yet rolled out, and some still in development. As we discuss here, these different tests are used with different objectives in mind, and there are technical differences in how results from these different testing technologies should be interpreted.
It’s critical that governments provide a detailed and explicit account of the technologies that are being implemented as they get rolled out, disaggregating the test results accordingly. For citizens to trust and understand the published data, and for epidemiologists to incorporate the data into the models that inform public policy, it is crucial that every country provides the data on testing in a clearly documented way.
3) Do numbers refer to ‘performed tests’ or ‘individuals tested’?
The number of tests performed is different to the number of individuals tested. The reason for this is that it is common for COVID-19 testing that the same person is tested more than once.
Some countries report tests performed, while others report the number of individuals tested.
The source description should state clearly what is counted.
4) Are negative results included? Are pending results included?
It needs to be clear whether or not figures for the total number of tests performed, or the number of people tested, include negative test results, as well as the number of tests that are pending results.
Many sources report the number of individuals who are ‘suspected’ or have been ‘ruled out’. To be reliably included in test counts, it needs to be explicit whether such categories reflect the number of people who are awaiting test results or have tested negatively.
5) Do the figures include all tests conducted in the country, or only some?
Figures reported by countries may only be partial if not all laboratories are reporting to the central authority.
The scope of testing data should be made explicit by the source. For instance, the US CDC make it clear that their figures do not include tests conducted in private labs.
6) Are all regions and laboratories within a country submitting data on the same basis?
Answers to the questions above may vary from region to region. In order to assess the reliability of aggregate testing data, it needs to be clear if heterogenous data is being summed together.
The US COVID Tracking Project, for instance makes it clear that their US totals combine data for tests performed and individuals tested, depending on which is reported by individual states.
7) What period do the published figures refer to?
Cumulative counts of the total number of tests should make clear the date from which the count begins. The key question that needs to be answered is whether the figures published at some date (attempt to) include all tests conducted up to that date.
Because the reporting of tests can take several days, for some countries figures for the last few days may not yet be complete. It needs to be made clear by the source if this may be the case. The US CDC, for instance, makes this clear.
8) Are there any issues that affect the comparability of the data over time?
If we want to look at how testing figures are changing over time, we need to know how any of the factors discussed above may have changed too.
The Netherlands, for instance, makes it clear that not all labs were included in national estimates from the start. As new labs get included, their past cumulative total gets added to the day they begin reporting, creating spikes in the time series.
9) What are the typical testing practices in the country?
Having a sense of how often and when individuals are tested, can help the users of these statistics understand how estimates of tests performed and individuals tested might relate to each other.
For instance, how many tests does a case investigation require? What are the eligibility criteria to be tested? Are health workers, or other specific groups, being routinely retested?
10) Might any of the information above be lost in translation?
People accessing data published in a language in which they are not fluent may misinterpret the data by mistranslating the provided text, which often includes technical terms.
Many countries report testing data in multiple languages – this helps disseminate the information to a broader audience, whilst helping prevent misinterpretations.
Download the data
We make our full testing dataset, alongside detailed source descriptions, available on Github here.
Last update: 6 May 2020 20:00, London time.
(Our testing dataset is updated around twice a week.)
About the dataset
Our goal at Our World in Data is to provide testing data over time for many countries around the world.
Do do this, we collect publicly available information published by official sources on a regular basis. Our dataset is updated around twice a week.
Alongside the data, we also aim to provide a good understanding of the definitions used and any important limitations they might have. Our checklist of questions about testing data is what guides our efforts.
We present this information in source descriptions for each country included in the dataset. But in many cases sources do not yet provide the detailed descriptions of the data we would like.
Which countries do we have testing data for?
In this map countries for which testing data can be found in our dataset are shown in blue.
As you can see, we do not have data for all countries in our dataset. Those countries where we have looked, but have not been able to find any official sources of testing data are shown in red. Countries which we are either in the process of adding to our dataset, or for which we have not yet been able to look for data are shown in grey.
Countries publish their testing data at different frequencies: some provide daily updates, others only weekly, and some only publish figures on an ad-hoc basis at longer intervals.
Because of this, the most recent data we have for different countries refers to different dates. This chart shows you how up to date the latest data is for each country in our dataset.
Source information country-by-country
Below is the list of the 84 countries for which we have data. We will be adding to this list in the coming days.
At the very bottom of this post, you can also find the list of countries for which we have attempted to collect data but could not find official sources.
You can download the full dataset alongside the detailed source descriptions on GitHub.
Or else click to jump to the detailed source description and the latest data for that country:
Argentina
Australia
Austria
Bahrain
Bangladesh
Belarus
Belgium
Bolivia
Brazil
Bulgaria
Canada
Chile
Colombia
Costa Rica
Croatia
Cuba
Czech Republic
Denmark
Ecuador
El Salvador
Estonia
Ethiopia
Finland
France
Germany
Ghana
Greece
Hong Kong
Hungary
Iceland
India
Indonesia
Iran
Ireland
Israel
Italy
Japan
Kazakhstan
Kenya
Latvia
Lithuania
Luxembourg
Malaysia
Mexico
Morocco
Myanmar
Nepal
Netherlands
New Zealand
Nigeria
Norway
Pakistan
Panama
Paraguay
Peru
Philippines
Poland
Portugal
Qatar
Romania
Russia
Rwanda
Saudi Arabia
Senegal
Serbia
Singapore
Slovakia
Slovenia
South Africa
South Korea
Spain
Sweden
Switzerland
Taiwan
Thailand
Tunisia
Turkey
Uganda
Ukraine
United Kingdom
United States
Uruguay
Vietnam
Zimbabwe
Source: Government of Argentina
Short description: The number of tests performed.
Latest estimate: 1.3 per thousand people; 58,685 in total (as of 01 May 2020).
Detailed description:
Two reports are published daily by the government of Argentina. Since 8th April the morning report gives the cumulative total of “tests carried out” in the country. No information is given on the geographical scope and number of labs included.
Source: Australian Government Department of Health
Short description: The number of tests performed.
Latest estimate: 27.01 per thousand people; 688,656 in total (as of 06 May 2020).
Detailed description:
We construct a time series of the cumulative number of tests performed to date using data provided by the Australian Government Department of Health through daily health alerts and weekly epidemiological reports.
The weekly epidemiological reports make it clear that the figures relate to diagnostic testing. It is unclear whether the reported figures include pending test results. It is also unclear when the first test was conducted, since we have not been able to find official data prior to March 22nd 2020 (at which point 143,056 tests had been performed).
The daily health alerts have provided testing figures since April 5th 2020, whereas the weekly epidemiological reports have provided testing figures since March 22nd 2020. In the daily health alerts, testing figures are reported within the “Coronavirus (COVID-19) at a glance” infographic. The entire collection of these infographics dating back to April 5th 2020 can be viewed here.
Source: Austria Health Ministry
Short description: The number of tests performed
Latest estimate: 32.45 per thousand people; 292,254 in total (as of 06 May 2020).
Detailed description:
The Ministry for Health publishes daily updates of the COVID-19 situation here.html), which include data on the cumulative number of tests performed to date. We construct a daily time series using Web Archive snapshots.html) of these updates.
It is unclear whether the reported figures include pending test results.
A footnote explains that “The number ‘testing’ is the total number of all Covid tests carried out. The data for this are largely reported by the performing laboratories.”
The same figures are also provided by the Ministry for Health in this official dashboard.
Source: Bahrain Ministry of Health
Short description: The source reports the ‘number of assessments’ conducted. It is unclear whether this refers to the total number of tests conducted, or the number of people tested.
Latest estimate: 94.23 per thousand people; 160,341 in total (as of 06 May 2020).
Detailed description:
The Bahrainian Ministry of Health publishes frequent updates (not daily, but with high frequency) on the number of confirmed cases, status of existing cases and number of assessments conducted.
These figures represent the cumulative tests to that given date. It is not clear whether this refers to the total number of tests conducted, or the number of people tested.
These updates are not provided daily – typically every few days, so a daily time-series is not available. However, using web archives we can construct a time-series of tests conducted over time based on these frequent updates. It is not clear when testing first began; data is only available from 5th March where it was reported that 5334 tests had been conducted.
Source: Government of Bangladesh
Short description: The number of samples tested.
Latest estimate: 0.6 per thousand people; 99,644 in total (as of 06 May 2020).
Detailed description:
The Government of Bangladesh provides data on the total number of samples tested (“মোট পরিক্ষাকৃত নমুনার সংখ্যা”) to date in this official dashboard. The full time series of samples tested can be downloaded in the detailed dashboard, which dates back to March 4th 2020.
It is not clear whether the reported figures include samples in which the test results are pending.
Source: Belarus Ministry of Health
Short description: The number of tests performed.
Latest estimate: 22.37 per thousand people; 211,369 in total (as of 04 May 2020).
Detailed description:
The Belarus Ministry of Health provides daily press releases that report the cumulative number of tests conducted to date. It is unclear whether the reported figures include pending tests.
Prior to April 14th 2020, the Ministry reported imprecise testing figures (e.g. “…more than 64 thousand tests…”). We include these imprecise figures so that our time series extends back to March 3rd 2020.
The earliest reported figure that we have been able to find is from March 3rd 2020, at which point approximately 5,000 cumulative tests were reported. The number of tests are cumulative since late January 2020, but the press releases do not specify the exact date on which the first test was conducted.
Source: Sciensano (Belgian institute for health)
Short description: The data is described both as the number of tests performed and as the number of tested patients.
Latest estimate: 33.76 per thousand people; 391,314 in total (as of 04 May 2020).
Detailed description:
There is some ambiguity as to the units. The testing data are labelled as ‘the number of tests performed’. But in the codebook provided alongside the data the testing series is described as ‘the number of tested patients’. The date of is the date of laboratory diagnosis, or when not available, the date of sampling is used.
Source: Ministry of Health
Short description: The number of cases tested.
Latest estimate: 0.68 per thousand people; 7,888 in total (as of 05 May 2020).
Detailed description:
Official testing data from the Bolivian Ministry of Health is reported in this dashboard, which provides a breakdown of the cumulative number of confirmed, suspected, and discarded cases to date along with the number of deaths and recoveries. We assume that the number of discarded cases (“casos descartados”) refers to the number of cases with negative test results. Under this assumption, we measure the total number of cases tested to date as the sum of the number of confirmed and discarded cases.
Unfortunately, the official dashboard does not provide a time series of the number of cases tested each day since testing began. Instead, the dashboard only displays a daily snapshot of the total cases tested to date. Since we did not begin monitoring this dashboard until April 15th 2020, we construct a time series dating back to March 21st 2020 using data provided in this unofficial Github repository, which we have cross-referenced against data in the official dashboard for a sample of dates.
Source: Brazil Ministry of Health
Short description: The number of tests performed.
Latest estimate: 0.62 per thousand people; 132,467 in total (as of 20 April 2020).
Detailed description:
The Ministry of Health press releases published on its website intermittently include figures for the number of tests carried out for a range of respiratory infections, further specifying the figures carried out for the ‘specific investigation of COVID-19’. The releases note that ‘Tests for coronavirus began to be carried out from February 16 in public and private laboratories’.
Source: Bulgaria COVID-19 Information Portal
Short description: The number of tests performed.
Latest estimate: 7.45 per thousand people; 51,768 in total (as of 06 May 2020).
Detailed description:
Bulgaria’s official COVID-19 information portal provides irregular updates of the cumulative number of ‘tests done’.
Using web archives we reconstruct the testing time series starting from 11th April. We cannot say with certainty when testing began, only that the earliest observation available to us begins from the 11th April. For 19th April, we take the figure provided in Bulgaria’s COVID-19 dashboard as no snapshot was available using web archives. The test figures provided in the dashboard match the figures provided by the information portal for all other dates available.
Google Translate was used while compiling this data so this may affect our interpretation of the data.
Source: Government of Canada
Short description: The number of people tested.
Latest estimate: 24.97 per thousand people; 942,526 in total (as of 06 May 2020).
Detailed description:
The Government of Canada provides daily updates of the COVID-19 outbreak here, which report the cumulative number of people tested to date.
We construct a daily time series of the cumulative number of people tested to date using Web Archive snapshots of these daily updates. The figures include positive and negative test results, while excluding pending test results.
The figures relate to diagnostic testing completed in laboratories.
We only report data since March 18th 2020 due to a large jump in the time series that occurred between March 17th (1,018 people tested) and March 18th (53,975 people tested). We suspect this jump was the result of a backlog in tests waiting to be processed, but the Government of Canada website does not provide an explanation. For comparability over time, we therefore exclude data prior to March 18th 2020.
Source: Government of Chile Coronavirus information page
Short description: The number of tests performed
Latest estimate: 12.14 per thousand people; 232,108 in total (as of 06 May 2020).
Detailed description:
The Government of Chile release daily reports that include cumulative and daily totals for the number of PCR tests performed across private and public medical establishments. This data is collected by volunteers and published on Github. We take our figures from this GitHub, which we regularly audit for accuracy.
Source: National Institute of Health
Short description: The number of samples processed.
Latest estimate: 2.5 per thousand people; 127,105 in total (as of 05 May 2020).
Detailed description:
The Colombian National Institute of Health publishes a dashboard on COVID-19, updated daily. Page 4 of the embedded report includes a graph on “histórico de muestras” (sample history), with a cumulative number of “muestras procesadas” (samples processed).
The report says that “the daily sample chart is based on information loaded by all laboratories that perform SARS-CoV2 diagnostics. At this time, some laboratories are completing the dates for conducting the tests, so the graph will vary as these data are completed.”
Because of this, our time series does not include samples marked as “S.F.” (“Sin Fecha”) in the leftmost bar of the graph; these can represent a high number of samples (3867 as of 21 April 2020).
Source: Costa Rican Ministry of Health
Short description: The number of people tested.
Latest estimate: 1.94 per thousand people; 9,892 in total (as of 05 May 2020).
Detailed description:
The Costa Rican Ministry of Health produce daily update reports of confirmed cases, deaths and test results.
These daily reports state the daily number of people who have been tested – given as the number of confirmed cases (‘Confirma contagio’) and number of people with negative results (‘Descarta contagio’) (thus the figures do not include pending tests). We can use these daily updates to construct a full time-series. This has been made downloadable.
Daily reports with figures on testing are only available dating back to 11th March. We therefore do not know the first date of testing, or daily figures prior to this date.
Source: Government of Croatia
Short description: Testing figures were reported as “samples tested” prior to 24 March 2020, then as “tests performed”, then as “people tested” from 6 May 2020.
Latest estimate: 10 per thousand people; 41,053 in total (as of 06 May 2020).
Detailed description:
The Government of Croatia provides daily updates of confirmed cases, deaths, and testing figures here. It is unclear whether the reported figures include tests for which the results are pending.
Data may not be fully comparable over time. Prior to March 24th, testing figures were reported in terms of “samples tested” (e.g. “Ukupno je 317 testiranih uzoraka…”). From March 24th to May 6th, testing figures were reported in terms of “tests performed” (e.g. “Dosad je obavljeno ukupno 3.159 testiranja”). Since May 6th they have been reported in terms of “people tested” (e.g. “Dosad je testirano ukupno 41.053 osoba”) It is unclear whether this change in wording reflects an actual change in which figures are reported.
We have found testing data dating back to March 3rd 2020, at which point 247 samples had been tested to date. It is not clear when the first sample was tested.
Source: Ministry of Public Health
Short description: Units are unclear, and could refer to the number of tests performed, or people tested.
Latest estimate: 5.27 per thousand people; 59,648 in total (as of 05 May 2020).
Detailed description:
The Ministry of Public Health publishes data on its website, which is collected and republished by the COVID-19 Cuba Data project in a dashboard and on GitHub. It includes a time series for the number of tests.
However the context in which the figures are published suggests that these numbers may actually refer to the number of individuals tested. A breakdown into positive and negative results is given, along with a positive test rate. It is also unclear whether the reported figures include tests for which the results are pending.
Source: Ministry of Health
Short description: The number of tests performed.
Latest estimate: 26.01 per thousand people; 278,519 in total (as of 05 May 2020).
Detailed description:
The Ministry of Health publishes a data set containing incremental and cumulative daily numbers of COVID-19 tests performed according to laboratory reports. It is updated daily and accessible in CSV and JSON format. No other information about the figures could be found.
Source: Danish Health Authority
Short description: The number of people tested.
Latest estimate: 46.73 per thousand people; 270,680 in total (as of 06 May 2020).
Detailed description:
The Danish Statum Serum Institute provides epidemiological update reports on confirmed cases, deaths, testing and demographic details of each.
It provides daily statistics on the number of people tested for COVID-19, and the number and share of people that tested positive.
The most recent epidemiological status reports provides the daily data for the previous two weeks with a cumulative figure from 13 Jan given prior to that. We construct a longer time series by referring to earlier versions of this table, accessed via web archive.
The daily data for earlier dates can also be seen in a chart that the Institute show in their monitoring reports page.
Source: Government of Ecuador
Short description: The number of cases tested.
Latest estimate: 3.75 per thousand people; 66,160 in total (as of 04 May 2020).
Detailed description:
The Government of Ecuador publish daily updates in the form of situation reports and summary infographics. These report the number and status of confirmed cases, deaths and number of samples tested. This data is available daily from 18th March; reports and infographics prior to this date do not include the number of samples tested. But all figures are dated cumulative since 29th February.
The source reports the number of confirmed (‘confirmados’) and negative (‘descartados’) cases, which we sum to get the number of cases tested.
On 24 April 2020, the number of tests suddenly jumped from 23,383 to 45,857, because of what we assume to be the inclusion of rapid tests (“pruebas rápidas”), as made clear by the subsequent infographic published on 27 April. We therefore do not include the 24 April infographic in our time series; and from 27 April onwards, we include only PCR tests.
Source: Government of El Salvador
Short description: The number of tests performed.
Latest estimate: 5.18 per thousand people; 33,628 in total (as of 05 May 2020).
Detailed description:
The government of El Salvador publishes an online dashboard with figures and graphs about the epidemic, including the number of tests performed (“pruebas COVID19 realizadas hasta hoy”). No information is given on the geographical scope and number of labs included.
Source: Social Ministry
Short description: The number of tests performed (“Testide koguarv”)
Latest estimate: 44.44 per thousand people; 58,955 in total (as of 05 May 2020).
Detailed description:
The Social Ministry embeds the Koroonakaart dashboard maintained by Open Data Estonia. The Ministry notes that past data may be revised. No other descriptions can be found.
A complete time-series from 25th February is available, and is updated daily.
Source: Ethiopian Public Health Institute
Short description: The number of tests performed.
Latest estimate: 0.23 per thousand people; 26,517 in total (as of 06 May 2020).
Detailed description:
The Ethiopian Public Health Institute in collaboration with the Ethiopian Ministry of Health provides daily press releases of the number of tests performed to date. It is not clear whether these figures refer to the number of samples tested or the number of people tested. It is also unclear whether the reported figures include tests for which the results are pending.
The earliest record we have found is for March 17th 2020, at which point 79 tests had been performed to date. It is unclear when the first test was performed.
Source: Finnish Department of Health and Welfare COVID-19 data dashboard
Short description: The number of samples tested.
Latest estimate: 19.51 per thousand people; 108,112 in total (as of 05 May 2020).
Detailed description:
The Finnish Department of Health and Welfare publishes a dashboard of confirmed cases, deaths and samples tested.
The dashboard provides daily figures and cumulative test numbers on a separate tab. We have copied this time-series as presented in the original source. It’s important to note that when figures exceed 1000, the Finnish Department of Health and Welfare report samples to the nearest hundred (e.g. 1.6k).
Further descriptions of the testing data are provided here. In this document it notes that:
– “Public and private sector laboratories report to THL (health authority) the number of samples tested per hospital district”
– “The actual number of infections in Finland is probably higher than reported, as not all mild symptoms have been tested so far and no information is available on the number of asymptomatic infections.”
– “Coronavirus testing is performed in both the public and private sectors in several laboratories.”
The data description notes that tests are being rationed and allocated according to the following strategy: “Samples are taken primarily from patients with severe symptoms of respiratory infection and from health and social care staff to ensure staff health and labor adequacy….Attention has also been paid to vulnerable groups of patients with some underlying disease and to those over 70 years of age.”
This data series extends to the 27th February, when test figures were very low (9 tests per day). It is likely this is was the first day, or close to the first day of testing.
Source: Agence nationale de santé publique
Short description: The number of tests performed.
Latest estimate: 11.1 per thousand people; 724,574 in total (as of 28 April 2020).
Detailed description:
The source publishes epidemiological updates at irregular intervals. The latest update, as of 24th April, was published on the 23rd April. The updates include a figure for the number of tests performed (‘Nombre de tests réalisés’). A breakdown into positive and negative results are given, along with a positive test rate.
The figures in the time series relate to tests performed since 24 February. Since the 24 March update, in addition to the previously reported hospital tests, laboratory tests are also reported. Only the total number of laboratory tests performed between 24 February and 24 March is presented, without a time series. Our figure for 24 March adds the cumulative number of laboratory tests since 24 February (6,500) to the hospital tests figure (101,046). As such 24 March represents a break in the series.
Source: Robert Koch Institut
Short description: The number of tests performed. Note that the number of laboratories reporting in the data seems to vary from week to week.
Latest estimate: 32.89 per thousand people; 2,755,770 in total (as of 03 May 2020).
Detailed description:
To determine how many laboratory tests regarding SARS-CoV-2 are carried out per calendar week in Germany and how many tests are positive or negative, the RKI has started a Germany-wide laboratory query. However, the number of laboratories reporting data seems to vary from week to week.
The report published on 22 April states that “from the beginning of the collection up to and including calendar week 16/2020”:
– The cumulative total of samples tested was 2,072,669;
– For calendar week 16 (which ends on 19 April), 161 labs reported 323,449 samples tested;
– For calendar week 15 (which ends on 12 April), 160 labs reported 378,881 samples tested;
– For calendar week 14 (which ends on 5 April), 152 labs reported 408,173 samples tested;
– For calendar week 13 (which ends on 29 March), 150 labs reported 361,374 samples tested;
– For calendar week 12 (which ends on 22 March), 152 labs reported 348619 samples tested;
– For calendar week 11 (which ends on 15 March), 114 labs reported 127457 samples tested.
– Up to and including calendar week 10 (which ends on 8 March), 90 labs reported 124,716 samples tested.
By subtracting each weekly change from the cumulative total, we retrospectively work out the cumulative totals by the end of each week.
Since laboratories can post-check the tests of past calendar weeks in the RKI test number query, previous figures may be revised upwards slightly in subsequent reports. The source is explicit that these figures refer to tests performed and that this will not equal the number of people tested, because of multiple tests per person.
Source: Outbreak Response Management
Short description: The units are unclear. Some press releases mention “people tested”, while others give figures for “samples tested”.
Latest estimate: 4.17 per thousand people; 129,461 in total (as of 02 May 2020).
Detailed description:
Outbreak Response Management provides daily situation updates on the total number of people or total samples tested for the coronavirus.
Using web archives, we reconstruct a time series. Situation updates report the total number of people tested from 28th March, then the total number of samples tested from 18th April. However, the figures given from one period to the other seem to line up correctly, thus we are not certain what the true units are.
On 24th April, the daily situation update in text format was replaced with an interactive dashboard, still at the same URL. As far we know, this dashboard no longer reports testing data.
We are aware of Ghana’s archived situation reports which provides a breakdown of the total number of tests.
Source: The National Organization of Public Health
Short description: The number of people tested.
Latest estimate: 8.35 per thousand people; 87,052 in total (as of 06 May 2020).
Detailed description:
The Greek National Organization of Public Health publishes daily COVID-19 reports on confirmed cases, deaths and samples tested.
The report refers to its testing data as the number of people who have tested positive and negative since January 1: this means figures represent the number of people tested, excluding those pending results.
More recent reports are explicit that the figures relate to samples tested rather than the number of people: The note mentioned that the figures are “including more than one sample per person tested” (“συμπεριλαμβάνονται και περισσότερα από ένα δείγματα ανά άτομο που ελέγχθηκε”).
It is not totally explicit whether the figures cover all testing in Greece: the figures are labelled as “Samples that have been tested in the laboratories cooperating with EODY” (“Δείγματα που έχουν ελεγχθεί στα συνεργαζόμενα με τον ΕΟΔΥ εργαστήρια”).
The official website provides a list of daily reports. Unfortunately many reports are missing meaning a full daily time-series cannot be constructed. It is unclear how far back testing extends; the earliest available report is on 20th March when 7172 people had been tested.
Source: Centre for Health Protection, Department of Health
Short description: The number of tests performed.
Latest estimate: 20.67 per thousand people; 154,989 in total (as of 27 April 2020).
Detailed description:
The Hong Kong Centre for Health Protection, Department of Health provides monthly numbers of the COVID-19 viral tests performed. We calculate the cumulative number of tests performed each month in our series. The last update with provisional data is up until 14th April 2020, this information is updated once a week by the Centre for Health Protection.
Tests performed are conducted by the Public Health Laboratory Services Branch of the Department of Health and Hospital Authority. We are not aware of any aggregation issues.
The cumulative total begins from 01/01/2020.
Source: Government of Hungary
Short description: The number of samples tested in an accredited laboratory.
Latest estimate: 8.98 per thousand people; 86,743 in total (as of 06 May 2020).
Detailed description:
A figure for the ‘number of samples tested in an accredited laboratory’ (“akkreditált laboratóriumban vizsgált minták száma”) is provided in a graphic in the govenrment’s coronavirus information website. No other information about the data is provided.
We use these official data as collected by the visual and data journalism team of Budapest-based investigative center Atlatszo, made accessible in a public spreadsheet. We have cross-checked a sample of the figures in this unofficial spreadsheet against official figures.
Source: Office of the Director of Public Health
Short description: The number of samples (“Fjöldi sýna”).
Latest estimate: 151.27 per thousand people; 51,622 in total (as of 05 May 2020).
Detailed description:
The Icelandic Office of Public Health publishes a complete time-series of daily samples (“Fjöldi sýna”). This time-series is broken down into two labs where these samples are tested. No other information is provided. It is not clear whether these figures include samples that are pending test results.
The daily time-series data only extends back to 27th February. However, the source shows clearly via annotation on the testing chart that between 1st and 26th February, 41 samples had been tested. We do therefore not know the days across which these samples were taken, only that as of 26th February, the total cumulative number of samples tested was 41.
Source #1: Indian Council of Medical Research
Short description: The number of people tested.
Latest estimate: 0.38 per thousand people; 525,667 in total (as of 24 April 2020).
Detailed description:
The ICMR reports separate figures for both “samples tested” and “people tested” at press conferences and in press releases (shown separately in the charts above). No other details are provided.
The press releases from ICMR do not always stay online for very long. The reason for this is unknown, but the releases are being backed up at this Github repository.
On some occasions there appear to have been more than one update released per day. Where we are aware of multiple observations for the day, we show the number for the earlier release.
Source #2: Indian Council of Medical Research
Short description: The number of samples tested.
Latest estimate: 0.92 per thousand people; 1,276,781 in total (as of 06 May 2020).
Detailed description:
The ICMR reports separate figures for both “samples tested” and “people tested” at press conferences and in press releases (shown separately in the charts above). No other details are provided.
The press releases from ICMR do not always stay online for very long. The reason for this is unknown, but the releases are being backed up at this Github repository.
On some occasions there appear to have been more than one update released per day. Where we are aware of multiple observations for the day, we show the number for the earlier release.
Source: Emerging infections, Indonesian Ministry of Health
Short description: The number of cases tested.
Latest estimate: 0.34 per thousand people; 92,976 in total (as of 06 May 2020).
Detailed description:
The Indonesian Ministry of Health updates its COVID-19 dashboard twice a day but doesn’t keep time series of past data. The two URLs (1, 2) seem to lead to the exact same dashboard.
The dashboard shows the latest number of “Kasus dg Spesimen Diperiksa”, which translates to “Cases with Specimens Checked”.
We found past values using Internet Archive’s Wayback Machine.
Source: Government of Iran
Short description: The number of tests performed.
Latest estimate: 6.33 per thousand people; 531,275 in total (as of 06 May 2020).
Detailed description:
The Government of Iran provides daily press releases of the cumulative number of tests performed to date. It is not clear whether the reported figures refer to the number of samples tested or number of people tested. It is also unclear whether the reported figures include tests for which the results are pending.
We have found testing data dating back to April 5th 2020, at which point 189,790 tests had been conducted to date. It is not clear when the first test was conducted.
Source: Department of Health
Short description: The units are unclear. Some press releases mention “tests carried out”, while others give figures for “people tested”.
Latest estimate: 43.49 per thousand people; 214,761 in total (as of 05 May 2020).
Detailed description:
The Irish Department of Health publishes daily press releases, which sometimes (about once a week) include an updated cumulative total for national tests.
The 10 March release was unclear as to the units: It states both that “1,784 people have been tested” and that “There have been 1,784 suspected cases tested in Ireland, to date – an increase of 1,387 tests in one week.” Subsequent releases refer to “tests carried out”. Overall it remains unclear whether the figures relate to people tested or the number of tests performed.
Occassionally, the press release states that these figures relate to tests “carried out in laboratories across the country”.
No other details about what the numbers refer to are known.
Source: Ministry of Health
Short description: The number of tests performed.
Latest estimate: 47.77 per thousand people; 413,517 in total (as of 05 May 2020).
Detailed description:
The Israel Ministry of Health publishes COVID-19 updates on its official channel on Telegram. This data is published in a format that is extremely challenging to collect. We rely on the data as collected and made available on Github.
On 19 April 2020, the person who maintains the GitHub repository confirmed to us that the units refer to the number of tests performed, after checking the information with the Ministry of Health.
No further information on the geographical scope, number of labs, or types of test included are known.
Source #1: Ministero della Salute
Short description: The number of people tested.
Latest estimate: 25.63 per thousand people; 1,549,892 in total (as of 06 May 2020).
Detailed description:
The official data provided by the Ministry of Health is compiled by the Department of Civil Protection on GitHub. Figures relate to the total number of people tested. This figure is available for each individual region separately at the source indicated. However it appears that data is missing for individual regions for particular dates – we assume that these are also missing from the aggregate total for Italy that we provide. The list of missing data, in English, can be seen at the bottom of this data dashboard built by Franco Mossotto.
It is clear that there are delays in timeline running up to a test being reported – both in terms of the time it takes for a symptomatic person to receive a test, and in the time for that test to then get reported in the data. For one region, Lombardy, an investigation found the latter delay to be around 3-4 days.
There is significant variation in testing practices – in terms of how many tests are conducted and how they are allocated across the population – across regions and these practices have also changed over time. The extent to which tests pending results are included appears to vary across regions.
Pietro Monticone and Riccardo Valperga have written a very helpful and detailed description of these data quality issues here in GitHub.
Source #2: Ministero della Salute
Short description: The number of tests performed.
Latest estimate: 38.22 per thousand people; 2,310,929 in total (as of 06 May 2020).
Detailed description:
The official data provided by the Ministry of Health is compiled by the Department of Civil Protection on GitHub. Figures relate to the total number of tests performed. This figure is available for each individual region separately at the source indicated. However it appears that data is missing for individual regions for particular dates – we assume that these are also missing from the aggregate total for Italy that we provide. The list of missing data, in English, can be seen at the bottom of this data dashboard built by Franco Mossotto.
It is clear that there are delays in timeline running up to a test being reported – both in terms of the time it takes for a symptomatic person to receive a test, and in the time for that test to then get reported in the data. For one region, Lombardy, an investigation found the latter delay to be around 3-4 days.
There is significant variation in testing practices – in terms of how many tests are conducted and how they are allocated across the population – across regions and these practices have also changed over time. The extent to which tests pending results are included appears to vary across regions.
Pietro Monticone and Riccardo Valperga have written a very helpful and detailed description of these data quality issues here in GitHub.
Source #1: Ministry of Health, Labor and Welfare Press Release
Short description: The number of people tested.
Latest estimate: 1.49 per thousand people; 188,927 in total (as of 06 May 2020).
Detailed description:
The Ministry of Health, Labor and Welfare issues daily reports for the total number of people tested. These are collated by a volunteer group on GitHub. We take our figures from this group, and regularly audit it for accuracy. Daily changes in the number of people tested are included in parentheses. For the 3rd April, the daily changes do not reconcile with the cumulative totals. Moreover, it is clear that revisions to past data are simply added to the new cumulative total, making the time series of ‘daily tests’ too erratic to be published.
This includes two cases where the cumulative number of people tested falls: (1) 19/03 and (2) 25/03. For case (1) see footnote 4 which indicates a past mistake has been noticed and the cumulative figure revised on the date to adjust for this. For case (2), we could not find the associated footnote.
It isn’t clear what exact date these cumulative tests date back to, but it is earlier than 10 Feb when the source reports 938 people had been tested. Prior to the 10 Feb, the press releases provide reports of coronavirus infections for the Diamond Princess cruise ship quarantined in Yokohama port. We do not report these numbers in the time series as it is unclear how they relate to the cumulative totals.
Google Translate was used while compiling this data so this may affect our interpretation of the data.
Source #2: Ministry of Health, Labor and Welfare Press Release
Short description: The number of tests performed.
Latest estimate: 2.26 per thousand people; 285,356 in total (as of 04 May 2020).
Detailed description:
On 11th April 2020, the MOH started providing a daily time series on the “Implementation status of PCR tests for new coronavirus in Japan (based on the date on which results were determined” (via Google translate). These are collated by a volunteer group on GitHub. We take our figures from this group, and regularly audit it for accuracy.
With each update, some daily totals are revised from earlier releases of the time series.
Google translate was used while compiling this data so this may affect our interpretation of the data.
Source: Kazakhstan National Center for Public Health
Short description: The number of tests performed.
Latest estimate: 17.92 per thousand people; 336,480 in total (as of 06 May 2020).
Detailed description:
The Kazakhstan National Center for Public Health provides an official time series of the total number of tests performed to date. It is unclear whether the reported figures include tests for which the results are pending.
The website explicitly states that “one person could be tested several times”, indicating that the number of tests performed (“Проведено тестов”) is not equivalent to the number of people tested.
The earliest reported figure is from March 13th 2020, at which point 126 tests had been conducted. It is unclear whether March 13th was the first date on which tests were conducted.
Source: Ministry of Health
Short description: Units are unclear, and could refer to the number of samples tested, or people tested.
Latest estimate: 0.48 per thousand people; 25,869 in total (as of 05 May 2020).
Detailed description:
The Kenya Ministry of Health provides daily press releases and tweets (@MOH_Kenya), sometimes reporting the number of tests conducted in the past 24 hours and sometimes reporting the total number of tests conducted to date.
It is not clear whether the reported figures refer to the number of samples tested or number of people tested, since the press releases and tweets variably use the terminology “samples tested”, “tests conducted”, and “people tested” at different points in time. It is also unclear whether the reported figures include tests for which the results are pending.
We have found testing data dating back to March 6th 2020, at which point 31 tests had been conducted to date. It is not clear when the first test was conducted.
Source: Center for Disease Prevention and Control
Short description: The number of tests performed.
Latest estimate: 36.38 per thousand people; 68,627 in total (as of 06 May 2020).
Detailed description:
The Center for Disease Prevention and Control publishes the number of laboratory tests performed to detect SARS-CoV-2 virus (“Veikto laboratorisko testu skaits, lai noteiktu SARS-CoV-2 vīrusu”) on the Latvian Government’s Open Data Portal. No information is given on the geographical scope and number of labs included.
Source: Ministry of Health
Short description: The number of samples tested.
Latest estimate: 57.49 per thousand people; 156,493 in total (as of 06 May 2020).
Detailed description:
The Ministry of Health provides fairly regular updates of the number of samples that have been analyzed/tested for suspected coronavirus, to date (“Iki šiol iš viso ištirta ėminių dėl įtariamo koronaviruso”). The figures are broken down by. A time series is not available. As such it is not clear the exact date these cumulative figures date back to.
The figures exclude samples that remain untested (i.e. tests pending results).
Source: Luxembourg Government situation update
Short description: The number of tests performed.
Latest estimate: 80.73 per thousand people; 50,533 in total (as of 06 May 2020).
Detailed description:
The Luxembourg government provides a daily situation update listing the ‘number of persons tested since the beginning of the crisis’.
Using web archives, we construct a time series by looking at earlier snapshots of the website. Gaps in the series are due to the lack of archived pages for those particular dates. Archives dating back to April 1st are available.
Earlier updates listed their figures as ‘tests carried out’. Given that there is no visible break in the series, we assume that the figures have always related to the number of people tested and the change in label reflects only a clarification of this.
In the FAQs beneath the figures, the website states that “Only a test on respiratory secretions is currently available to detect the presence of the new coronavirus.”
Source: Ministry of Health Malaysia
Short description: The number of cases tested, including pending.
Latest estimate: 6.86 per thousand people; 222,150 in total (as of 06 May 2020).
Detailed description:
A time series has not yet been released. The figures provided are daily updates to the total number of cases tested. It is not clear the exact date these cumulative figures date back to. The earliest release we have been able to find begins from the 14th February.
The source provides a breakdown of the number of positive, negative, and still pending tests. We report total tests as the sum of positive and negative tests, excluding pending tests. The title of the table indicates that these figures relate to cases. As far as we are aware, cases are equivalent to individuals tested.
In a previous version of this page, we reported total tests as the sum of positive, negative, and pending tests. However, since April 7th 2020, the source has not reported the number of pending tests each day. For this reason, we have updated the time series so that total tests is equal to the sum of positive and negative tests (excluding pending tests) for all days on which we report data.
Source: Health Secretary
Short description: The number of cases tested.
Latest estimate: 0.7 per thousand people; 89,565 in total (as of 05 May 2020).
Detailed description:
The Mexican Health Secretary publishes a dataset on datos.gob.mx, the open data platform of the Mexican government.
The file can be downloaded in CSV format, and gives detailed information on each case (1 row per case). The RESULTADO column gives the status of the case, with 1 = CONFIRMED and 2 = NEGATIVE. The resulting tally can also be found on the government’s COVID-19 dashboard.
While geographical coverage is complete, there is a time lag in the publication of the data, and recent days systematically show temporary low figures. Data starts on 1 January 2020; we do now know if this is because tests started on that date or because earlier data is not available.
The notes to the data provide the following note “Information from the Epidemiological Surveillance System for Viral Respiratory Diseases, reported by the 475 viral respiratory disease monitoring units (USMER) throughout the country in the entire health sector (IMSS, ISSSTE, SEDENA, SEMAR, ETC)…. Preliminary data subject to validation by the Ministry of Health through the General Directorate of Epidemiology. The information contained corresponds only to the data obtained from the epidemiological study of a suspected case of viral respiratory disease at the time it is identified in the medical units of the Health Sector”. (via Google translate)
Source: Morocco Ministry of Health
Short description: The number of cases tested.
Latest estimate: 1 per thousand people; 37,006 in total (as of 01 May 2020).
Detailed description:
The Morocco Ministry of Health provides daily updates of the total number of confirmed cases and the number of cases dismissed following a negative test result. We construct a time series of the cumulative number of cases tested to date using the data stored in this unofficial GitHub repository.
The cumulative number of cases tested to date includes positive and negative test results, while excluding pending results. We have cross-checked a sample of the figures reported in the unofficial source against data reported on the Ministry of Health website.
The earliest reported figure is from March 2nd 2020, at which point 29 cases had been tested. It is unclear whether March 2nd was the first date on which tests were conducted.
Source: Myanmar Ministry of Health and Sports
Short description: The number of samples tested.
Latest estimate: 0.17 per thousand people; 9,295 in total (as of 06 May 2020).
Detailed description:
The Myanmar Ministry of Health and Sports provides a daily snapshot of the total number of specimens tested to date. These figures include positive and negative test results, but exclude pending results.
The earliest reported figure that we have been able to find on the ministry website is from April 3rd 2020, at which point 1183 specimens had been tested.
Source: Ministry of Health and Population
Short description: The number of people tested.
Latest estimate: 0.48 per thousand people; 13,850 in total (as of 05 May 2020).
Detailed description:
The Ministry of Health and Population publishes daily reports on COVID-19, including a table with the number of people tested in each lab. It also differentiates between positive tests, negative tests, and tests pending, allowing to remove pending tests from the total.
We collect the data directly from this GitHub repository.
According to the reports, including the National Public Health Laboratory in Teku, the COVID-19 lab test through PCR is available in 13 institutions across the country with a minimum of one lab in each province.
Source: Dutch National Institute for Public Health and the Environment
Short description: The number of people tested.
Latest estimate: 14.2 per thousand people; 243,277 in total (as of 05 May 2020).
Detailed description:
The Dutch National Institute for Public Health and the Environment releases daily epidemiological reports of the COVID-19 situation. The reports contain a weekly time series of the number of persons tested per week since March 9th 2020. The reports also include the number of persons tested per day in the current week.
There appear to be reporting lags, such that the number of labs reporting for days in the current week tend to be lower than for the previous week. As a result, the reported figures are updated retrospectively as additional labs report their results. The figures we display are based on the latest available epidemiological report.
The epidemiological reports state that ‘all laboratories in the Netherlands that perform diagnostics for SARS-CoV-2 have been asked from 9 March to report these data daily.’ However, the number of labs reporting in a given weekly figure has varied over the course of the reports, which may affect the consistency of the time series we present.
Source: New Zealand Ministry of Health
Short description: The number of tests performed.
Latest estimate: 33.33 per thousand people; 160,700 in total (as of 05 May 2020).
Detailed description:
The New Zealand Ministry of Health provide a time series for tests per day and cumulative tests. The daily figures begin on 9 March, and the cumulative figures date back to 22 January when testing began.
No further details about the data are available.
Source: Nigeria Centre for Disease Control
Short description: The number of samples tested.
Latest estimate: 0.1 per thousand people; 21,208 in total (as of 06 May 2020).
Detailed description:
The Nigeria Centre for Disease Control, on the homepage of the website dedicated to COVID-19, publishes a number of samples tested.
This table often displays figures in a format such as “> 7153”. When this is the case, we have taken the raw number (in our example 7153) as the cumulative total for that day.
No information is given on the geographical scope and number of labs included. It is also unclear whether the reported figures include tests for which the results are pending.
Source: Norwegian Institute of Public Health
Short description: The number of people tested
Latest estimate: 34.72 per thousand people; 188,236 in total (as of 06 May 2020).
Detailed description:
The Norwegian Institute of Public Health produce daily update reports of confirmed cases, deaths and test results. This information includes demographic information of confirmed cases.
These daily reports state the cumulative number of people who have been tested – including the number and share who tested positive. We can use these daily updates to construct a full time-series. Note that the source states that “Data for the last few days is incomplete and will be updated in upcoming daily reports”, that the “Number of tested and proportion of positive findings among the tested is affected by changes in test criteria”. It also notes that “Laboratory data is now retrieved from the new national laboratory database, which gives us [a] more complete data set with regard to sampling date”. Earlier reports noted that “The figure contains only numbers from laboratories that have reports that include the sampling date” [all via Google Translate]. As such, this seems to imply an increase in coverage across laboratories over time.
In addition to the aggregate number of people tested, the source provides a regional breakdown, in which it is noted that tests in ‘private labs that analyze tests across the country’ are excluded. The sum of this breakdown is lower than the aggregate figure provided. We take this as an indication that the main aggregate figure we report includes all private testing.
Daily reports with figures on testing are only available dating back to 16th March. We therefore do not know the first date of testing, only that as of 16th March, 18062 people had been tested.
The time of day to which the testing figures relate appears to have changed. Earlier daily reports refers to those tested up until 3pm (local time) of the previous day. More recent reports relate to those tested up until midnight (local time) of the previous day.
Source: Government of Pakistan
Short description: The number of tests performed.
Latest estimate: 1.05 per thousand people; 232,582 in total (as of 06 May 2020).
Detailed description:
The government of Pakistan publishes a dashboard showing up-to-date national data.
The figures sometimes shows important 1-day increases due to the inclusion of more labs.
Source: Ministry of Health
Short description: Units are unclear, and could refer to the number of tests performed, or people tested.
Latest estimate: 8.46 per thousand people; 36,483 in total (as of 05 May 2020).
Detailed description:
The Panama Ministry of Health in collaboration with the Gorgas Memorial Institute for Health Studies reports the cumulative number of tests performed to date in this dashboard. The reported figures include the total number of positive, negative, and “positive control” test results to date.
It is unclear whether the total number of tests performed (“pruebas realizadas”) refers to the number of people tested or the number of samples tested. The number of reported positive test results is equal to the number of confirmed cases of COVID-19, which suggests that the number of tests performed is equivalent to the number of people tested. However, because the data source does not provide a clear definition, we record the units as “unclear”.
Unfortunately, the Ministry of Health’s official dashboard does not provide a time series of the number of tests performed each day since testing began. Instead, the dashboard only displays a daily snapshot of the total number of tests performed to date. Since we did not begin to monitor this dashboard until April 14th 2020, we construct a time series dating back to March 9th 2020 using data provided in this unofficial Github repository, which we have cross-referenced against data in the official Ministry of Health dashboard for a sample of dates.
Source: Paraguay Ministry of Public Health and Social Welfare
Short description: The number of samples tested.
Latest estimate: 1.67 per thousand people; 11,898 in total (as of 05 May 2020).
Detailed description:
The Paraguay Ministry of Public Health and Social Welfare provides press releases of the daily number of samples tested, alongside the number of these samples that tested positive. It is unclear whether these figures include samples for which the results are still pending.
We construct a time series of the daily number of samples tested using the data stored in this unofficial Github repository. We have cross-checked a sample of the figures reported in this unofficial source against the data reported in official press releases.
It is possible that the figures are equivalent to the number of people tested, since the number of positive samples reported tend to be equal to the daily number of confirmed cases that the ministry reports. However, since the ministry uses the language “samples taken” (“muestras tomadas”) in its press releases, we interpret the units as “sample tested” rather than “people tested”.
The reported figures are cumulative from March 7th 2020, when the first case in Paraguay was confirmed.
Source: Ministry of Health, Government of Peru
Short description: Units are unclear, and could refer to the number of samples performed, or people tested.
Latest estimate: 12.33 per thousand people; 406,579 in total (as of 05 May 2020).
Detailed description:
The Peruvian Ministry of Health provides daily press releases of the cumulative number of positive and negative test results to date, but it is unclear whether the numbers reported reflect “samples tested” or “people tested”. Some press releases report testing data using the language “…samples have been processed for ___ people…” (e.g. “Al 08 de abril de 2020 se han procesado muestras para 39 599 personas”), while other press releases report testing data using the language “…___ samples have been processed…” (e.g. “Al 18 de marzo de 2020 se han procesado 3 075 muestras”).
The reference date for the cumulative number of tests is not mentioned in the press releases. The earliest press release we are able to find is for March 4th, 2020, which reported 107 cumulative test results since an unmentioned date.
The sudden acceleration from 8 April 2020 onwards seems to be related to the addition of serology tests (“Pruebas serológicas rápidas”).
Source: Department of Health
Short description: The number of people tested.
Latest estimate: 1.09 per thousand people; 119,512 in total (as of 04 May 2020).
Detailed description:
The Ministry of Health (MOH) provides a daily snapshot of testing capacity detailing the total number of individuals tested and the total number of tests conducted.
The total number of individuals tested is the sum of positive, negative, equivocal, and invalid individuals. No definitions of equivocal and invalid individual tests are given, hence our figures only report the sum of individuals who have tested positive or negative.
The source provides a breakdown of both i) the number of individuals tested and ii) the total tests conducted, by laboratory. We are not aware of any aggregation issues.
The DOH used to report the number of cases tested in a previous dashboard, but stopped on 4th April. This previous breakdown of the test results and COVID-19 dashboard have both been removed. We became aware of this new tracker on the 13th April with data ‘as of April 11 2020, 12am’. No previous snapshots of the dashboard are available using web archive, therefore the series starts from the 11th April – the earliest date from which we have access to the data.
Source: Ministry of Health of the Republic of Poland
Short description: The number of samples tested.
Latest estimate: 10.85 per thousand people; 410,468 in total (as of 06 May 2020).
Detailed description:
The Polish Ministry of Health (@MZ_GOV_PL) tweets daily reports of the cumulative number of samples tested (“liczba przebadanych próbek”). The figures reported in these tweets are collected by an unofficial source, from which we take our figures, but regularly audit for accuracy.
The first date for which we have found data is March 3rd 2020, in which 559 cumulative samples were tested since an unknown date.
No other information about the figures is known.
Source: Portugal Ministry of Health dashboard
Short description: The number of samples processed
Latest estimate: 46.12 per thousand people; 470,234 in total (as of 04 May 2020).
Detailed description:
The dashboard provides figures for the number of samples processed, both as daily figures and as cumulative figure since the 1 March.
Up until 29 April we had reported a figure of the number of people tested, obtained as the sum of confirmed and unconfirmed cases in the Portugal Ministry of Health (MOH) daily updates. We were alerted by a Technical Advisor within the Cabinet of the Secretary of Health to the fact that these figures only captures people who were reported through the National System of Epidemiological Surveillance which does not include many of the people that get tested but are never entered into the surveillance system (because they do not meet the criteria and go on to test negatively). For this reason we have now switched to the current series. The advisor confirmed to us that this series: includes all the public, private and university labs performing SARS-CoV-2 diagnosis in Portugal; does not include tests pending results; includes only PCR tests.
Source: Qatar Ministry of Public Health
Short description: The number of people tested.
Latest estimate: 39.21 per thousand people; 112,963 in total (as of 06 May 2020).
Detailed description:
The Qatar Ministry of Public Health provides daily updates on its website of the cumulative number of people tested to date. It is not clear whether these figures include people for which test results are pending.
The earliest reported figure that we have been able to find is from March 14th 2020, at which point 6,788 tests had been conducted.
Source: Ministry of Internal Affairs
Short description: The number of tests performed.
Latest estimate: 11.29 per thousand people; 217,139 in total (as of 06 May 2020).
Detailed description:
Data is collected and made available on Github. It includes a cumulative total of tests performed. No information is given on the geographical scope and number of labs included.
The main data source is the press office of the Ministry of Internal Affairs, which provides a daily report on most metrics. Data points are also sourced from the Romanian Ministry of Health and the Romanian National Institute of Public Health and occasionally from news outlets.
Source: Government of the Russian Federation
Short description: The number of tests performed.
Latest estimate: 31.75 per thousand people; 4,633,731 in total (as of 06 May 2020).
Detailed description:
A dedicated website publishes a daily report giving the cumulative total of tests performed in Russia. No information is given on the geographical scope and number of labs included.
We didn’t include cumulative totals reported on 30th March and 31st March, as they seemed inconsistent with numbers given on 29th March and 1st April.
Our figures for the cumulative number of tests performed refer to tests performed up until the previous day. E.g. total tests for 17/04 daily report refer to test data up until 16/04.
Source: Rwanda Ministry of Health
Short description: The number of samples tested.
Latest estimate: 2.78 per thousand people; 35,992 in total (as of 05 May 2020).
Detailed description:
The Rwanda Ministry of Health (@RwandaHealth) tweets press releases in English, French, and Kinyarwanda that report the number of samples tested each day.
The earliest press release we have found containing testing figures is from April 7th 2020. Between April 7th 2020 and May 1st 2020 (inclusive), the press releases reported the number of samples tested today, but not the cumulative number of samples tested to date. Since May 2nd 2020, the press releases have reported the cumulative number of samples tested to date as well as the number of samples tested today. We construct a daily time series since April 6th 2020 of the cumulative number of samples tested to date by subtracting daily tests between April 7th – May 2nd from the May 2nd 2020 cumulative total.
As of April 6th 2020, 5,701 samples had been tested to date. It is unclear when the first samples were tested.
It is unclear whether the reported figures include tests for which the results are pending.
Prior to April 17th 2020, the press releases reported testing figures using the language “samples tested”. From April 17th onwards, the press releases have used the ambiguous language “tests today”. We assume that “tests today” still refers to the number of samples tested.
Source: Ministry of Health
Short description: Units are unclear, and could refer to the number of tests performed, or people tested.
Latest estimate: 11.19 per thousand people; 389,659 in total (as of 06 May 2020).
Detailed description:
The Saudi Arabian Ministry of Health provides a dashboard detailing the total number of tests. Whether units refer to people or tests conducted is unclear.
The exact date these cumulative figures date back to is also unknown.
There is no explicit mention of whether the figures include only PCR tests or other kinds of test.
Source: Ministry for Health and Social Action
Short description: The figures are labelled as the number of ‘tests performed’. Note that from other countries, we see that such a label can be consistent with figures relating to the number of individuals tested.
Latest estimate: 1.04 per thousand people; 17,461 in total (as of 06 May 2020).
Detailed description:
The Senegalese Ministry for Health and Social Action publishes daily press releases detailing the number of tests performed and the number of positive confirmed cases. It is not totally clear whether the number of tests performed is equivalent to the number of people tested. It is also unclear whether the reported figures include pending test results.
The daily press releases date back to February 28th 2020. We construct a daily time series of the number of tests performed using data contained in this unofficial github repository, which we have cross-checked against official data for a sample of dates.
Source: Ministry of Health
Short description: The number of people tested.
Latest estimate: 17.26 per thousand people; 117,474 in total (as of 06 May 2020).
Detailed description:
Reports are published daily by the Serbian Ministry of Health. The data is collected and aggregated by volunteers and published on Github. All labs in Serbia are included.
Source #1: Ministry of Health
Short description: The number of people tested.
Latest estimate: 21.11 per thousand people; 123,525 in total (as of 04 May 2020).
Detailed description:
Singapore’s Ministry of Health has started reporting testing numbers since 10 April 2020. The dashboard gives a cumulative total of swabs tested, and unique persons tested.
No other information is given on how the data was collected and aggregated, and whether coverage was complete.
Source #2: Ministry of Health
Short description: The number of swabs tested.
Latest estimate: 30.02 per thousand people; 175,604 in total (as of 04 May 2020).
Detailed description:
Singapore’s Ministry of Health has started reporting testing numbers since 10 April 2020. The dashboard gives a cumulative total of swabs tested, and unique persons tested.
No other information is given on how the data was collected and aggregated, and whether coverage was complete.
Source: National Center of Health Information and the Slovak Republic Government coronavirus information website
Short description: The number of completed laboratory tests.
Latest estimate: 19.16 per thousand people; 104,606 in total (as of 06 May 2020).
Detailed description:
Slovakia’s National Center of Health Information provides a dashboard with figures for ‘all tests performed’ (“Všetkých vykonaných testov”).
Using web archives, we construct a daily time series of total samples by looking at earlier snapshots of the website. These archives begin from the 15th March. We are unable to determine when testing began, only that on the 15th March a total of 1545 tests had been conducted. Earlier archives make it clear that the figures relate to the sum of positive and negative tests (i.e. tests pending results are not included).
We found the total number of negative and positive samples was identical for the 26/03 and 27/03. The reason for this is not clear. We include only the former date as an observation. From the 29/03 – 01/04 and 05/04 – 07/04 no web archives could be retreived.
From the 14th April, we became aware of a short term dashboard by the National Centre of Health and Information providing the same figures over the last 6 days. We have used this source to supplement testing data for the 10th April where web archives were not available. The notes to this dashboard provide further elaboration. They state that the figures relate to the “number of completed laboratory tests… The number contains all positive and negative results also retests of previously tested positive patients” (via Google translate).
Source: Slovenian Government coronavirus information page
Short description: The number of tests performed.
Latest estimate: 28.34 per thousand people; 58,923 in total (as of 05 May 2020).
Detailed description:
The Government information website provides figures for the number of tests completed (“Opravljeni testi”). A time series of both cumulative and daily tests is available to download. This date back to the 12 March, where 3863 tests are reported to have already been performed (it is not known from which date this first cumulative figure dates back to).
The same cumulative figure is published each day by the National Insitute for Public Health (NIJZ). Here they clarify that figures relate to the number of tests – including those for people who were tested several times.
A footnote states that the figures relate to “Laboratory tests performed as part of routine testing and the COVID-19 National Survey are included.” The later appears to refer to the prevalence study described on this Government page. The description of the study states that “The survey is being conducted on a random sample of 3,000 persons” and that people will be tested with both a PCR and a serological test.
The volunteer-led Sledilnik.org project also presents the official data in a helpful website.
Source: National Institute for Communicable Diseases (NICD)
Short description: The number of people tested.
Latest estimate: 4.52 per thousand people; 268,064 in total (as of 05 May 2020).
Detailed description:
The South African National Institute for Communicable Diseases (NICD) publishes daily updates on the number of confirmed cases, deaths and tests conducted nationally and by province. These updates are published on its website and on its offical Twitter account (@nicd_sa).
The NICD reports the number of ‘tests conducted’ in addition to the number of ‘positive cases’ (and sometimes the number of ‘negative cases’). This is suggestive that ‘tests conducted’ refers to the number of people tested, but this was unclear from the available documentation until April 18th 2020. On April 18th, the official twitter account for the Department for Health clarified that repeat tests for COVID-19 are not counted and that the number ‘tests conducted’ refers to people tested.
The NICD began publishing daily updates on 7th February 2020, allowing us to develop a time series from this date forward. We do not know the first date of testing. As of 7th February, 42 people had been tested.
Source: South Korea CDC
Short description: The number of cases tested.
Latest estimate: 12.54 per thousand people; 643,095 in total (as of 06 May 2020).
Detailed description:
KCDC have provided daily updates in English since 21 January. The figures they provide relate to ‘cases’, where this signifies an individual considered eligible for testing due to their symptoms, travel history or contact history.
The figures shown below include those cases pending test results. The daily updates show the change each day and the current totals. These form a consistent chain all the way back to 21 January. The daily test figures we provide relate to the daily change in the number of tests with results. As such it includes both the number of tests performed in that day and the change in the stock of tests pending results.
We are not aware of any significant issues affecting comparisons over time.
Source: Ministerio de Sanidad, Consumo y Bienestar Social
Short description: The number of tests performed.
Latest estimate: 28.9 per thousand people; 1,351,130 in total (as of 30 April 2020).
Detailed description:
Official data covering the whole of Spain was only published sporadically until the end of April 2020.
The first estimate in our time series comes from a Ministry of Health press release, quoting Salvador Illa, Minister of Health: “From the beginning of the crisis and until April 13, the total number of PCR carried out in Spain is 930,230.” The press release is here.
The second is another Ministry of Health press release published on 27 April and relating to testing conducted up to 23 April. It provides a breakdown across Autonomous Communities (regions), with a total for Spain of 1,035,522 PCR tests. The same release provides a figure of 310,038 antibody tests conducted nationwide. These are different to the PCR tests, as we discuss here. Our database aims to not include antibody tests. So in order to provide the data that is most comparable to the other countries in our database, we include only the PCR tests count for this observation.
One aspect of the 27 April press release that is not totally clear is whether the figures provided for each Autonomous Community relate to the 23 April. Comparing the regional breakdowns provided in the Ministry of Health release to those collected from official sources by CIVIO (as of 28 April) suggests that the figure of 203,892 provided for Madrid in the Ministry of Health update—ostensibly dating to the 23 April—may date back to 14 April.
Further data points are collected from the Ministry of Health’s press releases or its Twitter account.
CIVIO is a non-profit investigative data journalism organisation who are collating information on tests performed within each Autonomous Community, as released through official channels (communication offices, web pages, press releases and social networks of the different regions). We do not report these figures because their data are not complete: For some autonomous communities, figures are available only irregular intervals. The figures they provide are broadly in-line with those of the Ministry of Health releases, although with somewhat lower figures for some Autonomous Communities. This may be due to the Ministry of Health having access to more recent estimates for these Autonomous Communities.
Source: Public Health Agency
Short description: The number of people tested.
Latest estimate: 14.7 per thousand people; 148,500 in total (as of 03 May 2020).
Detailed description:
The weekly report gives the cumulative total of individuals “analyzed for the virus that causes covid-19 in Sweden”, along with weekly totals.
By subtracting each weekly change from the cumulative total, we can retrospectively work out the cumulative totals by the end of each week.
Figures are often rounded off to the nearest hundred, indicating that they might not be extremely precise. The report does not indicate whether pending tests are included in the counts.
A note is provided at the same website indicating that the testing strategy has changed over time: “Initially, people who were living in areas with known spread of covid-19 were sampled. But since mid-March, people with symptoms consistent with covid-19 infection who are in need of inpatient hospital care, healthcare personnel and elderly care, and people who are being tested in sentinel testing are primarily being tested. This means that people with mild symptoms are not asked to contact the health care and therefore do not end up in the statistics of reported cases.” (via Google Translate)
Source: Federal Office of Public Health
Short description: The number of tests perfomed.
Latest estimate: 33.55 per thousand people; 290,365 in total (as of 05 May 2020).
Detailed description:
The Federal Office of Public Health presents a time series of daily positive and negative tests as a graphic. The data can be accessed by downloading the graphic software file. The graphic notes that “Since several tests can be taken and reported per person, the number of positive tests is higher than the number of positively tested people”. (via Googl translate).
The Federal Office of Public Health also publishes a daily report on the epidemiological situation, in which very similar cumulative figures are provided, but often rounded-off. These reports present the figures as “The number of tests carried out on SARS-CoV-2, the causative agent of COVID-19”.
Source: Taiwan Centers for Disease Control (CDC)
Short description: The figures are labelled in the source only as ‘tested’. It is unclear whether this relates to the number of individuals tested, or the number of samples tested.
Latest estimate: 2.75 per thousand people; 65,589 in total (as of 05 May 2020).
Detailed description:
The Taiwanese Centers for Disease Control (CDC) host a dashboard in which they publish the total ‘tested’ to date, and ‘new from yesterday’. It is not clear whether this represents the total number of tests performed, or the number of people tested. The number ‘tested’ is greater than the sum of confirmed cases and ‘excluded’ (i.e. negative) test results. This would suggest it does not equal the total number of people tested, or if it does, pending results without a reported outcome are also included.
Although the CDC only show the last day’s figures on this dashboard, we can construct a time-series by looking at previous versions on web archive. Where possible we have tried to take the total test counts at the same time every day (those published at 00:30h). Unfortunately this time of publishing from CDC was not always completely consistent. This may lead to small discrepancies between ‘total tested’ and ‘new from ‘yesterday’ figures. Wherever possible we took the total test count as of 00:30 as the prefered figure; where a day of data was missing we used the ‘new from yesterday’ figure to calculate the total for the previous day. If there are small discrepancies with other sources, this timing issue is likely to be the cause. In any case it is likely to be minor.
The date from which the total test figures date back to is not known; the CDC dashboard is unavailable in web archives prior to 21st March.
Source: Thailand, Department of Disease Control
Short description: The number of people tested.
Latest estimate: 1.24 per thousand people; 86,320 in total (as of 06 May 2020).
Detailed description:
The Thailand Department of Disease Control issues daily situation reports which detail the status of confirmed cases, deaths and people being assessed.
We provide the figures reported as ‘persons under investigation’ (PUI). PUI is the sum of confirmed cases, the number of people who tested negative, and the number of people for whom results are still pending. All three figures are reported individually from 3rd March until 31st March. From 1st April onwards, the number of people who tested negative and the number for whom results are still pending are no longer reported separately.
We have received communication from Thailand’s Ministry of Health (MOH) that individuals who did not meet PUI criteria can pay out of pocket to have their samples tested, referred to as the “non-PUI” group. This “non-PUI” group is large in the context of Thailand. Daily figures are currently being consolidated by the MOH. At the moment, this “non-PUI” group is not reflected in our current figures.
Source: Tunisian Ministry of Health
Short description: Figures are provided both in terms of the number of cases tested and the number of tests. It may be that in the case of Tunisia the distinction between the number of individuals tested and the number of tests performed is less significant, if few people are tested more than once.
Latest estimate: 2.13 per thousand people; 25,165 in total (as of 04 May 2020).
Detailed description:
The Tunisian Ministry of Health dashboard provides daily figures of the total number of cases tested (‘Cas testés’). They also provide a time series for the number of tests per day (‘Nombre de tests journaliers’). The figures we provide relate to the latter.
The time series figures sum up to a number slightly higher than the cumulative figure provided for cases tested. We understand this to be equivalent to the number of individuals tested. It is unclear whether the difference between the numbers relates to a genuine distinction in the two figures between the number of indivudals tested and the number of tests performed, or if the differences are due instead to reporting delays or other unintended discrepancies.
It’s important to note that when figures exceed 1000, the Tunisian Ministry of Health report the number of tests per day to the nearest hundred (e.g. 1.6k).
The first date in the time series of daily tests is 10th March, for which 28 tests were reported.
Source: Turkish Ministry of Health
Short description: The total number of tests.
Latest estimate: 14.64 per thousand people; 1,234,724 in total (as of 06 May 2020).
Detailed description:
The Turkish Ministry of Health now publishes a daily chart of Coronavirus confirmed cases, deaths, recoveries, total tests (“TOPLAM TEST SAYISI”), and tests today (“BUGÜNKÜ TEST SAYISI”).
These daily charts are published on the Turkish Ministry of Health’s website – previous versions can be found on Web Archive. This only extends back to 27th March. Prior to this date, we rely on figures reported by the Turkish Minister for Health at daily press conferences. In these reports they detail the latest update of confirmed cases, deaths and tests conducted.
We are not aware of the date that testing began: only that as of 18th March – the first data point in our series – 10,018 tests had been conducted.
No other information concerning the figures is known.
Source: Press Release from the Office of the Director General
Short description: The number of samples tested.
Latest estimate: 0.96 per thousand people; 44,094 in total (as of 05 May 2020).
Detailed description:
The Office of the Director General publishes a daily press release detailing the cumulative number of samples tested to date, on the MOH official twitter account. The earliest press release that lists the cumulative total is 6th April. However, we cannot say with certainty when testing began and the precise date from which cumulative totals begin.
After the 14th April, press releases by the Office of the Director General publishes the daily number of samples tested. We sum the cumulative total number of samples tested for the previous day with the daily number of samples tested today. For example, the total number of samples tested on the 15th April is equal to the cumulative total up until the 14th April plus the number of samples tested on the 15th April. For the 18th April, we rely on the figure reported by the MOH official twitter account to calculate our cumulative totals.
We are aware of Uganda’s MOH information portal, however, it only lists the ‘cumulative # tested’ without specifying more precise units of measurement. Our cumulative totals for the number of samples tested from 19/04 matches the ‘cumulative # tested’ total in the Uganda information portal for 20/04. This suggests the ‘cumulative # tested’ refers to the samples tested up until the previous day.
Source: Cabinet of Ministers of Ukraine
Short description: It is unclear whether the reported figures represent the number of cases tested, number of samples tested, or number of people tested.
Latest estimate: 3.3 per thousand people; 144,283 in total (as of 06 May 2020).
Detailed description:
The Cabinet of Ministers of Ukraine reports daily snapshots here of the total number of tests to date. The unit of testing is unclear, since the figures are merely reported as “[N] tested” (“протестовано”). For this reason, it is unclear whether the reported figures represent the number of cases tested, the number of samples tested, or the number of people tested. It is also unclear whether the reported figures include pending test results.
The earliest reported figure that we have been able to find is from April 9th 2020, at which point 20,608 cumulative tests were reported.
Source #1: Public Health England/Department of Health and Social Care
Short description: The number of people tested.
Latest estimate: 15.79 per thousand people; 1,072,144 in total (as of 06 May 2020).
Detailed description:
A time series is not yet released. The figures we provide relate to the daily updates provided for the cumulative total and daily number of people tested. It is not clear the exact date that the cumulative figures date back to.
We were informed on 26 April 2020 that the daily changes in cumulative total, which we previously calculated by subtracting one day’s running total from the next one, couldn’t in fact be calculated in this way, and were provided directly on the page instead. We thus readjusted our time series using Tom White’s archives on GitHub, and from 26 April 2020 onwards we collect both figures directly from the official page.
The UK now provides its figures according to the ‘pillars’ of it’s testing strategy, as follows:
Pillar 1: swab testing in PHE labs and NHS hospitals for those with a clinical need, and health and care workers
Pillar 2: swab testing for health, social care and other essential workers and their households
Pillar 4: serology and swab testing: a national surveillance programme supported by PHE, ONS and Biobank to learn more about the prevalence and spread of the virus
As of 30 April, there were no people tested under Pillar 4 included in this series.
(As discussed in the Govenerment’s national testing strategy document, Pillar 3 relates to antibody tests – but these are currently not reported within the figures above).
The Health Service Journal highlighted in an article published on 1 May 2020 that “the Department of Health and Social Care [was] now including tests that have been posted or delivered to people’s homes in its figures. This means tests which are sent to people are counted before the recipient has provided and returned their sample to a laboratory.” No data is made available by the UK government on how many of these mailed tests have been returned and processed, but this could represent a significant number for recent days. As far as we know, the “People tested” figures are not affected by this issue.
Source #2: Public Health England/Department of Health and Social Care
Short description: The number of tests performed, including tests posted or delivered but not yet returned and/or processed.
Latest estimate: 21.33 per thousand people; 1,448,010 in total (as of 06 May 2020).
Detailed description:
A time series is not yet released. The figures we provide relate to the daily updates provided for the cumulative total and daily number of tests performed. It is not clear the exact date that the cumulative figures date back to.
We were informed on 26 April 2020 that the daily changes in cumulative total, which we previously calculated by subtracting one day’s running total from the next one, couldn’t in fact be calculated in this way, and were provided directly on the page instead. We thus readjusted our time series using Tom White’s archives on GitHub, and from 26 April 2020 onwards we collect both figures directly from the official page.
The UK now provides its figures according to the ‘pillars’ of it’s testing strategy, as follows:
Pillar 1: swab testing in PHE labs and NHS hospitals for those with a clinical need, and health and care workers
Pillar 2: swab testing for health, social care and other essential workers and their households
Pillar 4: serology and swab testing: a national surveillance programme supported by PHE, ONS and Biobank to learn more about the prevalence and spread of the virus
As of 30 April, around 10% of the total number of tests were reported under Pillar 4. How these further breakdown between serology and swab testing is not known.
As discussed in the Govenerment’s national testing strategy document, Pillar 3 relates to antibody tests – but these are currently not reported within the figures above.
The Health Service Journal highlighted in an article published on 1 May 2020 that “the Department of Health and Social Care [was] now including tests that have been posted or delivered to people’s homes in its figures. This means tests which are sent to people are counted before the recipient has provided and returned their sample to a laboratory.” No data is made available by the UK government on how many of these mailed tests have been returned and processed, but this could represent a significant number for recent days. As far as we know, the “People tested” figures are not affected by this issue.
Source #1: COVID Tracking Project
Short description: The data are an aggregation of figures released by individual states. The Project aim to report on the number of people tested, including private labs, but not all states report their figures in this way.
Latest estimate: 22.79 per thousand people; 7,544,328 in total (as of 05 May 2020).
Detailed description:
This is a collaborative project launched in order to fill some of the important gaps in the testing figures being collated by the CDC.
Testing data is gathered from individual states, as reported in state health department websites, data dashboards and press releases from officials.
States currently report testing figures in a range of different ways: some report the number of tests performed, others the number of people tested; some include private labs, others not; some report negative test results, others only positive test results; some include pending tests, others do not (below we show figures that exclude explicitly pending results).
Moreover, many states do not explicitly provide details about these important factors needed to interpret the data they provide.
There are issues in comparing the figures over time. The totals given for early on in the outbreak do not include all states. One significant uncertainty is the extent to which the rapid rise in tests seen from the mid-March in part reflects states beginning to report private lab tests.
Overall the figures should be seen as providing a general indication of testing output, rather than a specific count of a given indicator. Given the very incomplete coverage and reporting delays of the CDC data, it provides a very important additional perspective.
The Project documents their work in lots of detail. See the link provided above for full details.
Source #2: US CDC
Short description: The number of specimens tested in public labs only.
Latest estimate: 1.83 per thousand people; 606,361 in total (as of 28 April 2020).
Detailed description:
In addition to CDCs labs, the figures include specimens tested at public health labs in 49 states, New York City, Puerto Rico, USAF, and 15 California Counties.
As such the figures do not include private lab tests, which are occurring in significant numbers.2
Daily figures are provided since 18 January. CDC suggest that figures within 7 days of the update “are incomplete because of the lag in time between when specimens are accessioned, testing is performed, and results are reported”. As such we only provide figures after this 7 day cut off.
The CDC documents very well what is and is not included in its published testing figures. See the source linked to above for more details.
Source: Ministry of Public Health
Short description: The number of tests performed.
Latest estimate: 6.86 per thousand people; 23,811 in total (as of 06 May 2020).
Detailed description:
The Ministry of Public Health in Uruguay publishes daily reports providing the cumulative total of tests performed. We received confirmation that the figures refer to tests, and not people. The source notes that “there are people who have been tested more than once. This explains why the total number of positive tests does not coincide with that of people with positive tests.”
We previously reported testing data from a dashboard maintained by El Observador, but on 20 April 2020 we replaced the entire time series based on the reports from the Ministry of Health.
Source: Vietnamese Ministry of Health
Short description: The source reports this as the ‘number of samples tested’. However, based on the context, it is unclear whether this refers to the total number of tests conducted, or number of people who have been tested.
Latest estimate: 2.68 per thousand people; 261,004 in total (as of 29 April 2020).
Detailed description:
The Vietnamese Ministry of Health update its disease situation statistics page daily with the latest data on confirmed cases, deaths and samples tested.
It refers to its testing data as ‘samples tested’, and reports confirmed cases and negative samples separately; ‘sample tested’ generally matches the sum of confirmed cases and negative samples (though there are occasionally some small discrepancies – we report the sum of positive and negative in this case). This would suggest that ‘samples tested’ is equivalent to the number of people tested. However, it’s unclear whether ‘negative samples’ includes some instances of resampling for the same person. We therefore cannot say with certainty that these are equivalent.
Using web archives we can reconstruct a daily time-series of total samples by looking at previous versions of the updated website. These daily updates extend back to 2nd March. We cannot say with certainty when testing began, only that as of 2nd March 1753 samples had been tested.
Source: Zimbabwe Ministry of Health and Child Care
Short description: The number of tests performed.
Latest estimate: 1 per thousand people; 14,821 in total (as of 05 May 2020).
Detailed description:
The Zimbabwe Ministry of Health and Child Care provides daily press releases on its website and Twitter account (@MoHCCZim) that report the cumulative number of tests performed to date. The reported figures include positive, negative, and pending test results. It is not clear how many people have been tested, since the reported figures refer only to the number of tests conducted rather than the number of people tested.
The earliest reported figure that we have been able to find is from March 15th 2020, at which point 14 tests had been conducted.
Countries for which official data could not be found
Below is the list of countries for which we have attempted to collect data but could not find official sources.
- Algeria (last checked on 05 May 2020): no data from official sources could be found.
- American Samoa (last checked on 05 May 2020): no data from official sources could be found.
- Andorra (last checked on 05 May 2020): no data from official sources could be found.
- Angola (last checked on 05 May 2020): no data from official sources could be found.
- Aruba (last checked on 05 May 2020): no data from official sources could be found.
- Belize (last checked on 05 May 2020): no data from official sources could be found.
- Benin (last checked on 05 May 2020): no data from official sources could be found.
- Bermuda (last checked on 05 May 2020): no data from official sources could be found.
- British Virgin Islands (last checked on 05 May 2020): no data from official sources could be found.
- Burundi (last checked on 05 May 2020): no data from official sources could be found.
- Cambodia (last checked on 05 May 2020): no data from official sources could be found.
- Cameroon (last checked on 05 May 2020): no data from official sources could be found.
- Cape Verde (last checked on 05 May 2020): no data from official sources could be found.
- Cayman Islands (last checked on 05 May 2020): no data from official sources could be found.
- Central African Republic (last checked on 05 May 2020): no data from official sources could be found.
- Chad (last checked on 05 May 2020): no data from official sources could be found.
- China (last checked on 05 May 2020): we are not aware of any figures relating to the whole of China. There is some data relating to parts of China, for instance press releases concerning testing in Guangdong province.
- Comoros (last checked on 05 May 2020): no data from official sources could be found.
- Congo (last checked on 05 May 2020): no data from official sources could be found.
- Cote d’Ivoire (last checked on 05 May 2020): no data from official sources could be found.
- Curacao (last checked on 05 May 2020): no data from official sources could be found.
- Democratic Republic of Congo (last checked on 16 April 2020): We have been unable to find any testing figures on the Ministry of Health website or other official sources.
- Dominica (last checked on 05 May 2020): no data from official sources could be found.
- Egypt (last checked on 05 May 2020): no data from official sources could be found.
- Equatorial Guinea (last checked on 05 May 2020): no data from official sources could be found.
- Fiji (last checked on 05 May 2020): no data from official sources could be found.
- French Guiana (last checked on 05 May 2020): no data from official sources could be found.
- Gabon (last checked on 05 May 2020): no data from official sources could be found.
- Georgia (last checked on 05 May 2020): no data from official sources could be found.
- Gibraltar (last checked on 05 May 2020): no data from official sources could be found.
- Grenada (last checked on 05 May 2020): no data from official sources could be found.
- Guam (last checked on 05 May 2020): no data from official sources could be found.
- Guatemala (last checked on 05 May 2020): no testing data from official sources could be found.
- Guinea (last checked on 05 May 2020): no data from official sources could be found.
- Guinea-Bissau (last checked on 05 May 2020): no data from official sources could be found.
- Guyana (last checked on 05 May 2020): no data from official sources could be found.
- Haiti (last checked on 05 May 2020): no data from official sources could be found.
- Honduras (last checked on 05 May 2020): no testing data from official sources could be found.
- Jamaica (last checked on 05 May 2020): no data from official sources could be found.
- Jordan (last checked on 05 May 2020): no data from official sources could be found.
- Kiribati (last checked on 05 May 2020): no data from official sources could be found.
- Kosovo (last checked on 05 May 2020): no data from official sources could be found.
- Kyrgyzstan (last checked on 05 May 2020): no data from official sources could be found.
- Laos (last checked on 05 May 2020): no data from official sources could be found.
- Lebanon (last checked on 05 May 2020): no data from official sources could be found.
- Lesotho (last checked on 05 May 2020): no data from official sources could be found.
- Liechtenstein (last checked on 05 May 2020): no data from official sources could be found.
- Macao (last checked on 05 May 2020): no data from official sources could be found.
- Madagascar (last checked on 05 May 2020): no data from official sources could be found.
- Mali (last checked on 05 May 2020): no data from official sources could be found.
- Marshall Islands (last checked on 05 May 2020): no data from official sources could be found.
- Mauritania (last checked on 05 May 2020): no data from official sources could be found.
- Mauritius (last checked on 05 May 2020): no data from official sources could be found.
- Micronesia (country) (last checked on 05 May 2020): no data from official sources could be found.
- Moldova (last checked on 05 May 2020): no data from official sources could be found.
- Monaco (last checked on 05 May 2020): no data from official sources could be found.
- Mongolia (last checked on 05 May 2020): no data from official sources could be found.
- Montenegro (last checked on 05 May 2020): no data from official sources could be found.
- Nauru (last checked on 05 May 2020): no data from official sources could be found.
- New Caledonia (last checked on 05 May 2020): no data from official sources could be found.
- Nicaragua (last checked on 05 May 2020): no data from official sources could be found.
- Niger (last checked on 05 May 2020): no data from official sources could be found.
- North Korea (last checked on 05 May 2020): no data from official sources could be found.
- Northern Mariana Islands (last checked on 05 May 2020): no data from official sources could be found.
- Palau (last checked on 05 May 2020): no data from official sources could be found.
- Papua New Guinea (last checked on 05 May 2020): no data from official sources could be found.
- Saint Kitts and Nevis (last checked on 05 May 2020): no data from official sources could be found.
- Saint Lucia (last checked on 05 May 2020): no data from official sources could be found.
- Saint Vincent and the Grenadines (last checked on 05 May 2020): no data from official sources could be found.
- Samoa (last checked on 05 May 2020): no data from official sources could be found.
- San Marino (last checked on 05 May 2020): no data from official sources could be found.
- Sao Tome and Principe (last checked on 05 May 2020): no data from official sources could be found.
- Sint Maarten (Dutch part) (last checked on 05 May 2020): no data from official sources could be found.
- Solomon Islands (last checked on 05 May 2020): no data from official sources could be found.
- Somalia (last checked on 05 May 2020): no data from official sources could be found.
- South Sudan (last checked on 05 May 2020): no data from official sources could be found.
- Sri Lanka (last checked on 05 May 2020): no data from official sources could be found.
- Sudan (last checked on 05 May 2020): no data from official sources could be found.
- Suriname (last checked on 05 May 2020): no data from official sources could be found.
- Syrian Arab Republic (last checked on 05 May 2020): no data from official sources could be found.
- Tajikistan (last checked on 05 May 2020): no data from official sources could be found.
- Tanzania (last checked on 16 April 2020): The Tanzania Ministry of Health press releases report the number of confirmed cases, but not the number of tests conducted. We have been unable to find official testing figures from any other official source.
- Togo (last checked on 05 May 2020): no data from official sources could be found.
- Tonga (last checked on 05 May 2020): no data from official sources could be found.
- Turkmenistan (last checked on 05 May 2020): no data from official sources could be found.
- Turks and Caicos Islands (last checked on 05 May 2020): no data from official sources could be found.
- Tuvalu (last checked on 05 May 2020): no data from official sources could be found.
- United States Virgin Islands (last checked on 05 May 2020): no data from official sources could be found.
- Uzbekistan (last checked on 05 May 2020): no data from official sources could be found.
- Vanuatu (last checked on 05 May 2020): no data from official sources could be found.
- Venezuela (last checked on 05 May 2020): no testing data from official sources could be found.
- Yemen (last checked on 05 May 2020): no data from official sources could be found.
Frequently Asked Questions about our COVID-19 Testing dataset
We do not have testing data for all countries.
For some countries we are aware of a source of data and are currently in the process of adding it to our dataset.
For others, we are not aware of any official source of testing data.
If you are aware of a source of testing data for a country that we do not currently list, you can help us by filling out this Google Form.
Testing data is collected by Our World in Data by browsing public information from official sources. We rely on figures published on official websites, in press releases and by social media accounts of national authorities—usually governments, ministries of health, or centres for disease control.
Our testing dataset is entirely replicable:
- Links to the main sources for each country are provided in detailed source descriptions;
- We list specific individual sources for each data point in files available on GitHub.
We regularly update our testing data—around twice a week. You can see when we last updated the dataset at the top of this section.
We only use information made publicly available by each country. Many countries do not release figures on a daily basis.
Few countries explicitly state whether their published figures include tests pending results or not. We note any available information about this in the data descriptions for each country.
Where figures including and excluding pending tests are both available, we exclude them from our figures. The details of this are always documented in the data descriptions for each country.
As a minimum requirement, we only include figures in the dataset that count both positive and negative test outcomes (and if included, pending results too) according to a consistent unit (i.e. the figures for both positive and negative test outcomes refer either to the number of tests, or the number of people tested, but not a mix of the two units).
Anyone can track changes to our data and updates using our GitHub repository. Each file presents a full history of changes (commits). This allows viewers to trace back any addition or edit to a particular date and time.
Our World in Data does not report data privately to any party. Similarly, countries do not report privately to Our World in Data either.
Every source we consult is public, our data collection can be replicated, and our numbers can be used by anyone. Any person or organization can consult and use our database.
In particular, Our World in Data does not report directly to international organizations. When these organizations want to rely on our data, they visit our website, and access the same public information that is available to everyone.
Our World in Data highlights ambiguities or problems with official sources; but this process is entirely done based on public information, and there is no direct verification with government officials. We list all ambiguities and data problems for each country in the detailed source descriptions.
Where countries provide disaggregated testing figures for different testing technologies, we will include only PCR tests in this dataset. The reason for this is explained in our background information on testing.
Few countries currently explicitly state the testing technology to which their figures relate. However, many countries refer to their testing figures as relating to ‘laboratory’, ‘diagnostic’, or ‘swab’ testing. In general, this is an indication that figures relate to PCR tests, particularly in the context that this technology remains the WHO recommended basis for case confirmation.14
As of 4 May, we are only aware of official data on antibody tests published by Spain and Ecuador.
We do plan to publish a new dataset showing figures specifically on antibody tests. This is an area where we plan to expand as more countries adopt systematic antibody testing strategies.
We would like to acknowledge and thank a number of people in the development of this work:
Tom Chivers for editorial review and feedback.
Bernadeta Dadonaite, Jason Hendry, and Moritz Kraemer for helpful comments and suggestions on earlier versions of this work.
Natalie Dean, Eric Topol, Carl Bergstrom and Adam Kucharski for their immediate and helpful feedback on our testing database.
And we would like to thank the many hundreds of readers who give us feedback on this work every day. Your feedback is what allows us to continuously clarify and improve it. We very much appreciate you taking the time to write.
Even if we can’t respond to every message we receive, we do read all feedback and take it all into account.


