The Human Development Index and related indices: what they are and what we can learn from them
Researchers have developed several indices that aim to capture human development. How do they work?
Measuring human development helps us understand how people’s lives and livelihoods vary across the world and how they have changed over time.
There are several prominent measures that try to capture these changes:
- The Human Development Index (HDI)
- The Inequality-adjusted Human Development Index (IHDI)
- The Gender Development Index (GDI)
- The Augmented Human Development Index (AHDI)
The first three are published by the United Nations Development Programme. The AHDI, meanwhile, was developed by the economic historian Leandro Prados de la Escosura.
All these measures seek to broaden the scope of development beyond simple economic growth and to capture other key metrics that track peoples’ living standards.
However, measuring human development comes with many challenges. People do not always agree on what should be included. And even once defined, features of human development are difficult to measure.
So how do these indices track human development? And what can we learn from them?
We summarize the similarities and differences between the different approaches in this article and how to decide on which one to use.1
The Human Development Index (HDI)
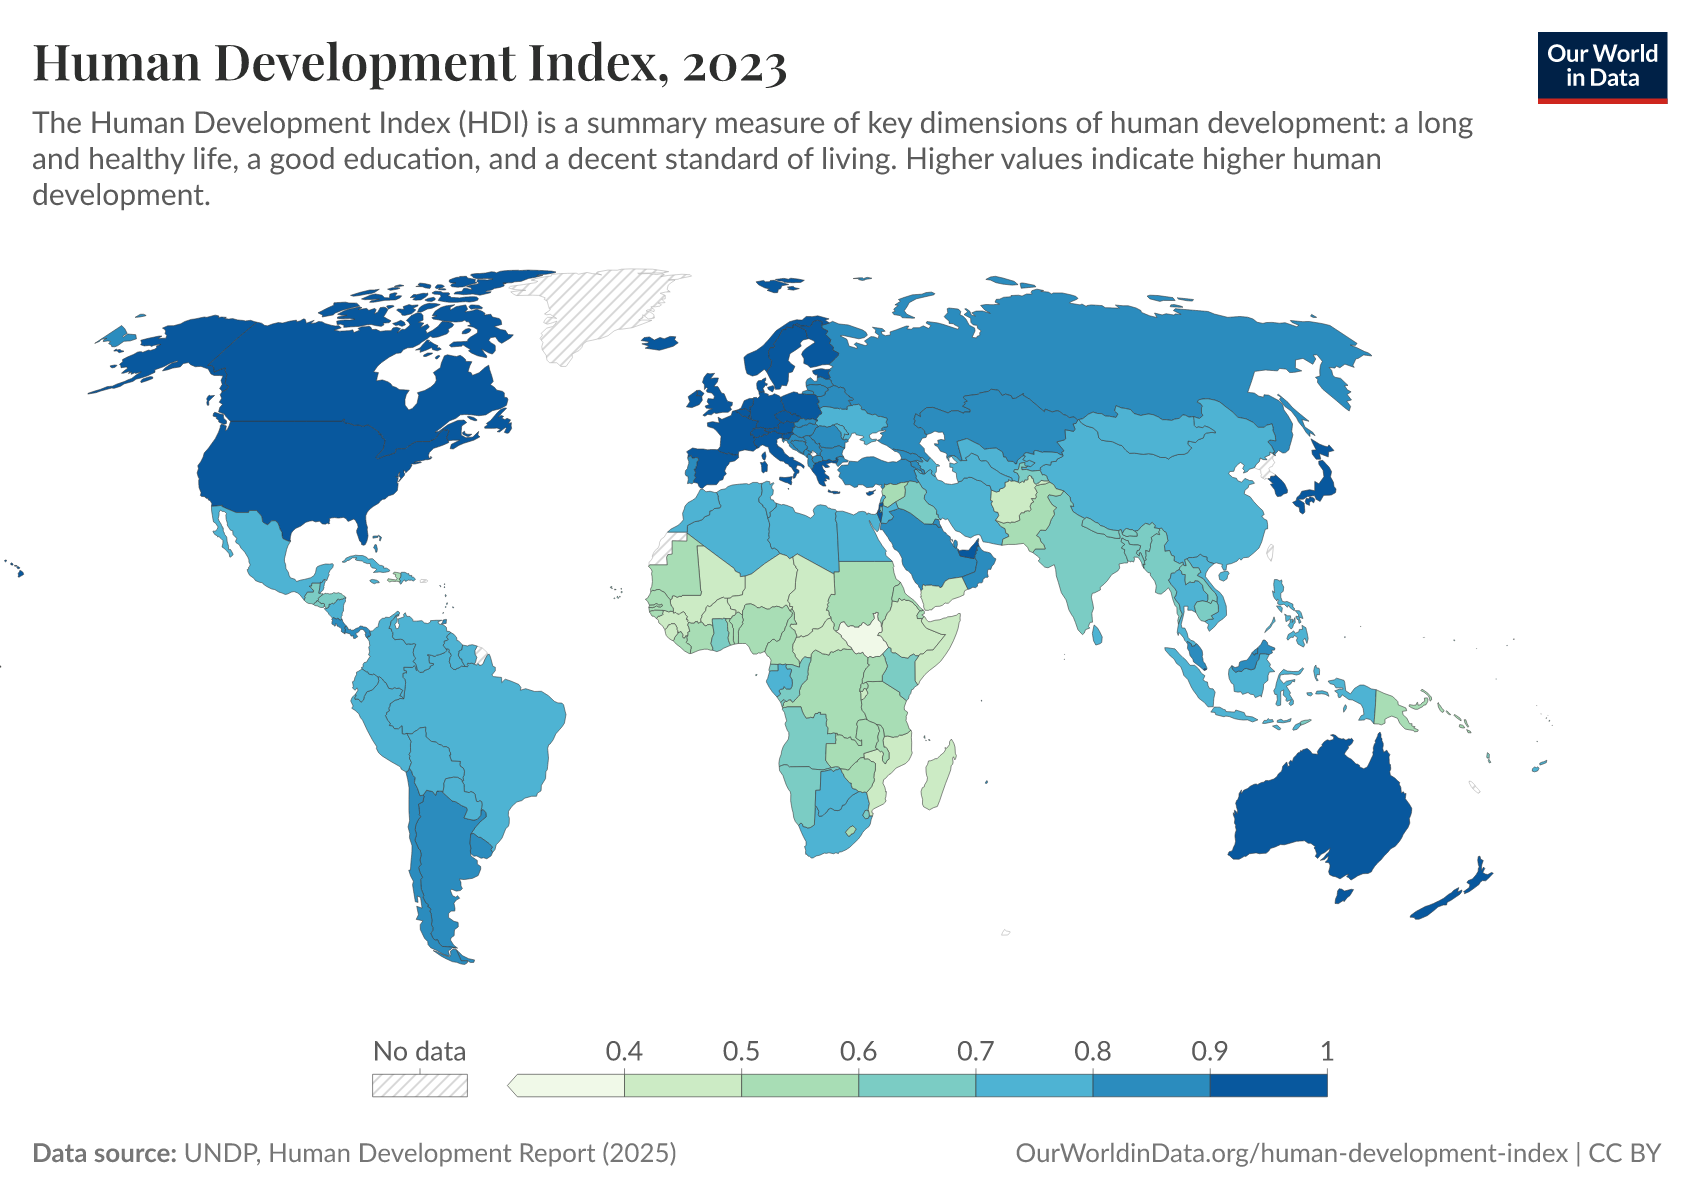
The Human Development Index is published by the United Nations Development Programme (UNDP).2 It is the most well-known index of human development. It is based on the idea that human development means that people have long and healthy lives, are knowledgeable, and have a decent standard of living.
More specifically, these three dimensions are measured with four indicators:
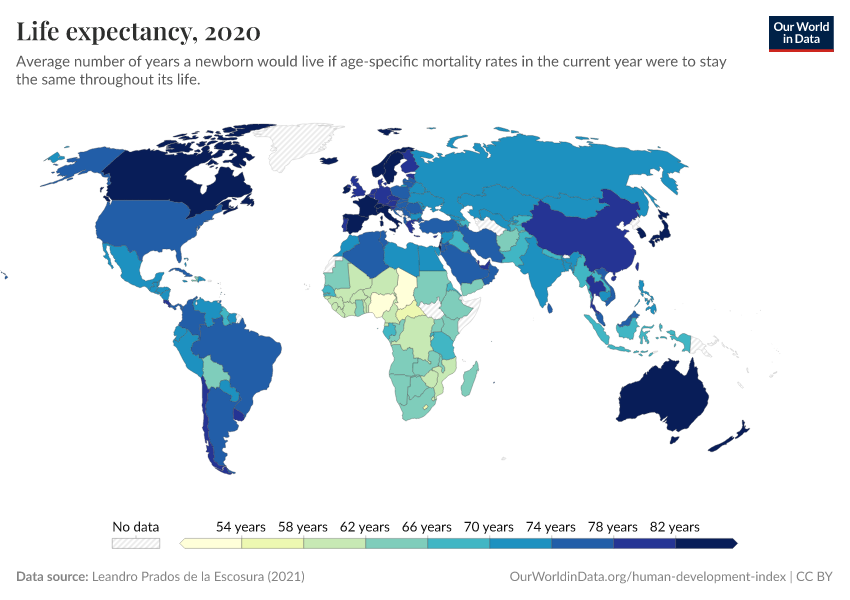
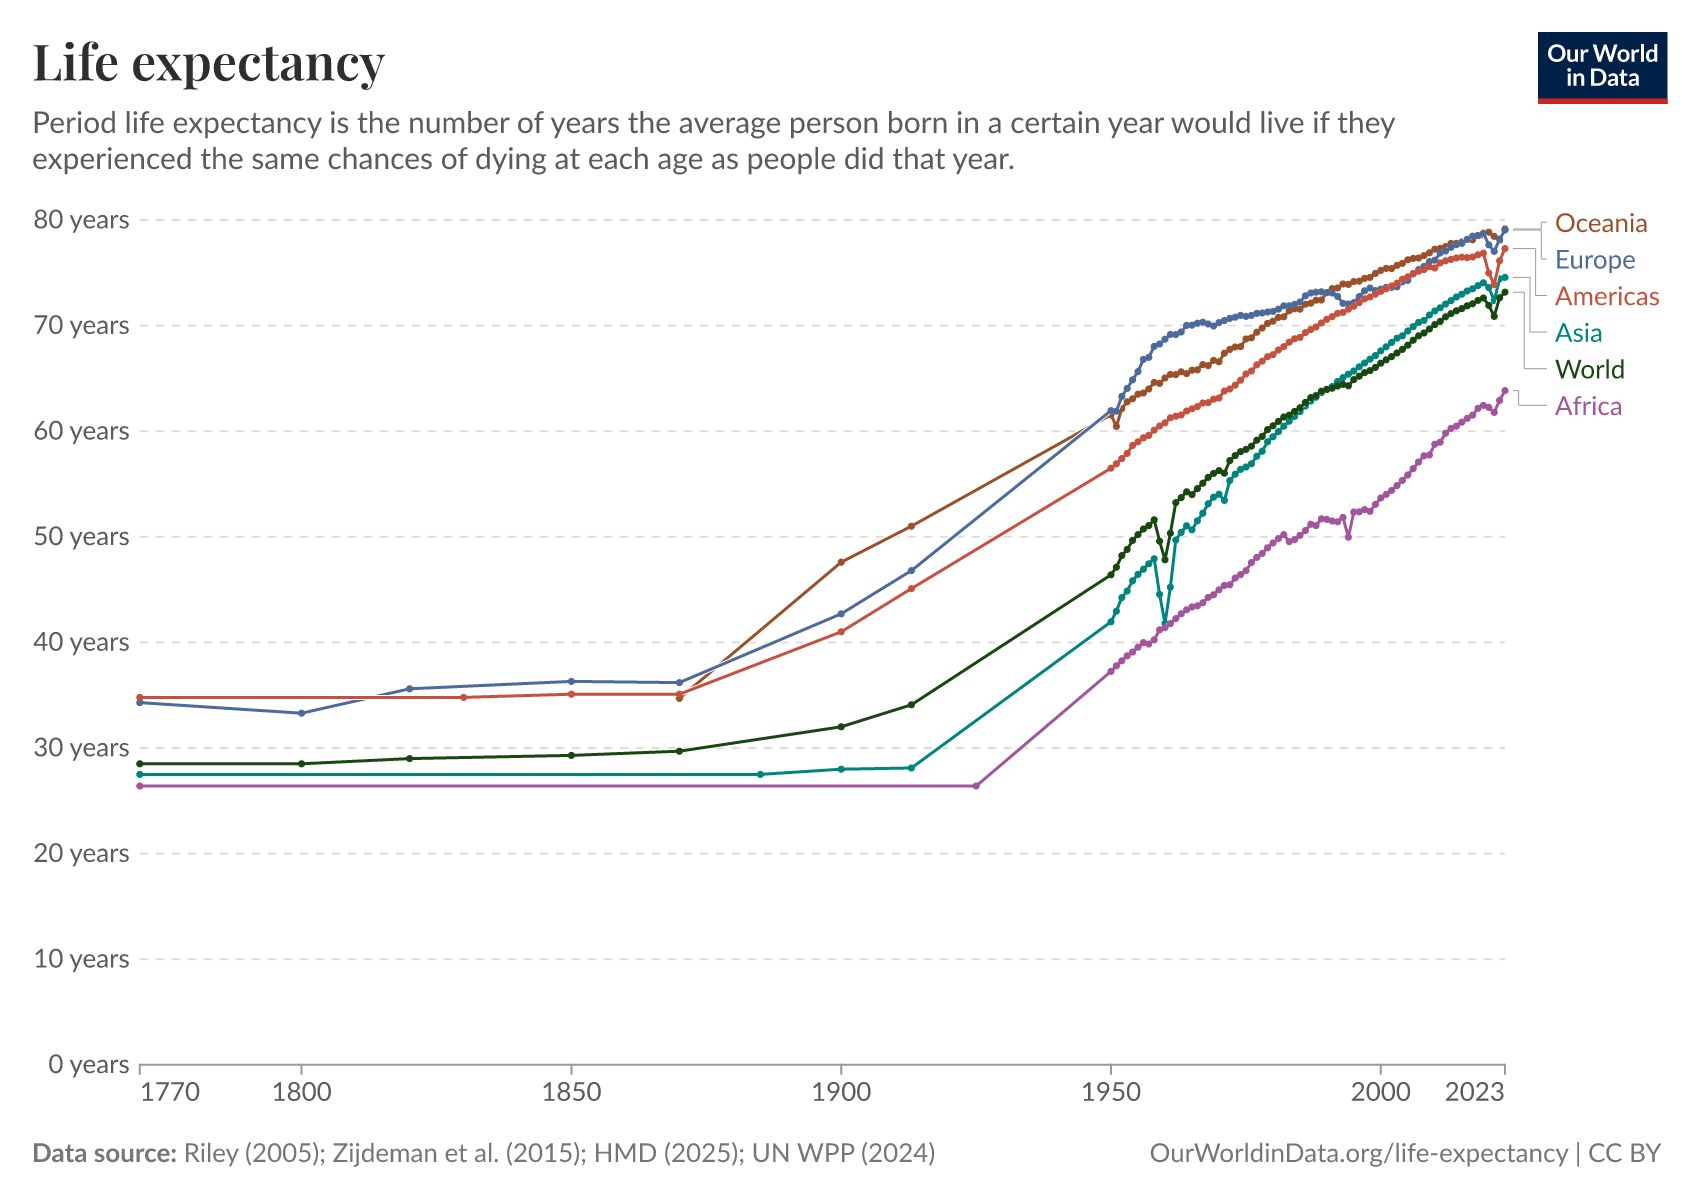
- A long and healthy life: measured by life expectancy at birth
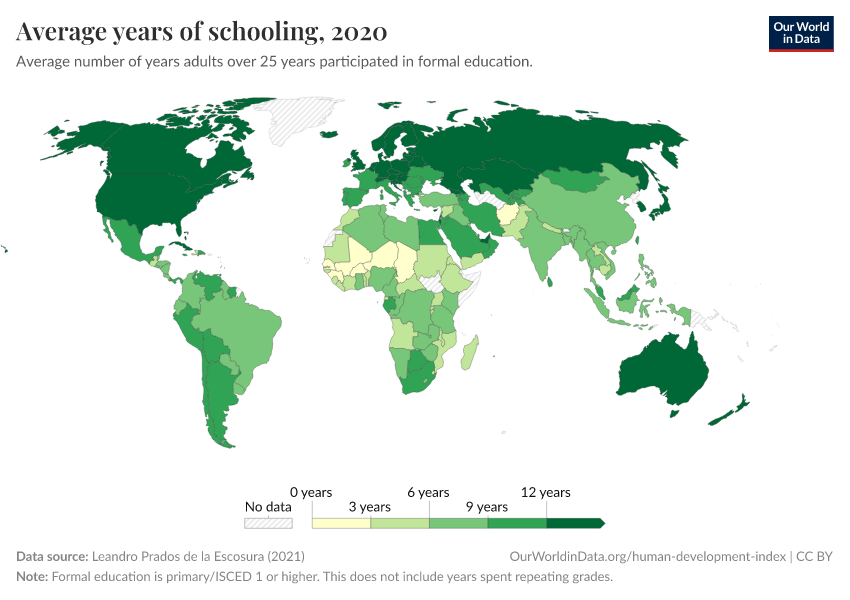
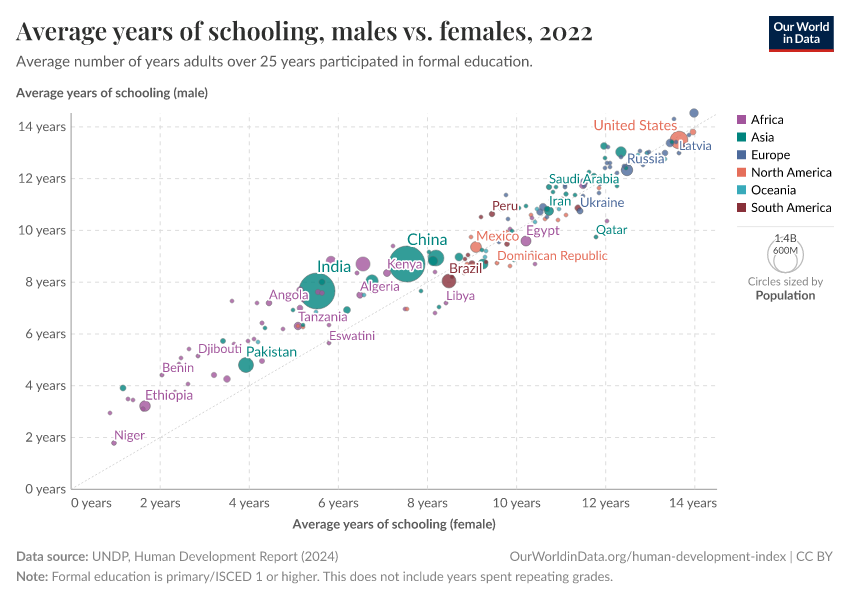
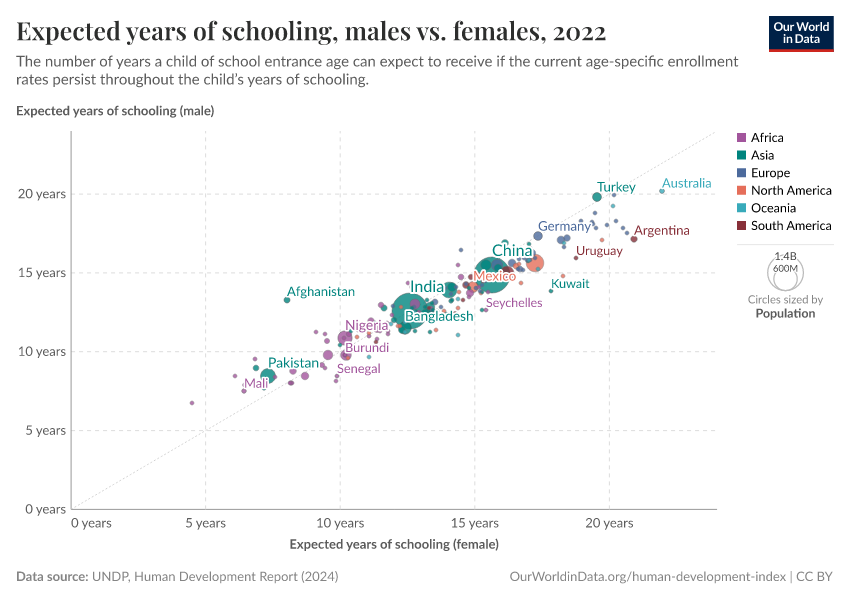
- Knowledge: measured by expected years of schooling (for children of school entering age) and average years of schooling (for adults aged 25 and older)
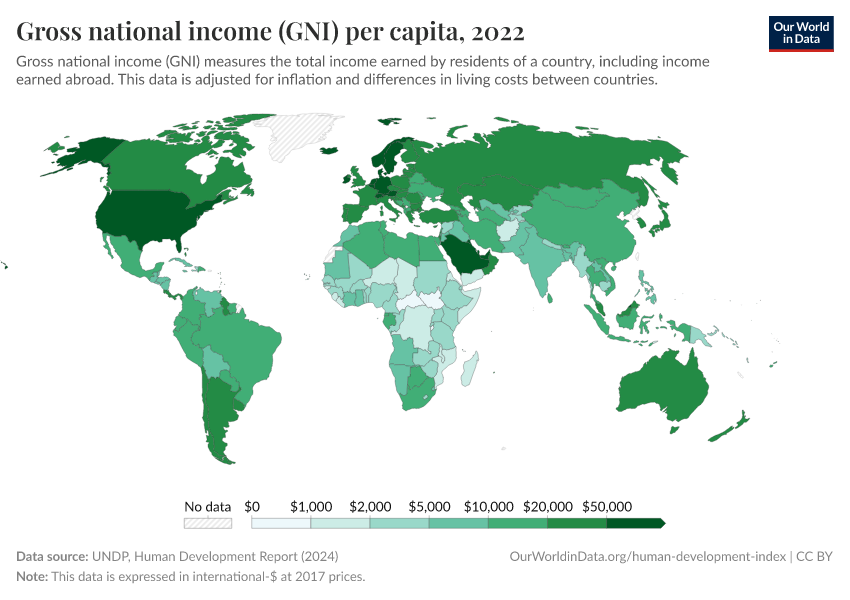
- A decent standard of living: measured by Gross National Income (GNI) per capita
The index is then calculated by normalizing and aggregating these three indicators. First, the indicators are brought onto the same scale, ranging from 0 to 1. This is done by setting minimum and maximum values for each indicator3, and a country at or below the minimum value receiving a score of 0, and a country at or above the maximum value receiving a score of 1.4
Second, the indicators are combined. This is done by calculating the arithmetic mean of the knowledge indicators and then calculating the geometric mean across the three dimensions.5
The resulting HDI scores each country on a spectrum from 0 to 1. It covers almost all countries since 1990.6
In addition to the index itself, it is also used to classify countries into groups depending on their development.
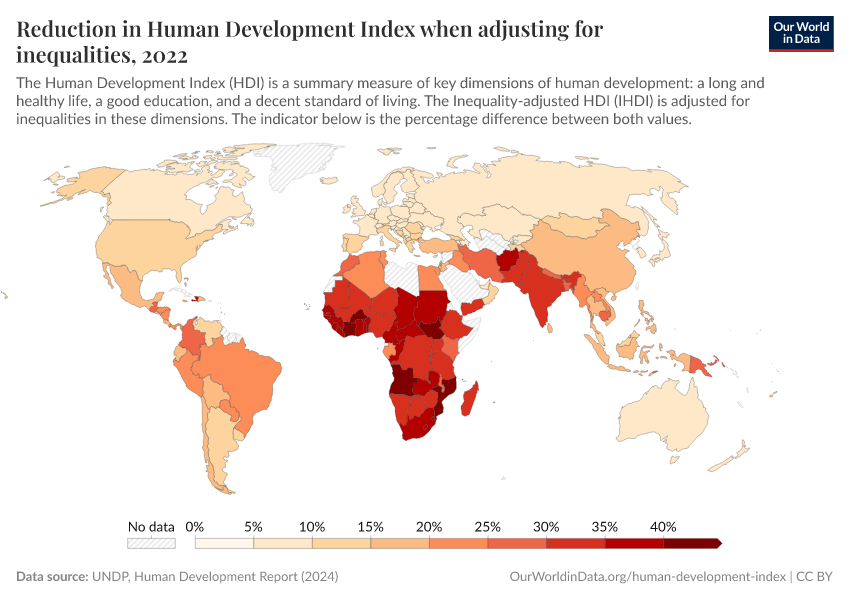
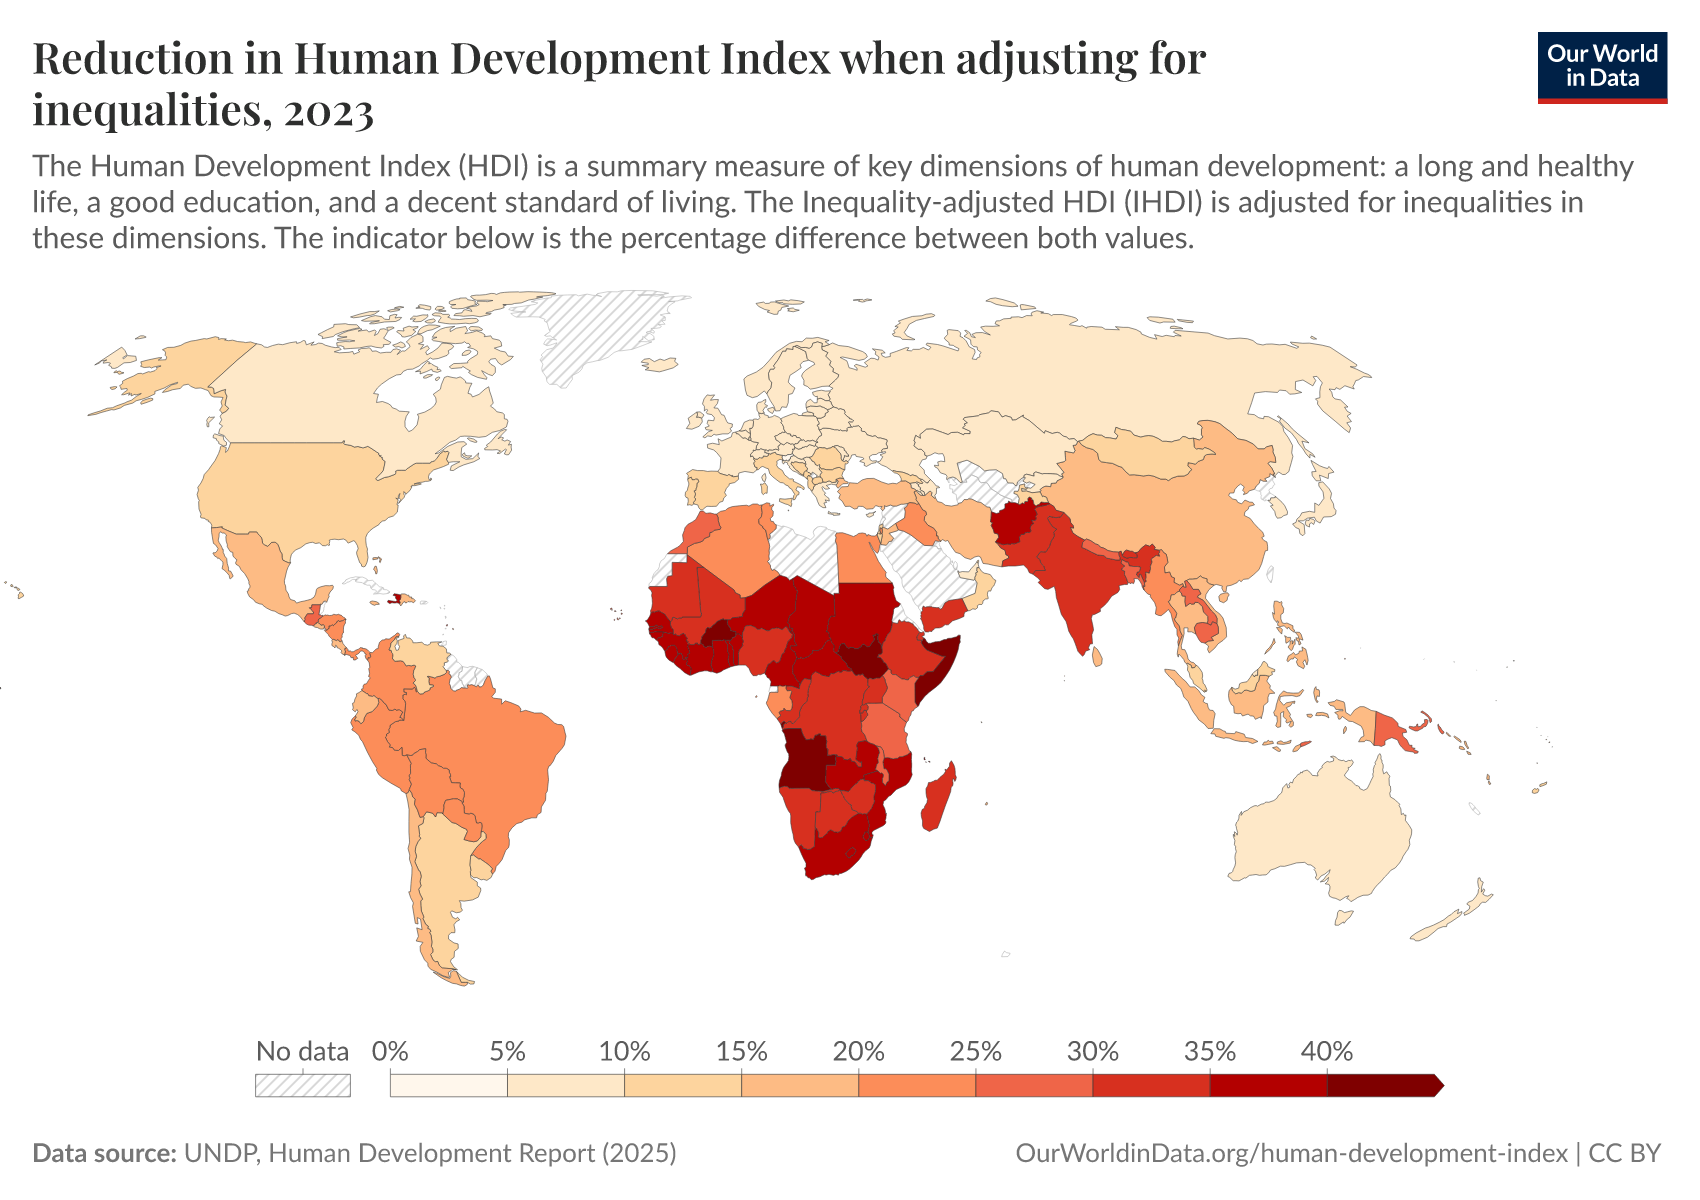
The Inequality-Adjusted Human Development Index (IHDI)
The UNDP also publishes the Inequality-Adjusted Human Development Index (IHDI).7
It uses the same three principles of human development as the HDI: living a long and healthy life, being knowledgeable, and having enough income to maintain a decent standard of living.
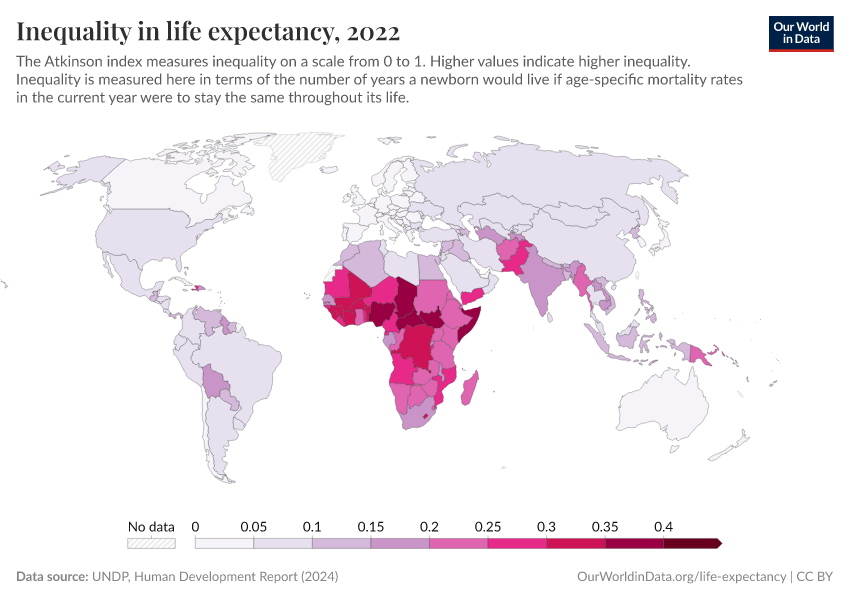
However, the IHDI acknowledges that life expectancy, education, and income differ within countries. It does so by using additional data on inequality within countries in each dimension to discount the HDI’s average values.8
A country’s score on the IHDI therefore is the same as its HDI score if there is no inequality between people. The greater the inequality, the lower the IHDI relative to the HDI.
The IHDI also ranges from 0 to 1 and covers almost all countries since 2010.

The Gender Development Index (GDI)
The UNDP also publishes the Gender Development Index (GDI).9
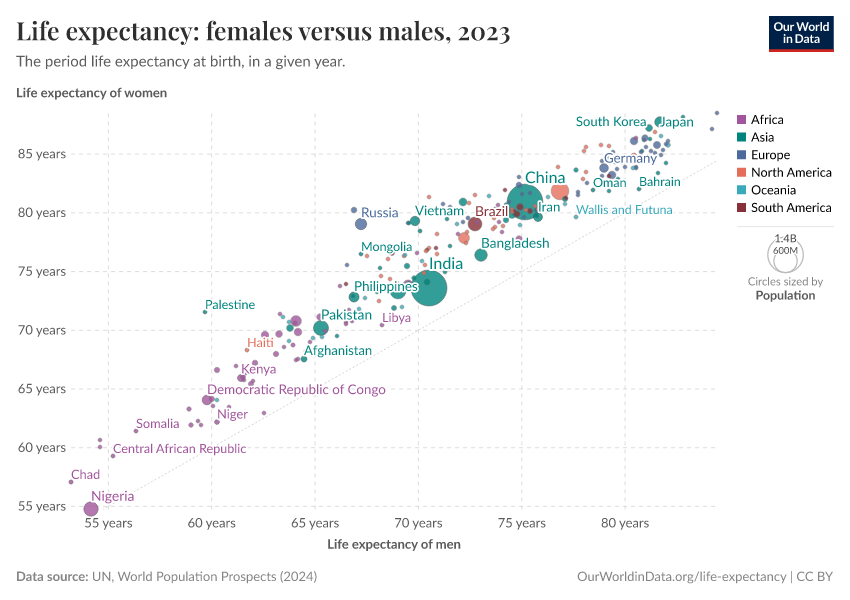
It characterizes human development like the HDI and the IHDI, but it acknowledges that life expectancy, expected and average access to education, and income differ between men and women.
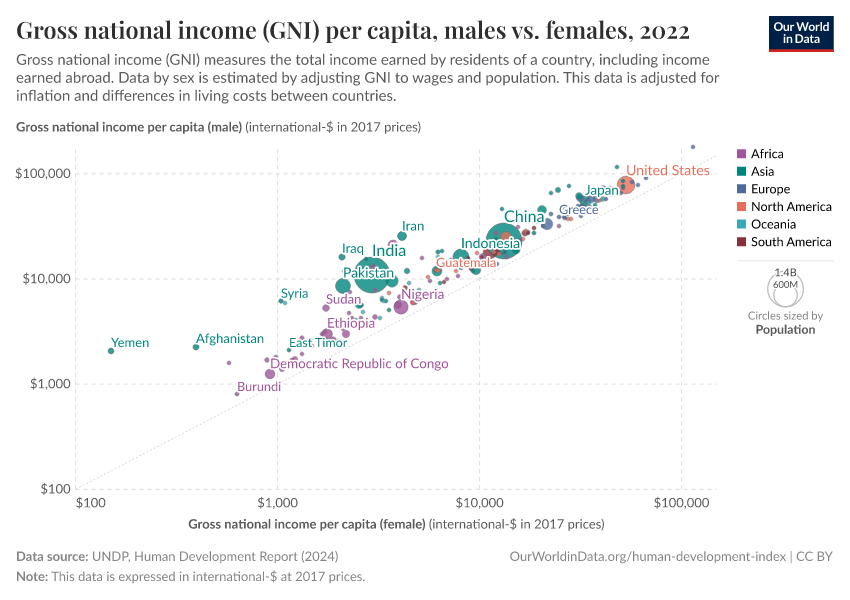
It uses gender-specific data across three dimensions (such as incomes for men and women) to calculate HDIs for men and women separately.10
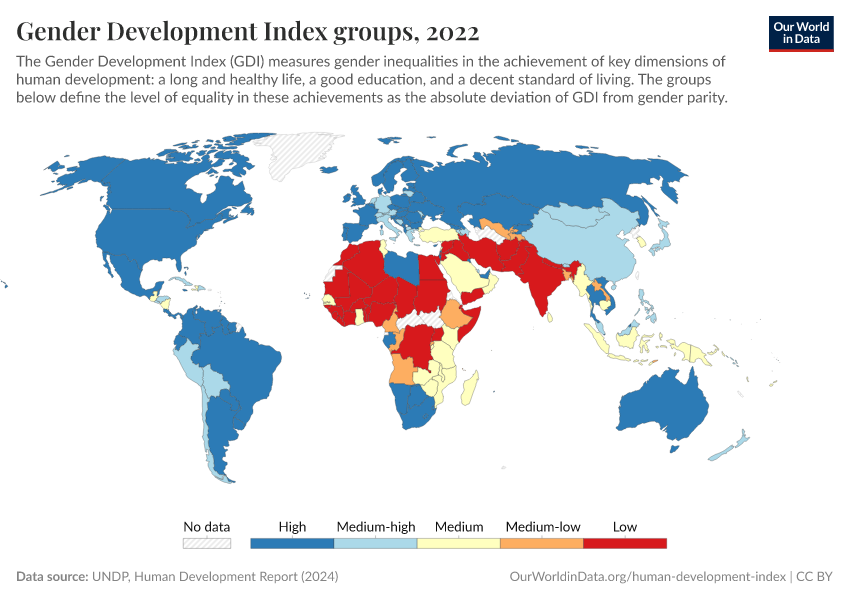
The GDI is the ratio of the female HDI to the male HDI. Values below 1 indicate higher human development for men than women, while values above 1 indicate the opposite. Values closer to 1 therefore indicate higher gender equality.
It covers almost all countries since 1990.
In addition to the index itself, it is also used to classify countries into groups depending on how gender-equal they are.

The Augmented Human Development Index (AHDI)
The Augmented Human Development Index (AHDI) is produced by the economic historian Leandro Prados de la Escosura.11 It gives a more historical perspective on human development by including long-run data.12
Like the HDI, the AHDI characterizes human development as people having long and healthy lives, being knowledgeable, and having a decent standard of living. But AHDI adds a fourth dimension — civil and political freedom — and is based on slightly different indicators:
- A long and healthy life: measured by life expectancy at birth
- Knowledge: measured by average years of primary, secondary, and tertiary schooling (for people aged 15 and older)
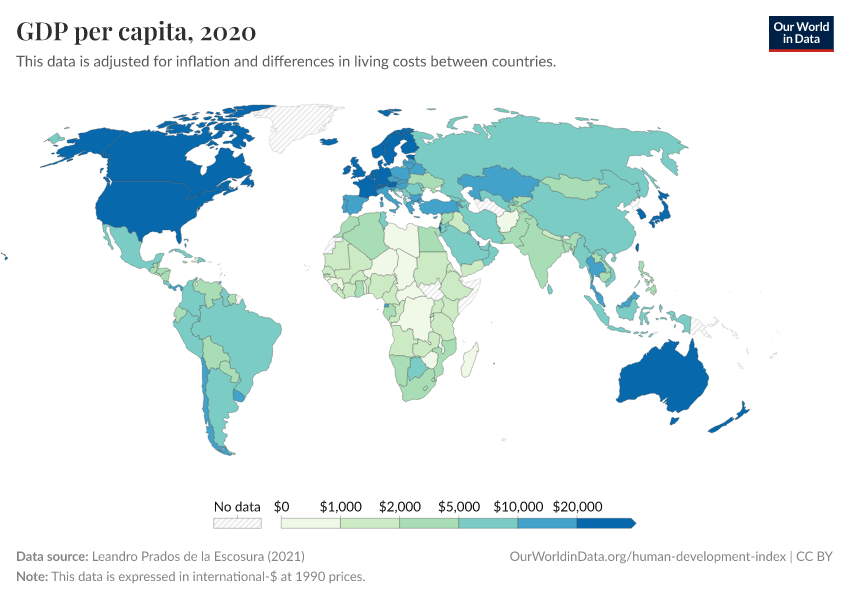
- A decent standard of living: measured by Gross Domestic Product (GDP) per capita
- Civil and political freedom: measured by the Varieties of Democracy’s Liberal Democracy Index
The index is again the result of normalizing and aggregating the specific indicators.13
First, the indicators are brought onto the same scale from 0 to 1. But after setting minimum and maximum values for each indicator14, life expectancy and education are normalized logarithmically.15 This is done because Prados de la Escosura considers development at already high levels a bigger achievement and because he sees these quantitative improvements as associated with higher quality.
Second, the indicators are combined in the same way as the HDI by calculating the geometric mean across the four dimensions.16
The resulting AHDI scores each country on a spectrum from 0 to 1.
It covers most countries since 1870 and almost all since 1950.

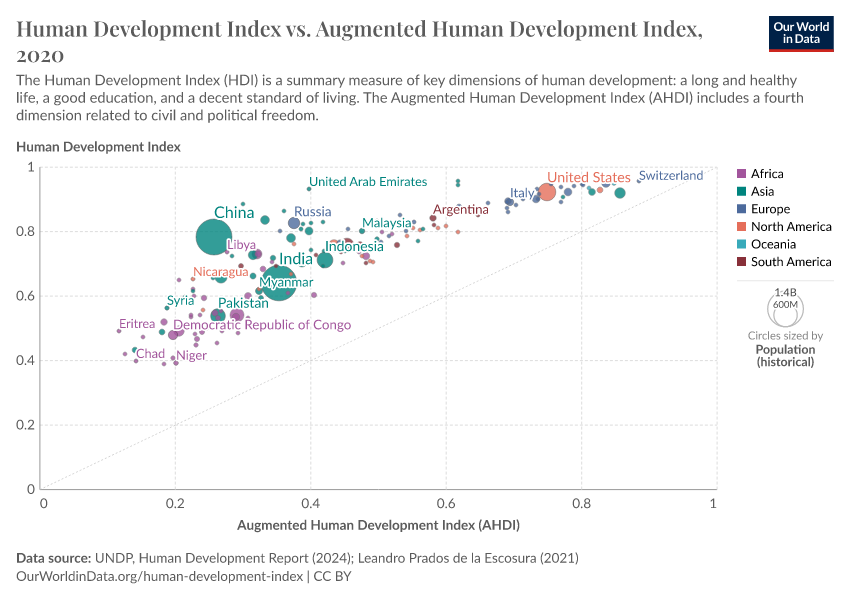
The following chart shows that for the years where they overlap, the HDI and AHDI are closely associated, with countries that score high on one index also scoring high on the other. AHDI tends to give lower scores, though, and the differences are biggest for countries with low scores on both indices.

What can we learn from these indices?
Whether the Human Development Index and related measures are helpful to better understand human development will depend on the questions we want to answer.
If we want a general overview of people’s health, education, and living standards, we can learn much from this data.
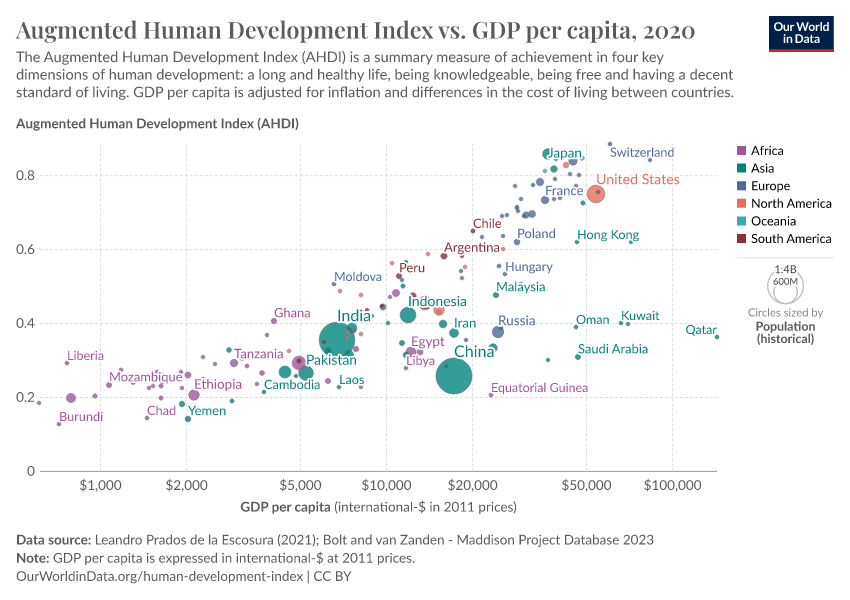
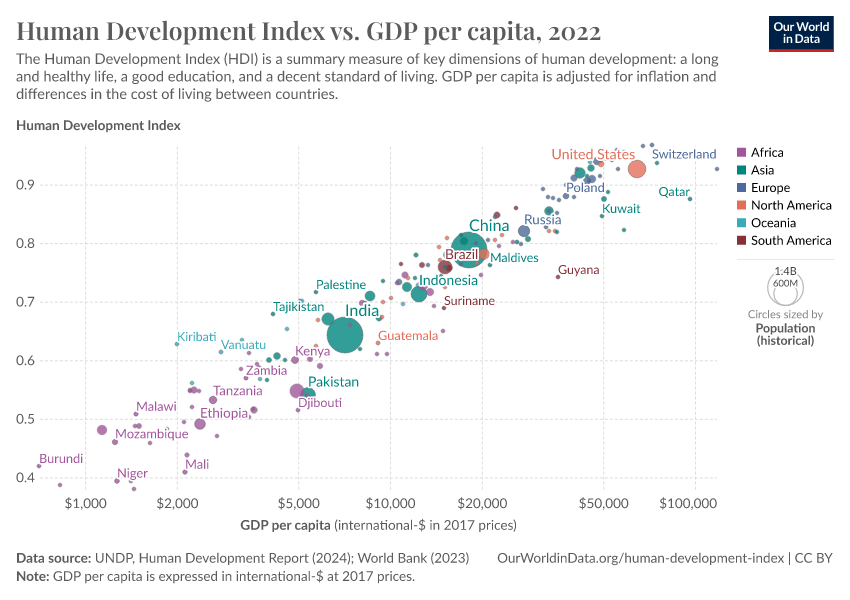
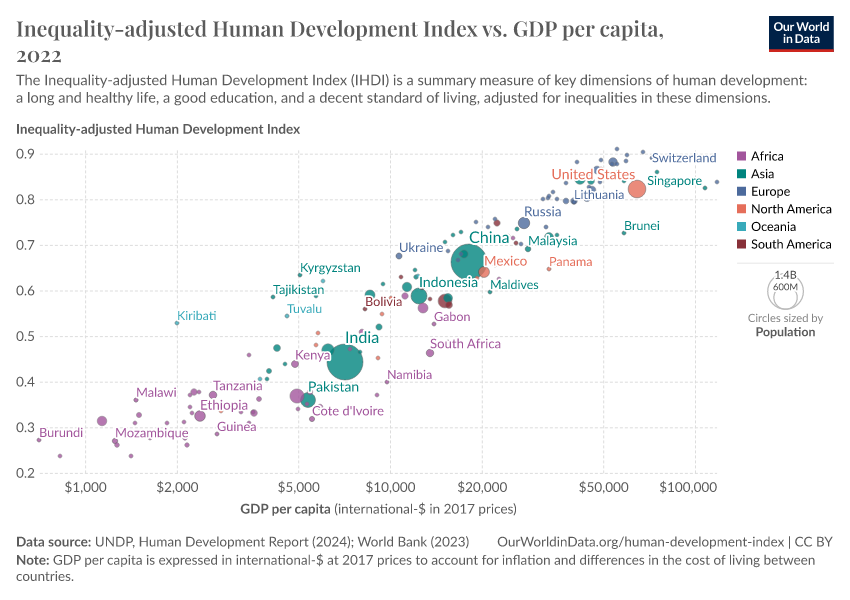
The indices are particularly useful for identifying countries with better or worse human development than we would expect based purely on their level of economic development.
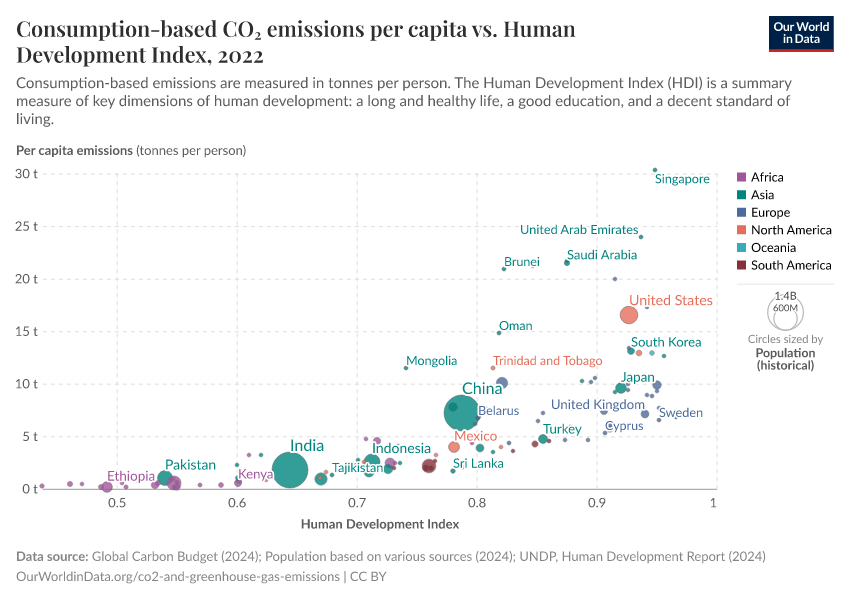
For example, the next chart compares a standard measure of economic development, GDP per capita, to the HDI. Looking for countries far from the diagonal helps us identify those that fare worse than expected based only on their economic development or those that do better than expected.

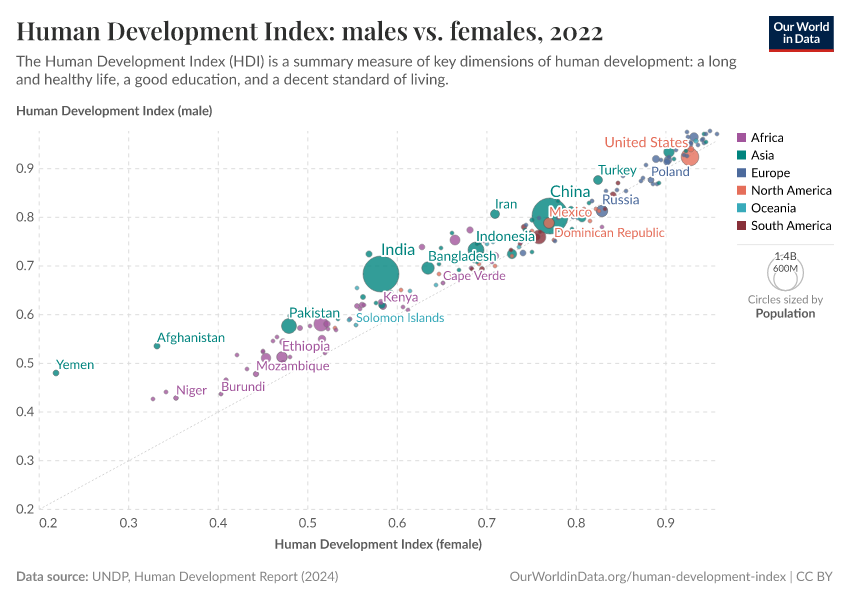
As another example, the following chart compares the HDI to the GDI. We again see that some countries do relatively worse when accounting for gender differences (such as Iran and Pakistan). In contrast, others do relatively better due to more gender-equal outcomes (such as Brazil and the Philippines).

Which specific index we should use depends on the questions we have.
If we are interested in a country’s general human development, we can use the HDI.
If we want to account for inequalities within countries, we should use the IHDI; if we are interested in gender differences specifically, the GDI is best.
And if we are interested in long-term trends and want to consider people’s civil and political freedoms, the AHDI is best.
For these general and specific strengths, we provide the Human Development Index and its related measures on our site.
The indices, however, will not give us a satisfying answer if we are interested in other aspects of human development, such as environmental sustainability or human security. They also will not satisfy us if we are interested in indicators with easy-to-understand scores.
In these cases, it is best to look at more specific indicators.
Key Charts on Human Development Index (HDI)
See all charts on this topic


Featured Data on Human Development Index (HDI)
Keep reading on Our World in Data
Acknowledgments
We thank Saloni Dattani, Joe Hasell, Edouard Mathieu, Hannah Ritchie, and Max Roser for their very helpful comments and ideas about how to improve this article.
Endnotes
The summary and discussion draw on:
Prados de la Escosura, Leandro. 2023. Augmented Human Development Index. Concept, Sources and Procedures.
United Nations Development Programme. 2023. Gender Development Index.
United Nations Development Programme. 2023. Human Development Index (HDI).
United Nations Development Programme. 2023. Inequality-Adjusted Human Development Index (IHDI).
United Nations Development Programme. 2023. Technical notes.
United Nations Development Programme. 2023. Human Development Index (HDI).
The minimum and maximum values are:
- Life expectancy: 20 years minimum, 85 years maximum
- Expected years of schooling: 0 years minimum, 18 years maximum (equivalent to a master’s degree in most countries)
- Mean years of schooling: 0 years minimum, 15 years maximum
- Gross National Income per capita: $100 minimum, $75,000 maximum (in 2017 Purchasing-Power-Parity international-$, logarithmized to reflect that incomes become less important as they increase).
The precise formula is:
Normalized indicator = (actual value – minimum value) / (maximum value – minimum value)
The formula is:
HDI = (Health Index * Education Index * Income Index)^(⅓)
Information from other countries is used to estimate a missing indicator’s values for a few country-years.
United Nations Development Programme. 2023. Inequality-Adjusted Human Development Index (IHDI).
The formula is:
Normalized, inequality-adjusted indicator = Normalized indicator * (1 – geometric mean of the indicator’s distribution / arithmetic mean of its distribution)
United Nations Development Programme. 2023. Gender Development Index.
The UNDP presumes a five-year biological advantage for women and therefore uses different minimum and maximum values:
- Life expectancy for men: 17.5 years minimum, 82.5 years maximum
- Life expectancy for women: 22.5 minimum, 87.5 maximum
The gender gap in life expectancy, however, varies around the world and has changed over time.
Prados de la Escosura, Leandro. 2023. Augmented Human Development Index. Concept, Sources and Procedures.
It replaces the earlier Historical Index of Human Development (HIHD).
It also entails some imputation, as one of the indicators is missing for some country-years. Prados de la Escosura uses information from neighboring countries or similar indicators to estimate the missing values.
The minimum and maximum values are:
- Life expectancy: 20 years minimum, 85 years maximum
- School years: 0 years minimum, 15 years maximum
- Liberal democracy index: 0 minimum, 1 maximum
- Gross Domestic Product per capita: $100 minimum, $47,000 maximum (international-$ at 1990 prices, logarithmized to reflect that additional income becomes less important as it increases).
The precise formula is:
Normalized indicator = (log(maximum value – minimum value) – log(maximum value – actual value)) / log(maximum value – minimum value)
GDP per capita (logarithmized) and the liberal democracy index are still transformed linearly, analogously to HDI’s normalization.
The precise formula is:
AHDI = (Health Index * Education Index * Income Index * Freedom Index)^(¼)
The geometric mean is used such that high scores in one index cannot readily make up for low scores in other dimensions.
Cite this work
Our articles and data visualizations rely on work from many different people and organizations. When citing this article, please also cite the underlying data sources. This article can be cited as:
Bastian Herre and Pablo Arriagada (2023) - “The Human Development Index and related indices: what they are and what we can learn from them” Published online at OurWorldinData.org. Retrieved from: 'https://archive.ourworldindata.org/20260730-020804/human-development-index.html' [Online Resource] (archived on July 30, 2026).BibTeX citation
@article{owid-human-development-index,
    author = {Bastian Herre and Pablo Arriagada},
    title = {The Human Development Index and related indices: what they are and what we can learn from them},
    journal = {Our World in Data},
    year = {2023},
    note = {https://archive.ourworldindata.org/20260730-020804/human-development-index.html}
}
Reuse this work freely
All visualizations, data, and articles produced by Our World in Data are completely open access under the Creative Commons BY license. You have the permission to use, distribute, and reproduce these in any medium, provided the source and authors are credited.
The data produced by third parties and made available by Our World in Data is subject to the license terms from the original third-party authors. We will always indicate the original source of the data in our documentation, so you should always check the license of any such third-party data before use and redistribution.
All of our charts can be embedded in any site.