Population and Demography
This page provides data for Saint Lucia on key population and demographic indicators.
How many people live in the country, and how quickly is the population growing or shrinking? What’s driving that change — births, deaths, or migration? How is the age structure changing?
The data will be updated in line with the United Nations’ latest global and country estimates and projections, which are usually released every two or three years.
Population size and distribution
What is the total population of Saint Lucia?
In 2023, the estimated population of Saint Lucia was 179,300.
In the chart, you can see how the population numbers have changed over the past 70 years. This is shown alongside countries with a similar population today.
What is the population density of Saint Lucia?
Population density is measured by dividing the total population by a country’s area. This is shown in the chart below, compared to the average population density globally, and the average density for countries in the same income group and region.
Saint Lucia’s population density was 291 people/km² in 2023.
What share of Saint Lucia’s population lives in rural areas, towns, and cities?
Where people live within a country — and their movement from rural areas to towns and cities — can have a large impact on culture, where infrastructure is needed, what people do for work, and the structure of the economy.
In the chart, you can see how the share of people in Saint Lucia who live in rural areas, towns, and cities has changed over time.
In 2020, 27.3% of people in Saint Lucia lived in rural areas, with 72.7% living in towns, and 0 in cities.

Births, deaths, and life expectancy
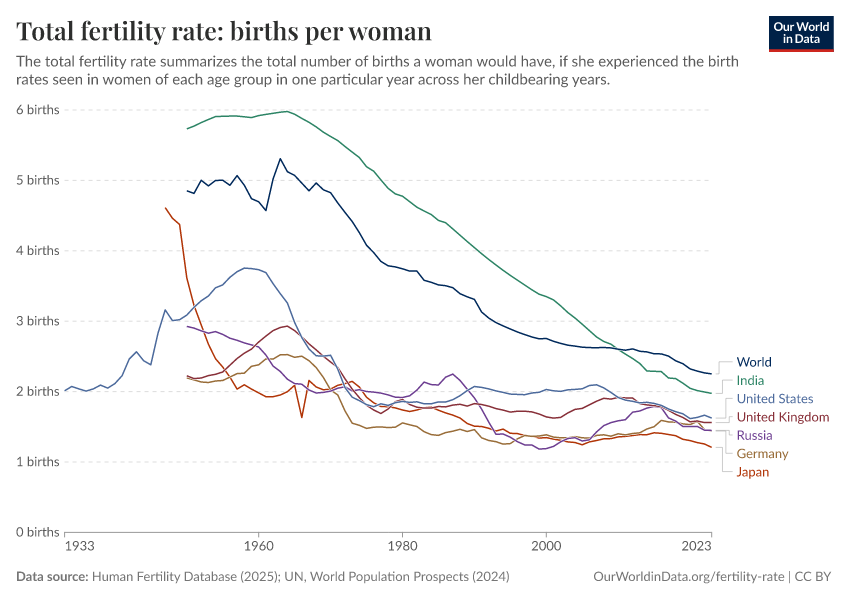
What is Saint Lucia’s total fertility rate?
A key driver of population change is the number of children who are born. One measure of this is the total fertility rate. This tells us how many children the average woman would have over her lifetime, based on age-specific fertility rates observed in a given year.
In 2023, Saint Lucia’s total fertility rate was 1.38 births per woman.
Its fertility rate over time is shown in the chart below, alongside trends for some of its neighbors.

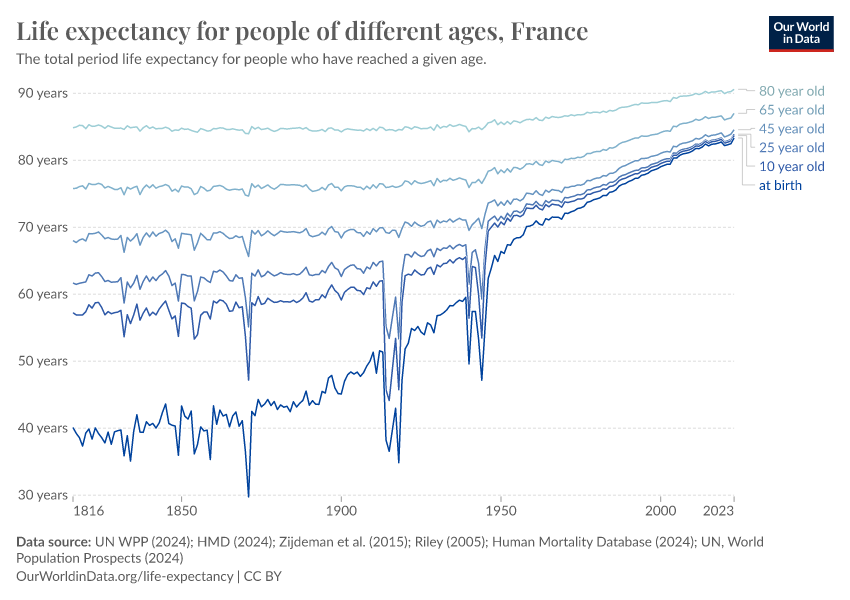
What is Saint Lucia’s life expectancy?
Another key driver of population change is how long people live.
In 2023, Saint Lucia’s life expectancy at birth was 72.7 years.
You can see how this has changed over the last 70 years in the chart, alongside neighboring countries.
This is a period measure of life expectancy, which tells us the average number of years a newborn would live if today’s death rates at each age remained constant throughout their life. This does not necessarily mean this is the most common age of death in the country.

How many people are born and die in Saint Lucia each year?
The balance of these two indicators — fertility rates and life expectancy — is reflected in the number of births and deaths over time.
If more babies are born than people die, the population grows. If births are lower than the number of deaths, the population will naturally shrink. That’s not accounting for migration (which we’ll come to later).
The chart below shows how births and deaths in Saint Lucia have changed over time.
In 2023, 2,019 babies were born, and 1,547 people died.

What share of children in Saint Lucia die before the age of five?
One of the key factors that meant historical populations grew relatively slowly was the very large share of children who died before puberty. For much of human history, half of children did.
Since then, child mortality rates have plummeted across the world. But there are still huge gaps, and more can be done to reduce child deaths even further.
In Saint Lucia, 1.7% of children under the age of five died in 2024.
You can see how this rate has changed over time in the chart, compared to its neighbors.


Migration and population change
What is Saint Lucia’s net migration?
In a country with no migration — where no one is leaving or entering the country — the change in population is simply the balance of births and deaths.
But there are almost no countries where migration is zero.
Net migration is calculated as the number of people who have moved into the country (immigrants) minus the number of people who have left (emigrants). A positive number means more people have moved to the country than have left the country.
In 2023, Saint Lucia’s net migration was 0 people.
What is Saint Lucia’s population growth rate with migration?
Is Saint Lucia’s population growing or shrinking, and how quickly? The population growth rate tells us this.
If the rate is positive, the population is growing. If it’s negative, it’s shrinking.
In 2023, Saint Lucia’s population growth rate was 0.3%, and the chart shows how this has changed over time.
This population growth rate accounts for both natural population growth (the balance of births and deaths) and migration.
How does migration impact Saint Lucia’s population growth?
Many countries have a natural population growth that is quite different from the actual growth rate, which includes migration. Their populations would be shrinking or growing without migration, but with it, their population numbers remain stable or go in the opposite direction.
In the chart, you can see Saint Lucia’s population change with migration, next to a scenario where migration was zero. In this case, population changes would only be determined by births and deaths.
In 2023, its population growth rate was 0.3%, but without migration it would have been 0.3%.

Age structure
What is the median age in Saint Lucia?
Median age is one simple indicator that gives us insight into how old or young a population is. If we lined up everyone in the country from youngest to oldest, the median age would be the age of the person exactly in the middle of that line. Half of the population would be younger, and half would be older.
Countries across Sub-Saharan Africa, South Asia, and South America tend to be younger and therefore have a lower median age than those across Europe, North America, and parts of East Asia.
In 2023, Saint Lucia’s median age was 33.7 years.
This is shown alongside its neighbors in the chart below.
How does Saint Lucia’s population break down by age?
It’s not just the total number of people in a country that drives trends in economic growth, spending, resource allocation, and culture; the age of those people does too.
If a country has many children, the demand for education spending will be high. If it has a large population of older people, this will lead to increased spending on pensions and elderly care.
The chart shows Saint Lucia’s population broken down by age, and how this has changed over time.

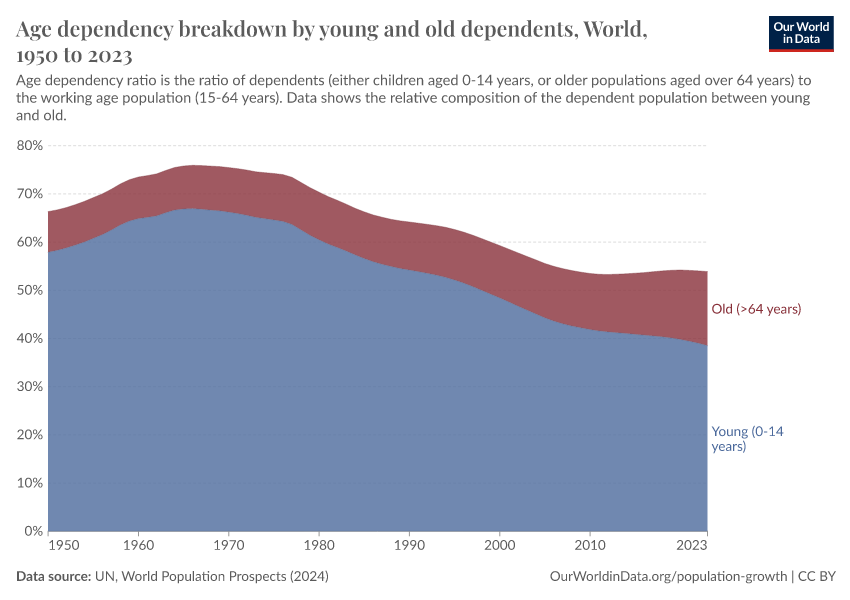
What is Saint Lucia’s age dependency ratio?
A simple way to describe a population’s age structure is the age dependency ratio.
In this measure, people under 15 are counted as dependents because they are generally not doing paid work and are supported through education and family spending. Those aged 65 and over are also considered dependents, as many have left the workforce and rely more on pensions, healthcare, and elderly care.
The total number of these dependents is expressed relative to the working-age population.
Of course, not everyone outside the 15 to 65 range is dependent — some older adults work, and some younger people contribute economically. While being motivated by economic considerations, it is simply a demographic measure that tells us about the balance between these age groups.
Saint Lucia’s age dependency ratio was 37.3 dependents per 100 working age people in 2023. This is compared to neighboring countries in the chart.

Future population
How is Saint Lucia’s population expected to change in the future?
It’s useful to understand how populations might change in the future; this helps us anticipate how demographic dynamics, the economic workforce, and demand for resources and infrastructure could evolve over time.
Population projections rely on assumptions about how key demographic trends will evolve, particularly changes in fertility rates, life expectancy, and migration. That means the outcome is often sensitive to the assumptions made.
One of the most commonly cited projections comes from the United Nations. Alongside its estimates of historical demographic trends, it provides three future scenarios: its medium scenario, plus low- and high-fertility scenarios.
In the chart, you can see its latest medium projection through to the end of the century. In 2023, Saint Lucia’s population was 179,300. By 2100, it is projected to be 108,200.

How will Saint Lucia’s age structure change in the future?
As we covered earlier in this profile, the structure and age distribution of a population can be just as important as the total number of people.
The chart below shows how the population of different age groups is projected to change in Saint Lucia through to the end of the century. Again, this is based on the UN’s medium population scenario.

Population Growth
Explore global and national data on population growth, demography, and how they are changing.

Population & Demography Data Explorer
Explore data from the United Nations World Population Prospects.
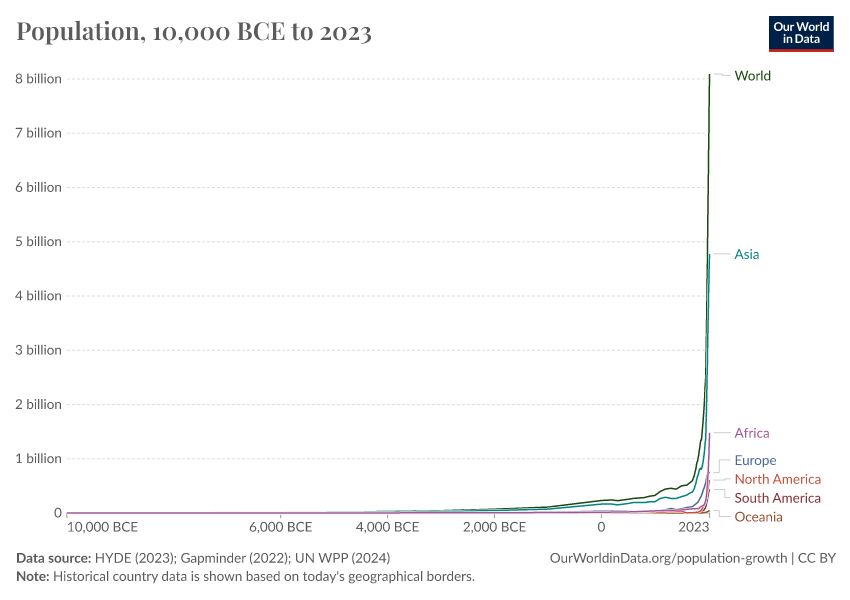
How has world population growth changed over time?
The world population has increased rapidly in recent centuries. But this is slowing.
Cite this work
Our articles and data visualizations rely on work from many different people and organizations. When citing this profile page, please also cite the underlying data sources. This profile page can be cited as:
Hannah Ritchie (2026) - “Population and Demography” Published online at OurWorldinData.org. Retrieved from: 'https://ourworldindata.org/profile/population-demography/saint-lucia' [Online Resource]BibTeX citation
@article{owid-population-demography-saint-lucia,
    author = {Hannah Ritchie},
    title = {Population and Demography},
    journal = {Our World in Data},
    year = {2026},
    note = {https://ourworldindata.org/profile/population-demography/saint-lucia}
}
Reuse this work freely
All visualizations, data, and articles produced by Our World in Data are completely open access under the Creative Commons BY license. You have the permission to use, distribute, and reproduce these in any medium, provided the source and authors are credited.
The data produced by third parties and made available by Our World in Data is subject to the license terms from the original third-party authors. We will always indicate the original source of the data in our documentation, so you should always check the license of any such third-party data before use and redistribution.
All of our charts can be embedded in any site.