Beyond income: understanding poverty through the Multidimensional Poverty Index
The experience of poverty goes beyond a very low income. What is the Multidimensional Poverty Index, and how does it capture the diverse ways people experience deprivation?
In monitoring poverty, the focus is typically on monetary poverty — the extent to which people have very low income or consumption levels. The definition of “extreme poverty” used by the UN and World Bank, living on less than $3 per day, is one prominent example of such a measure.
Measuring poverty in terms of people's income or consumption is valuable. It is a broader measure than many realize. For example, it includes the value of many non-market transactions — such as food grown by subsistence farmers for consumption or cash transfers and gifts in kind from friends and family.1
Income is correlated with other important aspects of well-being, including health, nutrition, education, leisure time, and access to basic facilities like electricity and clean drinking water. A person’s level of income gives us a good indication of the kind of opportunities and living conditions they experience.
However, this correlation is not perfect. People at similar income levels may have very different experiences when it comes to having a basic education, accessing water and electricity, or getting nutritious and regular meals.2 Income alone offers us an incomplete picture of poverty.
For this reason, when trying to understand and monitor poverty, it is important to look beyond income and consumption to other important dimensions in people’s lives.
The Multidimensional Poverty Index: combining multiple indicators into a single measure
Different well-being indicators can move at different speeds or even in different directions. When we consider multiple metrics, comparisons across countries or over time can become more difficult.
This is why researchers and policymakers construct aggregate indicators to combine various dimensions of well-being into a single, comprehensive measure.
One well-known measure is the global Multidimensional Poverty Index (MPI), published by the Oxford Poverty & Human Development Initiative (OPHI) and the Human Development Report Office of the United Nations Development Programme (UNDP). The MPI measures how people experience poverty in key areas of well-being across more than 100 countries. This data focuses on low- and middle-income countries, where acute poverty is more severe and widespread, so it does not include richer countries.
How is multidimensional poverty defined in the MPI?
The MPI is made up of ten indicators grouped into three dimensions: health, education, and living standards.
Similar to traditional measures of monetary poverty, the calculation of the MPI involves setting poverty thresholds and then counting the number of households that fall below these thresholds. This is measured using data drawn from household surveys.3 However, while monetary poverty measures are based on just a single poverty threshold — for example, living on less than $3 per day — the MPI sets a poverty threshold for each of the ten indicators.4
A household falling below the threshold set for the indicator is described as being “deprived” in that measure. For example, a household is deprived in Years of schooling if no member has completed at least six years of schooling. It is considered deprived in the Cooking fuel indicator if the household relies on solid fuel, such as dung, crops, wood, charcoal, or coal, for cooking (since these fuels contribute to indoor air pollution that kills millions every year).
You can see details on the specific thresholds for each indicator in the table below.5
| Dimension | Indicator | Deprived if… |
|---|---|---|
| Health | Nutrition | Any person under 70 years of age for whom there is nutritional information is undernourished |
| Child mortality | A child under 18 has died in the household in the five-year period preceding the survey | |
| Education | Years of schooling | No eligible household member has completed six years of schooling |
| School attendance | Any school-aged child is not attending school up to the age at which he/she would complete class 8 | |
| Living Standards | Cooking fuel | A household cooks using solid fuel, such as dung, agricultural crop, shrubs, wood, charcoal, or coal |
| Sanitation | The household has unimproved or no sanitation facility or it is improved but shared with other households | |
| Drinking water | The household’s source of drinking water is not safe or safe drinking water is a 30-minute or longer walk from home, roundtrip. | |
| Electricity | The household has no electricity | |
| Housing | The household has inadequate housing materials in any of the three components: floor, roof, or walls | |
| Assets | The household does not own more than one of these assets: radio, TV, telephone, computer, animal cart, bicycle, motorbike, or refrigerator, and does not own a car or truck |
To calculate the MPI, researchers first establish whether a household is deprived in each of the ten indicators.
These ten deprivations are then summed up using weights so that the three dimensions — health, education, and living standards — contribute equally to the final score.6
Individuals are classified as living in multidimensional poverty (“MPI-poor”) if their household is deprived in at least one-third of the weighted indicators.7
What measures are available within the Multidimensional Poverty Index dataset?
The MPI dataset provides three different measures of multidimensional poverty.
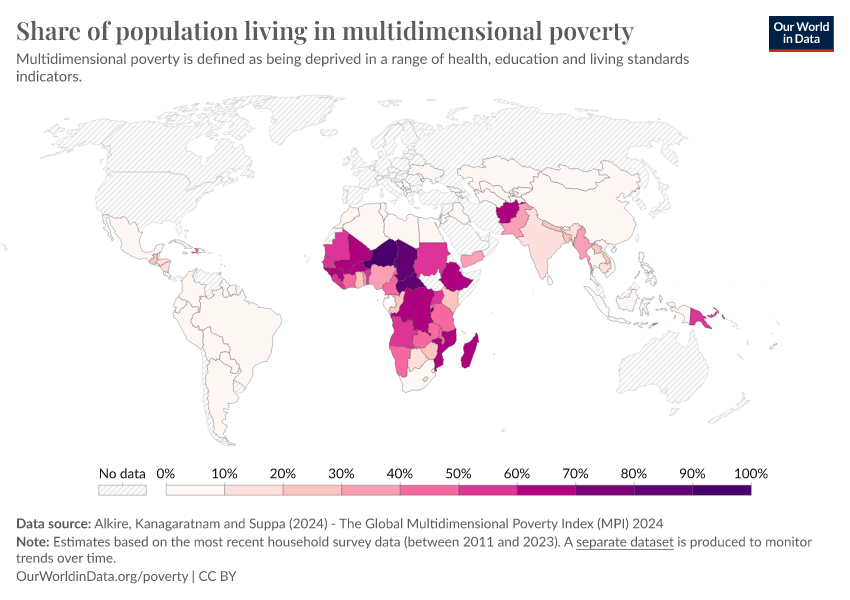
The share of the population in multidimensional poverty
The most straightforward way to measure multidimensional poverty is by looking at the share of the population classified as MPI-poor.
This interactive map shows estimates based on the latest data available for each country. These estimates are based on household surveys, which are not always conducted yearly. You can hover over a country to see the specific year the estimate applies to.
The intensity of multidimensional poverty
Looking solely at the share of the population living in poverty does not capture the intensity of poverty that individuals experience. Two countries might have the same share of people living in poverty, but in one country, those people might be poorer on average than in the other.
The intensity of monetary poverty can be gauged by observing how far below the poverty line people’s incomes fall, as shown in the income gap ratio.
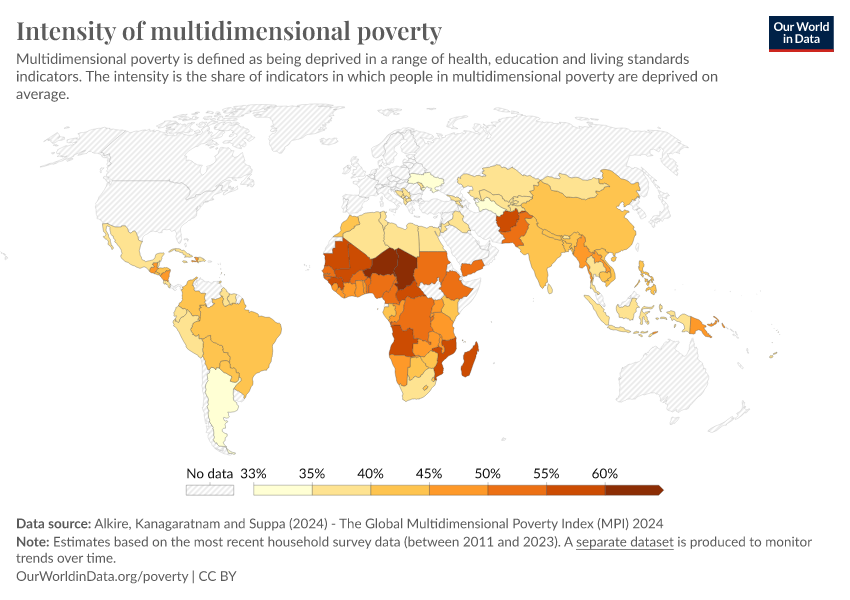
The MPI includes a measure of poverty intensity (sometimes called “breadth of poverty”), reflecting the average share of indicators in which people living in multidimensional poverty experience deprivation.8
The map shows this intensity — the share of indicators in which people living in multidimensional poverty are deprived on average.
For example, a country with a figure of 40% means that in this country, the people who live in multidimensional poverty are deprived, on average, in 40% of the ten indicators included in the MPI.
The measure of intensity can also be used to calculate different indicators, such as the share of the population in severe multidimensional poverty. A person deprived in more than half of the indicators is considered to be in severe poverty, facing greater poverty intensity than someone deprived in one-third of the indicators.
The Multidimensional Poverty Index
Many would agree that the share of people experiencing poverty and the intensity of that poverty are important factors to consider. Poverty becomes worse not only when someone crosses the threshold into poverty but also when a person already living in poverty faces even greater deprivation.
If poverty reduction initiatives focus only on people close to the poverty threshold, they risk overlooking the needs of the very poorest. Therefore, it is important to consider both factors in guiding policy-making.
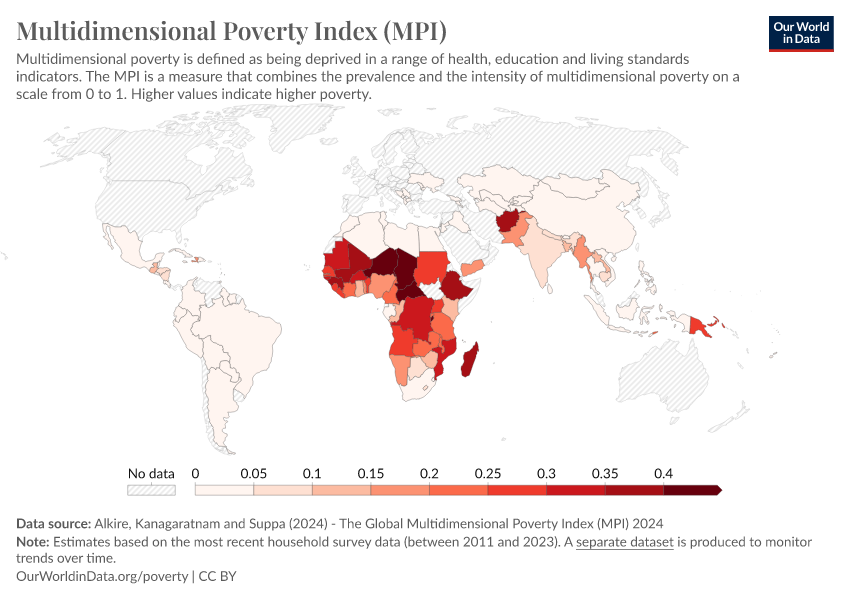
The Multidimensional Poverty Index addresses this by combining information on the share of people in multidimensional poverty with the intensity of their poverty — by multiplying these two measures.9 As a result, MPI values range from 0 to 1, with higher values indicating higher multidimensional poverty.
For example, a country with a share of 65% and an intensity of 40% will have an MPI of 0.65 x 0.40 = 0.26.
In practice, because the share of people in poverty and the intensity of their poverty are closely correlated, the MPI is closely correlated with the share of the population in multidimensional poverty.
Additional measures of multidimensional poverty
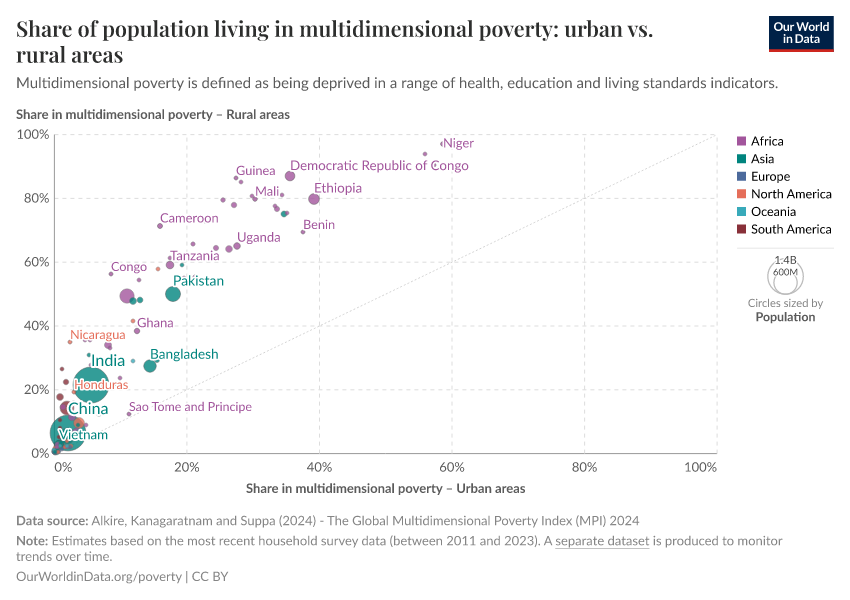
Multidimensional poverty in urban and rural places
The Oxford Poverty & Human Development Initiative breaks down all the MPI measures into rural and urban areas.
The chart shows that the share of people living in multidimensional poverty is higher in rural areas than in urban areas, but the extent of this gap varies considerably across countries.
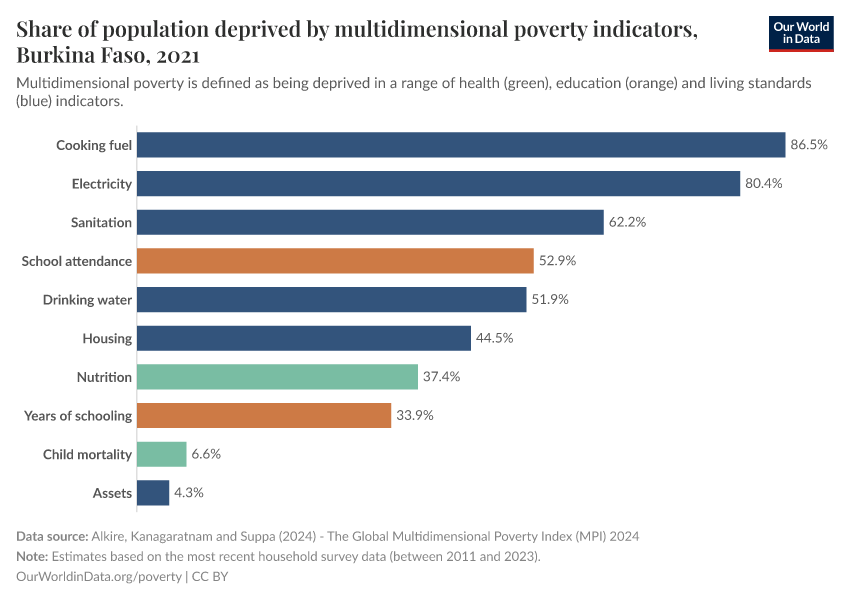
Share of the population deprived by individual indicators of multidimensional poverty
For each country, it is possible to examine the share of people living in households classified as deprived according to the various well-being indicators included in the Multidimensional Poverty Index. The chart shows this for Burkina Faso, but you can switch the interactive chart to many other countries.
Being deprived in a single indicator does not indicate that a household is multidimensionally poor under the MPI definition, but it highlights an area where they face hardship.
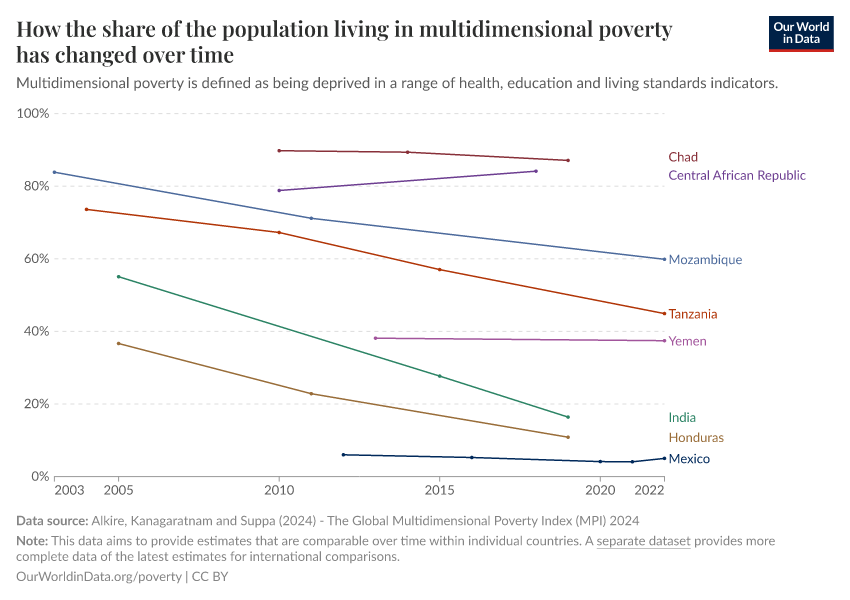
Tracking changes in multidimensional poverty over time
All the measures shown above reflect the current state of multidimensional poverty based on each country's most recent available data.
Household surveys evolve over time, with indicators being added or removed. Such changes can make successive “current” estimates based on different indicators difficult to compare across time.
To address this, OPHI provides “harmonized over time” measures of multidimensional poverty. These harmonized measures include only the indicators available in every survey, enabling more reliable comparisons over time within the same country.
While the harmonized measures may not capture the whole picture of multidimensional poverty today, they offer a clear view of how it has changed over time.
The chart shows the harmonized-over-time estimates of the share of the population in multidimensional poverty.
We have also produced charts of the harmonized data for:
Does multidimensional poverty mirror monetary poverty?
Given the MPI's goal to capture the diverse ways people experience deprivation beyond monetary poverty, how much does the MPI align with traditional measures of income?
To look at this, we compare OPHI’s estimates of multidimensional poverty with the World Bank’s estimates of extreme poverty, defined as living on less than $3 per day.
The chart below displays estimates of the share of the population in MPI poverty and extreme poverty based on each country's latest survey data.
It shows a positive relationship: countries with more people living in extreme monetary poverty usually also have a large share of people in multidimensional poverty.
You can see the relationship more clearly for countries with lower poverty levels by selecting logarithmic axes in the chart settings or using a higher monetary poverty line.
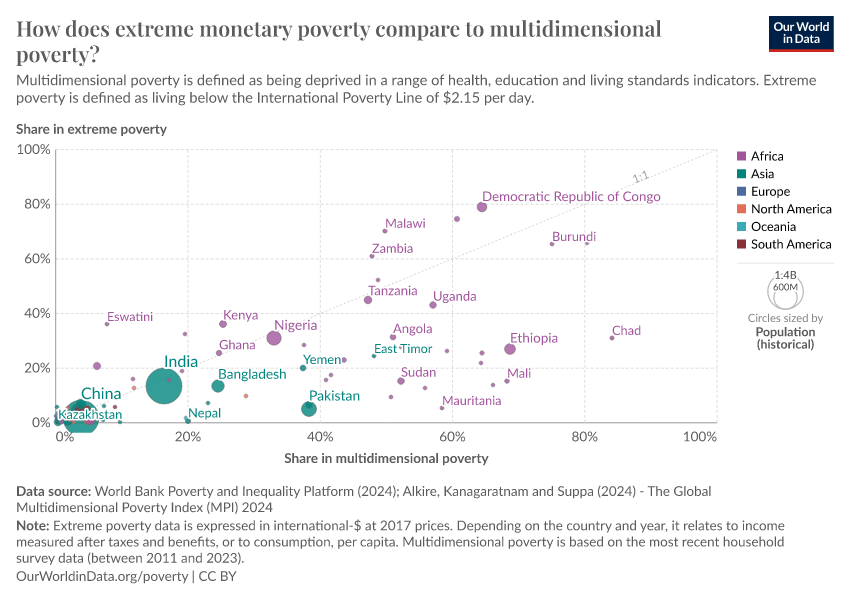
The data makes clear that the two poverty measures are far from identical. For example, Lesotho and Chad have very similar rates of extreme monetary poverty but very different rates of multidimensional poverty. The opposite happens in Senegal and Malawi. In both countries, around half of the population is in multidimensional poverty. Still, their estimates of monetary poverty paint a very different picture.
These differences come down to things like access to essential services, such as healthcare and education, or how well income translates into good outcomes, such as adequate nutrition.10
When we look at changes over time, we usually see that monetary and multidimensional poverty move in the same direction and have fallen in most countries in recent years.11 But there are exceptions. In some countries like Zimbabwe and Gambia, the two measures show different trends over time — with falling multidimensional poverty but increasing extreme monetary poverty.
What can we learn from multidimensional poverty measures?
We have seen that multidimensional poverty is correlated with the more commonly used monetary measure of extreme poverty, but not perfectly.
This relationship gives us important insights into the nature of poverty. Extremely low incomes go hand-in-hand with many other forms of deprivation: poorer health, less access to education, and fewer basic facilities. Tracking multidimensional poverty alongside monetary poverty can help us better understand the reality of life on an extremely low income.
Estimates of monetary and multidimensional poverty can also broaden our understanding of poverty in many ways. Tracking both measures gives us a more complete picture of poverty, as the broader MPI definition captures people who might not fall below the extreme poverty line but who still experience severe deprivation in other areas.12
Examining disparities between different poverty measures and looking at the subcomponents of multidimensional poverty can help uncover underlying causes and identify opportunities for more integrated and impactful poverty reduction programs.13
Multidimensional poverty measures can also help governments monitor progress in essential services, such as healthcare or education, which may not be visible through measures of people’s income or consumption.
Finally, the two types of poverty estimates can serve as a sense-check on each other. This is valuable given the many steps in producing these estimates from often imperfect underlying data. For example, the MPI is used by the World Bank as a benchmark to cross-check the adjustments it makes to account for differences in the cost of living across countries in its monetary poverty estimates.14
Other sources of data on multidimensional poverty
The MPI data produced by OPHI is the best-known multidimensional poverty index. It is included in the UN’s annual Human Development Report.
The principle of combining various well-being indicators into a single multidimensional measure of poverty is also used by other research teams.
Another global data source on multidimensional poverty is the “Multidimensional Poverty Measure” (MPM) produced by the World Bank. This measure is heavily influenced by the MPI produced by OPHI. However, unlike the MPI, the MPM includes the World Bank’s monetary definition of extreme poverty as one of its dimensions. You can find and explore this data on the World Bank’s website.
Many countries have adopted national multidimensional poverty measures as a regular part of their approach to monitoring poverty. The Multidimensional Poverty Peer Network provides a list of these countries and the latest national estimates.
Acknowledgments
Thanks to Edouard Mathieu, Max Roser, Hannah Ritchie, Nicolai Suppa, and Usha Kanagaratnam for their feedback on this article and help with the underlying data.
Continue reading on Our World in Data
Endnotes
Such household income or consumption data relies on national household surveys. Exactly what gets counted as income or consumption varies across surveys. The World Bank provides a detailed discussion of this issue on the methodology page accompanying its poverty and inequality data.
For example, in this article on maternal health, we identify some “exemplar” countries – places where fewer women die from pregnancy-related causes compared to countries with a similar income level.
The MPI is constructed from data obtained from the Demographic and Health Survey (DHS), the Multiple Indicators Cluster Survey (MICS), and national surveys where recent data is unavailable from those two sources.
You can read more about the methodology used in the MPI in the book Multidimensional poverty measurement and analysis by Alkire et al. (2015).
You can find more information about how each threshold is defined in the OPHI MPI methodological note by Alkire, Kanagaratnam, and Suppa (2024), page 3, available online.
When adding up the number of indicators in which a household is deprived, some count for more than others. Each indicator within ”health” and ”education” is given a weight of 1/6, while the indicators within “living standards” are given a weight of 1/18 each. This structure ensures that the three dimensions are equally weighted, and each indicator within a dimension is also equally weighted. In the book Multidimensional poverty measurement and analysis (chapter 6), the authors discuss the decisions behind indicators’ weights and the cutoff for multidimensional poverty in more detail.
Note that the assessment of poverty is made at the household level. MPI indicators, however, count individuals (both adults and children of any age). Everyone in the same household is classified as having the same poverty status. This is also a common approach to measuring extreme monetary poverty, but it overlooks the different experiences that can exist within households, for example, between boys and girls. This is often difficult to measure, given the available survey data.
The calculation uses the same weights as those used to define if a household is MPI-poor.
In monetary poverty, a similar estimate is also calculated, known as the poverty gap index.
A more detailed comparison of MPI and monetary poverty measures can be found in the paper by Evans et al. (2023).
Evans, M., Nogales, R., & Robson, M. (2024). Monetary and Multidimensional Poverty: Correlation, Mismatches, and a Combined Approach. The Journal of Development Studies, 60(1), 147-170.
For an analysis of different poverty measures over time, see the working paper by Alkire et al. (2020).
Alkire, S., F. Kovesdi, M. Pinilla-Roncancio and S. Scharlin-Pettee. (2020). Changes over time in the global Multidimensional Poverty Index and other measures: Towards national poverty reports, OPHI Research in Progress 57a, Oxford Poverty and Human Development Initiative, University of Oxford.
Because the OPHI estimates of multidimensional poverty and World Bank estimates of extreme monetary poverty draw on different household survey data, it is not possible to directly compare whether individual households are classified as poor in each case.
Other sources, however, do allow for such a household-level comparison. For example, the World Bank produces multidimensional poverty estimates that combine monetary and non-monetary dimensions from the same survey data. You can explore that data on the World Bank’s website, including how monetary and non-monetary dimensions of poverty overlap.
For example, Bader et al. (2016) conducted such an investigation for one particular country, Laos, through a detailed analysis of how monetary and multidimensional poverty overlap among households. Another study by Alkire et al. (2021) has investigated a similar question for India. Roelen et al. (2012) use a similar approach to investigate the drivers of child poverty in Vietnam.
By focusing on specific dimensions included in the MPI, like health for example, researchers can identify which countries are most successful in protecting the health of their populations, study why they are successful, and present that information as clearly as possible so that others can learn what works, adapting to different circumstances. This is the idea behind the innovative research platform Exemplars in Global Health.
Our World in Data contributed to this research effort, including the post by our colleague Hannah Ritchie, Which countries are most successful in preventing maternal deaths?
Bader, C., Bieri, S., Wiesmann, U., & Heinimann, A. (2016). Differences between monetary and multidimensional poverty in the Lao PDR: Implications for targeting of poverty reduction policies and interventions. Poverty & Public Policy, 8(2), 171-197.
Alkire, S., Oldiges, C., & Kanagaratnam, U. (2021). Examining multidimensional poverty reduction in India 2005/6–2015/16: Insights and oversights of the headcount ratio. World Development, 142, 105454.
Roelen, K., Gassmann, F., & de Neubourg, C. (2012). False positives or hidden dimensions: what can monetary and multidimensional measurement tell us about child poverty in Vietnam?. International Journal of Social Welfare, 21(4), 393-407.
As described in the paper by Joliffe et al. (2022), introducing the World Bank’s updated International Poverty Line of $2.15 per day.
Jolliffe, D. M., Atamanov, A., Lakner, C., Mahler, D. G., & Baah, S. K. T. (2022). Assessing the impact of the 2017 PPPs on the international poverty line and global poverty. Washington, DC: World Bank.
Cite this work
Our articles and data visualizations rely on work from many different people and organizations. When citing this article, please also cite the underlying data sources. This article can be cited as:
Joe Hasell, Pablo Arriagada, and Bertha Rohenkohl (2024) - “Beyond income: understanding poverty through the Multidimensional Poverty Index” Published online at OurWorldinData.org. Retrieved from: 'https://archive.ourworldindata.org/20260127-114142/multidimensional-poverty-index.html' [Online Resource] (archived on January 27, 2026).BibTeX citation
@article{owid-multidimensional-poverty-index,
    author = {Joe Hasell and Pablo Arriagada and Bertha Rohenkohl},
    title = {Beyond income: understanding poverty through the Multidimensional Poverty Index},
    journal = {Our World in Data},
    year = {2024},
    note = {https://archive.ourworldindata.org/20260127-114142/multidimensional-poverty-index.html}
}
Reuse this work freely
All visualizations, data, and code produced by Our World in Data are completely open access under the Creative Commons BY license. You have the permission to use, distribute, and reproduce these in any medium, provided the source and authors are credited.
The data produced by third parties and made available by Our World in Data is subject to the license terms from the original third-party authors. We will always indicate the original source of the data in our documentation, so you should always check the license of any such third-party data before use and redistribution.
All of our charts can be embedded in any site.
