Influenza
Seasonal flu is a contagious illness caused by the influenza virus. It kills an average of 700,000 people each year from respiratory disease or cardiovascular disease.1 In large pandemics, when new strains have evolved, the death toll has been much higher.
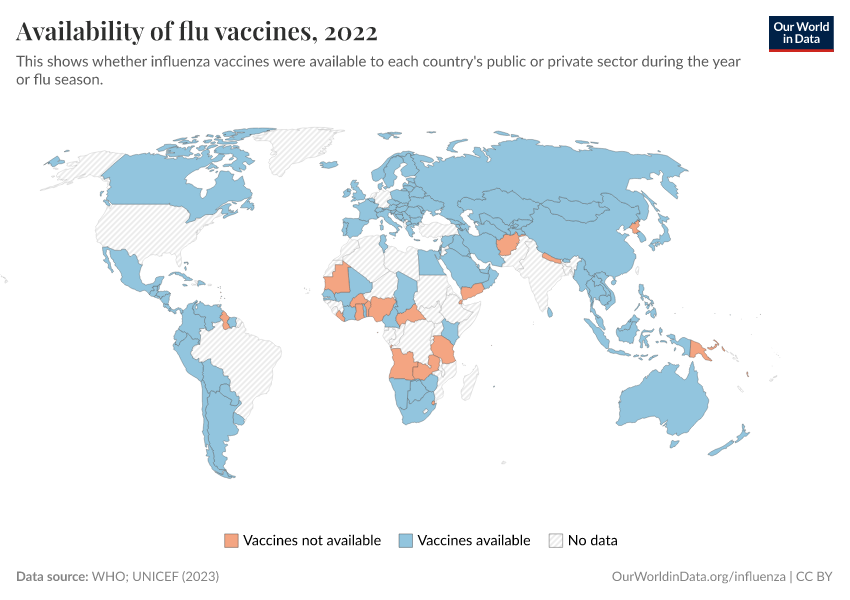
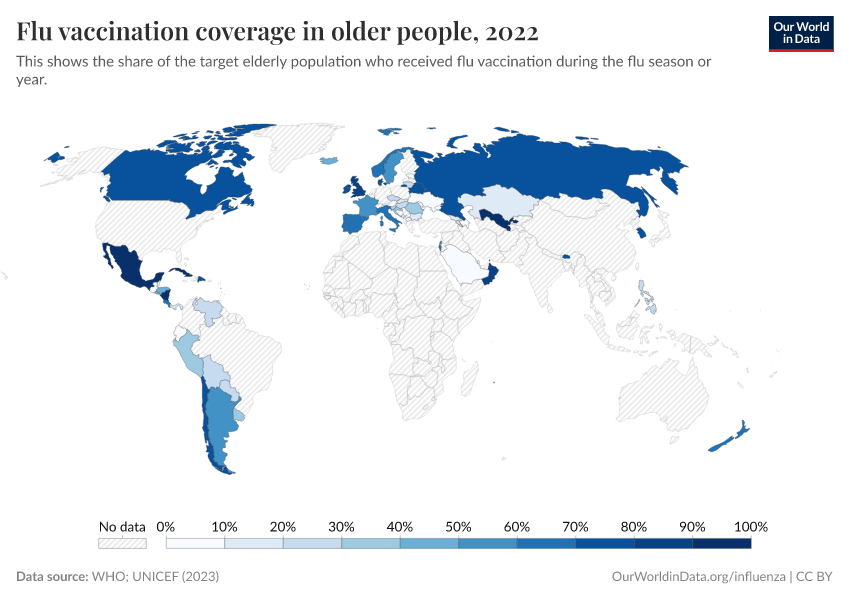
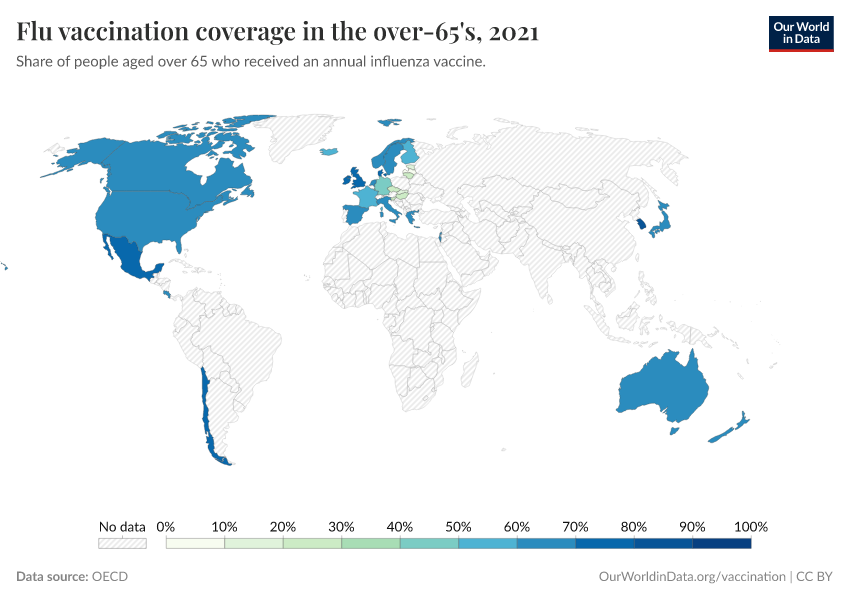
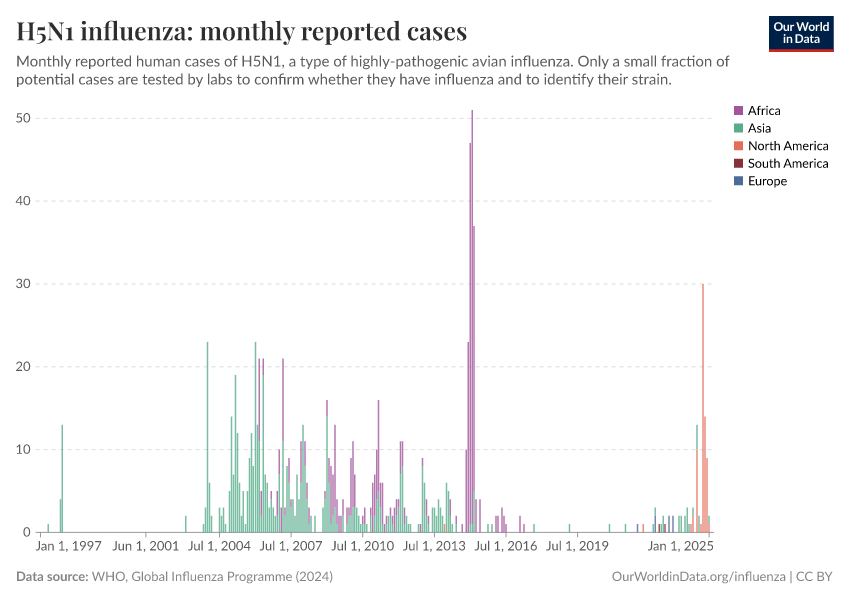
Yet, data on the flu is limited. With better testing, countries could improve their response to flu epidemics. It could help to rapidly identify new strains, detect epidemics early, and design better-matched vaccines to target flu strains circulating in the population.
This page therefore shows estimates of deaths during seasonal flu epidemics, historical flu pandemics, patterns of flu seasons in different countries, and confirmed cases of flu and flu-like symptoms across the world.
It also includes our Flu Explorer, a resource for epidemiologists, infectious disease researchers, and public health experts to monitor the global spread of the influenza virus.
Explore our data on influenza
Why we provide this Influenza Data Explorer
With this Flu Explorer, we aim to provide a helpful resource for epidemiologists, infectious disease researchers, and public health experts to understand the global spread of the influenza virus.
It differs from our widely-used infectious diseases projects, such as the COVID-19 Explorer and the Mpox Explorer. These tools are designed for a broad audience. Unfortunately, flu data is incomplete in many ways, making it harder to communicate. This tool is therefore designed for users with pre-existing knowledge to navigate effectively the complex data published by the World Health Organization.
The explorer also highlights the significant gaps in influenza data. It is an important reminder of the need to improve data collection and reporting.
Key Charts on Influenza
See all charts on this topicEndnotes
It’s estimated that seasonal influenza kills around 400,000 globally from respiratory disease (Paget et al., 2019), and 300,000 from cardiovascular disease (Chaves et al., 2023).
These estimates relate to mutually exclusive figures, as they are based on the proportion of deaths listed as caused by respiratory disease and cardiovascular diseases respectively that are attributable to influenza.
Paget J, Spreeuwenberg P, Charu V, Taylor RJ, Iuliano AD, Bresee J, Simonsen L, Viboud C; Global Seasonal Influenza-associated Mortality Collaborator Network and GLaMOR Collaborating Teams*. Global mortality associated with seasonal influenza epidemics: New burden estimates and predictors from the GLaMOR Project. J Glob Health. 2019 Dec;9(2):020421. doi: 10.7189/jogh.09.020421. https://jogh.org/documents/issue201902/jogh-09-020421.pdf
Chaves, S. S., Nealon, J., Burkart, K. G., Modin, D., Biering-Sørensen, T., Ortiz, J. R., Vilchis-Tella, V. M., Wallace, L. E., Roth, G., Mahe, C., & Brauer, M. (2023). Global, regional and national estimates of influenza-attributable ischemic heart disease mortality. eClinicalMedicine, 55, 101740. https://doi.org/10.1016/j.eclinm.2022.101740
See also -
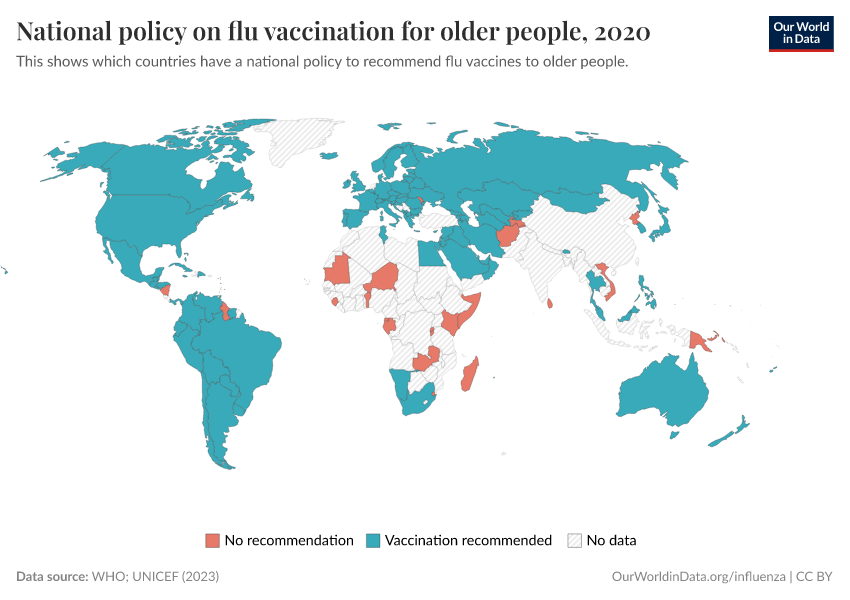
In recent meta-analyses, Behrouzi et al. found that influenza vaccination reduces the chances of major cardiovascular events (such as heart attacks and strokes) by around 34%, in clinical trials of the elderly.
Behrouzi, B., Bhatt, D. L., Cannon, C. P., Vardeny, O., Lee, D. S., Solomon, S. D., & Udell, J. A. (2022). Association of Influenza Vaccination With Cardiovascular Risk: A Meta-analysis. JAMA Network Open, 5(4), e228873. https://doi.org/10.1001/jamanetworkopen.2022.8873
Metcalf, C. J. E., Paireau, J., O’Driscoll, M., Pivette, M., Hubert, B., Pontais, I., Nickbakhsh, S., Cummings, D. A. T., Cauchemez, S., & Salje, H. (2022). Comparing the age and sex trajectories of SARS-CoV-2 morbidity and mortality with other respiratory pathogens. Royal Society Open Science, 9(6), 211498. https://doi.org/10.1098/rsos.211498
Paget J, Spreeuwenberg P, Charu V, Taylor RJ, Iuliano AD, Bresee J, Simonsen L, Viboud C; Global Seasonal Influenza-associated Mortality Collaborator Network and GLaMOR Collaborating Teams*. Global mortality associated with seasonal influenza epidemics: New burden estimates and predictors from the GLaMOR Project. J Glob Health. 2019 Dec;9(2):020421. doi: 10.7189/jogh.09.020421. https://jogh.org/documents/issue201902/jogh-09-020421.pdf
Kutter, J. S., Spronken, M. I., Fraaij, P. L., Fouchier, R. A., & Herfst, S. (2018). Transmission routes of respiratory viruses among humans. Current Opinion in Virology, 28, 142–151. https://doi.org/10.1016/j.coviro.2018.01.001
Farboodi, M., Jarosch, G., & Shimer, R. (2021). Internal and external effects of social distancing in a pandemic. Journal of Economic Theory, 196, 105293. https://doi.org/10.1016/j.jet.2021.105293
Woskie, L. R., Hennessy, J., Espinosa, V., Tsai, T. C., Vispute, S., Jacobson, B. H., Cattuto, C., Gauvin, L., Tizzoni, M., Fabrikant, A., Gadepalli, K., Boulanger, A., Pearce, A., Kamath, C., Schlosberg, A., Stanton, C., Bavadekar, S., Abueg, M., Hogue, M., … Gabrilovich, E. (2021). Early social distancing policies in Europe, changes in mobility & COVID-19 case trajectories: Insights from Spring 2020. PLOS ONE, 16(6), e0253071. https://doi.org/10.1371/journal.pone.0253071
Rothman, K. J., Lash, T. L., VanderWeele, T. J., & Haneuse, S. (2021). Modern epidemiology (Fourth edition). Wolters Kluwer.
Biggerstaff, M., Cauchemez, S., Reed, C., Gambhir, M., & Finelli, L. (2014). Estimates of the reproduction number for seasonal, pandemic, and zoonotic influenza: A systematic review of the literature. BMC Infectious Diseases, 14(1), 480. https://doi.org/10.1186/1471-2334-14-480
This effect was so large that it may have led to the extinction of a lineage of flu called influenza B Yamagata.
Dhanasekaran, V., Sullivan, S., Edwards, K. M., Xie, R., Khvorov, A., Valkenburg, S. A., Cowling, B. J., & Barr, I. G. (2022). Human seasonal influenza under COVID-19 and the potential consequences of influenza lineage elimination. Nature Communications, 13(1), 1721. https://doi.org/10.1038/s41467-022-29402-5
Paget, J., Caini, S., Del Riccio, M., van Waarden, W., & Meijer, A. (2022). Has influenza B/Yamagata become extinct and what implications might this have for quadrivalent influenza vaccines? Eurosurveillance, 27(39). https://doi.org/10.2807/1560-7917.ES.2022.27.39.2200753
World Health Organization & others. (2019). Global influenza strategy 2019-2030. https://apps.who.int/iris/bitstream/handle/10665/311184/9789241515320-eng.pdf
Acosta, E., Hallman, S. A., Dillon, L. Y., Ouellette, N., Bourbeau, R., Herring, D. A., Inwood, K., Earn, D. J. D., Madrenas, J., Miller, M. S., & Gagnon, A. (2019). Determinants of Influenza Mortality Trends: Age-Period-Cohort Analysis of Influenza Mortality in the United States, 1959–2016. Demography, 56(5), 1723–1746. https://doi.org/10.1007/s13524-019-00809-y
Barberis, I., Myles, P., Ault, S. K., Bragazzi, N. L., & Martini, M. (2016). History and evolution of influenza control through vaccination: From the first monovalent vaccine to universal vaccines. Journal of Preventive Medicine and Hygiene, 57(3), E115–E120. https://www.ncbi.nlm.nih.gov/pmc/articles/PMC5139605/
Centers for Disease Control and Prevention, & National Center for Immunization and Respiratory Diseases. (2021). Historical Reference of Seasonal Influenza Vaccine Doses Distributed. https://www.cdc.gov/flu/prevent/vaccine-supply-historical.htm
Petrova, V. N., & Russell, C. A. (2018). The evolution of seasonal influenza viruses. Nature Reviews Microbiology, 16(1), 47–60. https://doi.org/10.1038/nrmicro.2017.118
Chen, C., Jiang, D., Yan, D., Pi, L., Zhang, X., Du, Y., Liu, X., Yang, M., Zhou, Y., Ding, C., Lan, L., & Yang, S. (2023). The global region-specific epidemiologic characteristics of influenza: World Health Organization FluNet data from 1996 to 2021. International Journal of Infectious Diseases, 129, 118–124. https://pubmed.ncbi.nlm.nih.gov/36773717/
Petrova, V. N., & Russell, C. A. (2018). The evolution of seasonal influenza viruses. Nature Reviews Microbiology, 16(1), 47–60. https://doi.org/10.1038/nrmicro.2017.118
Paynter, S. (2015). Humidity and respiratory virus transmission in tropical and temperate settings. Epidemiology & Infection, 143(6), 1110–1118. https://doi.org/10.1017/S0950268814002702
Igboh, L. S., Roguski, K., Marcenac, P., Emukule, G. O., Charles, M. D., Tempia, S., Herring, B., Vandemaele, K., Moen, A., Olsen, S. J., Wentworth, D. E., Kondor, R., Mott, J. A., Hirve, S., Bresee, J. S., Mangtani, P., Nguipdop-Djomo, P., & Azziz-Baumgartner, E. (2023). Timing of seasonal influenza epidemics for 25 countries in Africa during 2010–19: A retrospective analysis. The Lancet Global Health, 11(5), e729–e739. https://doi.org/10.1016/S2214-109X(23)00109-2
Newman, L. P., Bhat, N., Fleming, J. A., & Neuzil, K. M. (2018). Global influenza seasonality to inform country-level vaccine programs: An analysis of WHO FluNet influenza surveillance data between 2011 and 2016. PLOS ONE, 13(2), e0193263. https://doi.org/10.1371/journal.pone.0193263
This definition has been used since 2011, after the Swine flu pandemic. Since then, most countries, but not all, have adopted it.
Fitzner, J., Qasmieh, S., Mounts, A. W., Alexander, B., Besselaar, T., Briand, S., Brown, C., Clark, S., Dueger, E., Gross, D., Hauge, S., Hirve, S., Jorgensen, P., Katz, M. A., Mafi, A., Malik, M., McCarron, M., Meerhoff, T., Mori, Y., … Vandemaele, K. (2018). Revision of clinical case definitions: Influenza-like illness and severe acute respiratory infection. Bulletin of the World Health Organization, 96(2), 122–128.
https: //doi.org/10.2471/BLT.17.194514
World Health Organization. (2022). Respiratory Viruses Surveillance Country, Territory and Area Profiles, 2021. https://apps.who.int/iris/bitstream/handle/10665/352183/WHO-EURO-2022-4760-44523-63025-eng.pdf?sequence=1&isAllowed=y
Simpson, R. B., Gottlieb, J., Zhou, B., Hartwick, M. A., & Naumova, E. N. (2021). Completeness of open access FluNet influenza surveillance data for Pan-America in 2005–2019. Scientific Reports, 11(1), 795. https://doi.org/10.1038/s41598-020-80842-9
World Health Organization. (2022). Respiratory Viruses Surveillance Country, Territory and Area Profiles, 2021. https://apps.who.int/iris/bitstream/handle/10665/352183/WHO-EURO-2022-4760-44523-63025-eng.pdf?sequence=1&isAllowed=y
For example, the United States uses the 'ILINet' system, which is connected to many clinics across the country. But, in many countries including the US, clinics participate on a voluntary basis, so not all clinics are included. Clinics in some states and demographics are less likely to be part of the system. See also: Baltrusaitis, K., Vespignani, A., Rosenfeld, R., Gray, J., Raymond, D., & Santillana, M. (2019). Differences in Regional Patterns of Influenza Activity Across Surveillance Systems in the United States: Comparative Evaluation. JMIR Public Health and Surveillance, 5(4), e13403. https://doi.org/10.2196/13403 This means 'non-sentinel' data may not be representative of the cases across the country. They may also lack high-quality testing.
World Health Organization. (2022). Respiratory Viruses Surveillance Country, Territory and Area Profiles, 2021. https://apps.who.int/iris/bitstream/handle/10665/352183/WHO-EURO-2022-4760-44523-63025-eng.pdf?sequence=1&isAllowed=y Simpson, R. B., Gottlieb, J., Zhou, B., Hartwick, M. A., & Naumova, E. N. (2021). Completeness of open access FluNet influenza surveillance data for Pan-America in 2005–2019. Scientific Reports, 11(1), 795. https://doi.org/10.1038/s41598-020-80842-9
Krammer, F., Smith, G. J. D., Fouchier, R. A. M., Peiris, M., Kedzierska, K., Doherty, P. C., Palese, P., Shaw, M. L., Treanor, J., Webster, R. G., & García-Sastre, A. (2018). Influenza. Nature Reviews Disease Primers, 4(1), 3. https://doi.org/10.1038/s41572-018-0002-y
There are four types of influenza viruses: A, B, C, and D. Influenza A and B tend to spread between people around the world each year. In contrast, influenza C and D mainly infect birds and other animals.
The subtypes are named according to two proteins the virus has on its surface: hemagglutinin (H) and neuraminidase (N). There are many subtypes of each of these two proteins (18 hemagglutinin subtypes and 11 neuraminidase subtypes), but only some of the combinations have been observed. For example, H3N2 is a type of influenza A virus which has hemagglutinin subtype 3 and neuraminidase subtype 2.
Long, J.S., Mistry, B., Haslam, S.M. et al. Host and viral determinants of influenza A virus species specificity. Nat Rev Microbiol 17, 67–81 (2019). https://doi.org/10.1038/s41579-018-0115-z
Caini, S., Kusznierz, G., Garate, V. V., Wangchuk, S., Thapa, B., de Paula Júnior, F. J., Ferreira de Almeida, W. A., Njouom, R., Fasce, R. A., Bustos, P., Feng, L., Peng, Z., Araya, J. L., Bruno, A., de Mora, D., Barahona de Gámez, M. J., Pebody, R., Zambon, M., Higueros, R., … the Global Influenza B Study team. (2019). The epidemiological signature of influenza B virus and its B/Victoria and B/Yamagata lineages in the 21st century. PLOS ONE, 14(9), e0222381. https://doi.org/10.1371/journal.pone.0222381
The subtype or lineage of a flu virus is not always determined during testing. This tends to be because some clinics do not test for all subtypes of influenza, due to a lack of testing resources. These are listed as unknown subtypes/lineages of influenza. For example, with influenza A, labs tend to test only whether they are the H1 or H3 strain.
However, unknown subtypes/lineages can also include novel influenza strains, which have gone through significant evolution.
Tricco, A. C., Chit, A., Soobiah, C., Hallett, D., Meier, G., Chen, M. H., Tashkandi, M., Bauch, C. T., & Loeb, M. (2013). Comparing influenza vaccine efficacy against mismatched and matched strains: A systematic review and meta-analysis. BMC Medicine, 11(1), 153. https://doi.org/10.1186/1741-7015-11-153
Jernigan, D. B., Lindstrom, S. . L., Johnson, J. . R., Miller, J. D., Hoelscher, M., Humes, R., Shively, R., Brammer, L., Burke, S. A., Villanueva, J. M., Balish, A., Uyeki, T., Mustaquim, D., Bishop, A., Handsfield, J. H., Astles, R., Xu, X., Klimov, A. I., Cox, N. J., & Shaw, M. W. (2011). Detecting 2009 Pandemic Influenza A (H1N1) Virus Infection: Availability of Diagnostic Testing Led to Rapid Pandemic Response. Clinical Infectious Diseases, 52(suppl_1), S36–S43. https://doi.org/10.1093/cid/ciq020
Krammer, F., Smith, G. J. D., Fouchier, R. A. M., Peiris, M., Kedzierska, K., Doherty, P. C., Palese, P., Shaw, M. L., Treanor, J., Webster, R. G., & García-Sastre, A. (2018). Influenza. Nature Reviews Disease Primers, 4(1), 3. https://doi.org/10.1038/s41572-018-0002-y World Health Organization & others. (2015). A manual for estimating disease burden associated with seasonal influenza. https://www.who.int/publications/i/item/9789241549301
Even in participating clinics, some data can be missing. For example, data collection forms may not be filled in or reported to the WHO for all patients with influenza-like illnesses who visit the clinics. Samples may not be packaged, stored, transported, or tested correctly, especially in regions with a lack of healthcare staff and supplies. See also – World Health Organization & others. (2019). Global influenza strategy 2019-2030. https://apps.who.int/iris/bitstream/handle/10665/311184/9789241515320-eng.pdf Gentile, A., Paget, J., Bellei, N., Torres, J. P., Vazquez, C., Laguna-Torres, V. A., & Plotkin, S. (2019). Influenza in Latin America: A report from the Global Influenza Initiative (GII). Vaccine, 37(20), 2670–2678. https://doi.org/10.1016/j.vaccine.2019.03.081
Worobey, M., Han, G.-Z., & Rambaut, A. (2014). Genesis and pathogenesis of the 1918 pandemic H1N1 influenza A virus. Proceedings of the National Academy of Sciences, 111(22), 8107–8112. https://doi.org/10.1073/pnas.1324197111
P. Spreeuwenberg; et al. (1 December 2018). “Reassessing the Global Mortality Burden of the 1918 Influenza Pandemic”. American Journal of Epidemiology. 187 (12): 2561–2567. doi:10.1093/aje/kwy191. PMID 30202996. Online here.
Gagnon, A., Miller, M. S., Hallman, S. A., Bourbeau, R., Herring, D. A., Earn, D. J. D., & Madrenas, J. (2013). Age-specific mortality during the 1918 influenza pandemic: Unravelling the mystery of high young adult mortality. PloS One, 8(8), e69586. https://doi.org/10.1371/journal.pone.0069586
Luk, J., Gross, P., & Thompson, W. W. (2001). Observations on Mortality during the 1918 Influenza Pandemic. Clinical Infectious Diseases, 33(8), 1375–1378. https://doi.org/10.1086/322662
Ma, J., Dushoff, J., & Earn, D. J. D. (2011). Age-specific mortality risk from pandemic influenza. Journal of Theoretical Biology, 288, 29–34. https://doi.org/10.1016/j.jtbi.2011.08.003
Johnson, N. P. A. S., and Mueller, J. (2002). Updating the Accounts: Global Mortality of the 1918-1920 “Spanish” Influenza Pandemic. Bulletin of the History of Medicine, 76(1), 105–115. http://www.jstor.org/stable/44446153 Patterson, K. D., & Pyle, G. F. (1991). The geography and mortality of the 1918 influenza pandemic. Bulletin of the History of Medicine, 65(1), 4–21. http://www.jstor.org/stable/44447656 Spreeuwenberg, P., Kroneman, M., & Paget, J. (2018). Reassessing the Global Mortality Burden of the 1918 Influenza Pandemic. American Journal of Epidemiology, 187(12), 2561–2567. https://doi.org/10.1093/aje/kwy191 Paget J, Spreeuwenberg P, Charu V, Taylor RJ, Iuliano AD, Bresee J, Simonsen L, Viboud C; Global Seasonal Influenza-associated Mortality Collaborator Network and GLaMOR Collaborating Teams*. Global mortality associated with seasonal influenza epidemics: New burden estimates and predictors from the GLaMOR Project. J Glob Health. 2019 Dec;9(2):020421. doi: 10.7189/jogh.09.020421. https://jogh.org/documents/issue201902/jogh-09-020421.pdf Dawood, F. S., Iuliano, A. D., Reed, C., Meltzer, M. I., Shay, D. K., Cheng, P.-Y., Bandaranayake, D., Breiman, R. F., Brooks, W. A., Buchy, P., Feikin, D. R., Fowler, K. B., Gordon, A., Hien, N. T., Horby, P., Huang, Q. S., Katz, M. A., Krishnan, A., Lal, R., … Widdowson, M.-A. (2012). Estimated global mortality associated with the first 12 months of 2009 pandemic influenza A H1N1 virus circulation: A modelling study. The Lancet Infectious Diseases, 12(9), 687–695. https://doi.org/10.1016/S1473-3099(12)70121-4 Simonsen, L., Spreeuwenberg, P., Lustig, R., Taylor, R. J., Fleming, D. M., Kroneman, M., Van Kerkhove, M. D., Mounts, A. W., Paget, W. J., & the GLaMOR Collaborating Teams. (2013). Global Mortality Estimates for the 2009 Influenza Pandemic from the GLaMOR Project: A Modeling Study. PLoS Medicine, 10(11), e1001558. https://doi.org/10.1371/journal.pmed.1001558
Cite this work
Our articles and data visualizations rely on work from many different people and organizations. When citing this topic page, please also cite the underlying data sources. This topic page can be cited as:
Saloni Dattani, Fiona Spooner, Hannah Ritchie and Max Roser (2023) - “Influenza” Published online at OurWorldinData.org. Retrieved from: 'https://ourworldindata.org/influenza' [Online Resource]BibTeX citation
@article{owid-influenza,
    author = {Saloni Dattani and Fiona Spooner and Hannah Ritchie and Max Roser},
    title = {Influenza},
    journal = {Our World in Data},
    year = {2023},
    note = {https://ourworldindata.org/influenza}
}
Reuse this work freely
All visualizations, data, and code produced by Our World in Data are completely open access under the Creative Commons BY license. You have the permission to use, distribute, and reproduce these in any medium, provided the source and authors are credited.
The data produced by third parties and made available by Our World in Data is subject to the license terms from the original third-party authors. We will always indicate the original source of the data in our documentation, so you should always check the license of any such third-party data before use and redistribution.
All of our charts can be embedded in any site.

