Data

Share of population living in extreme poverty

World Bank
See all data and research on:

What you should know about this indicator

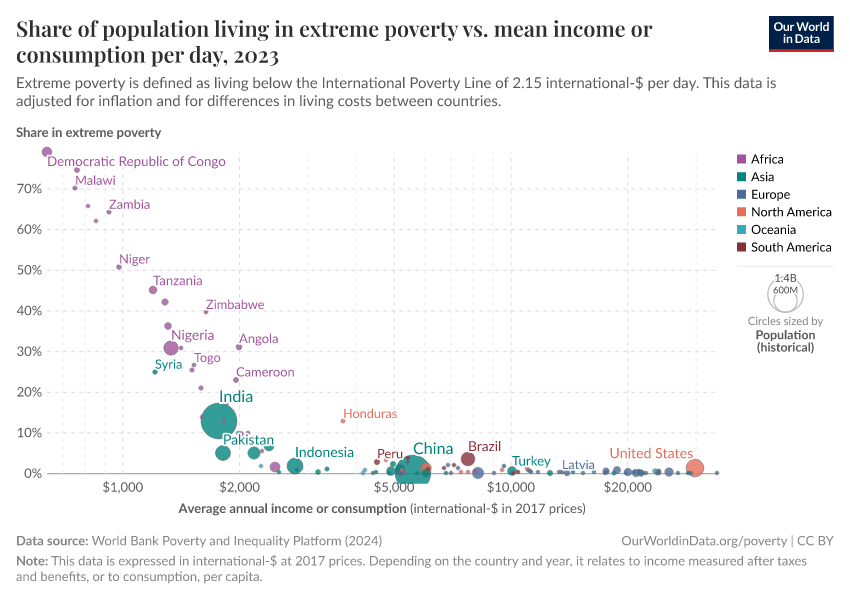
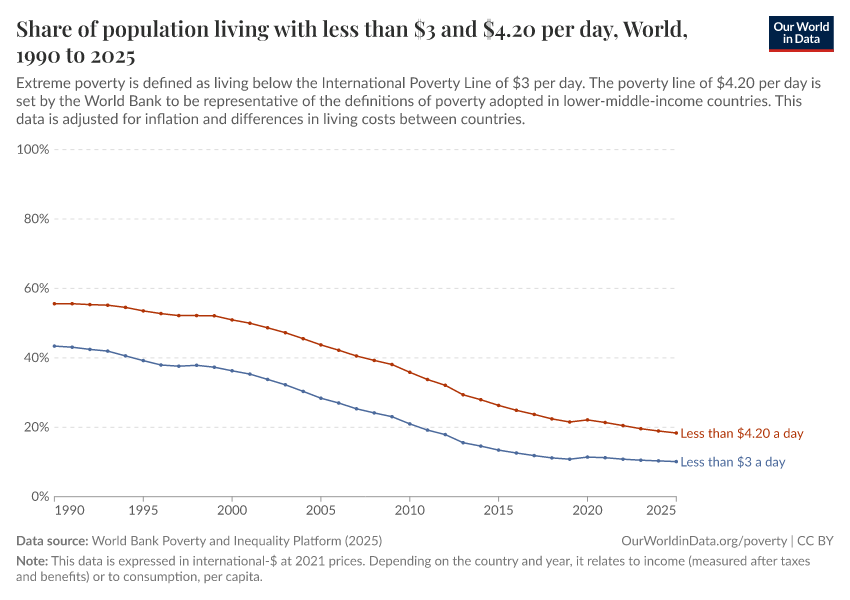
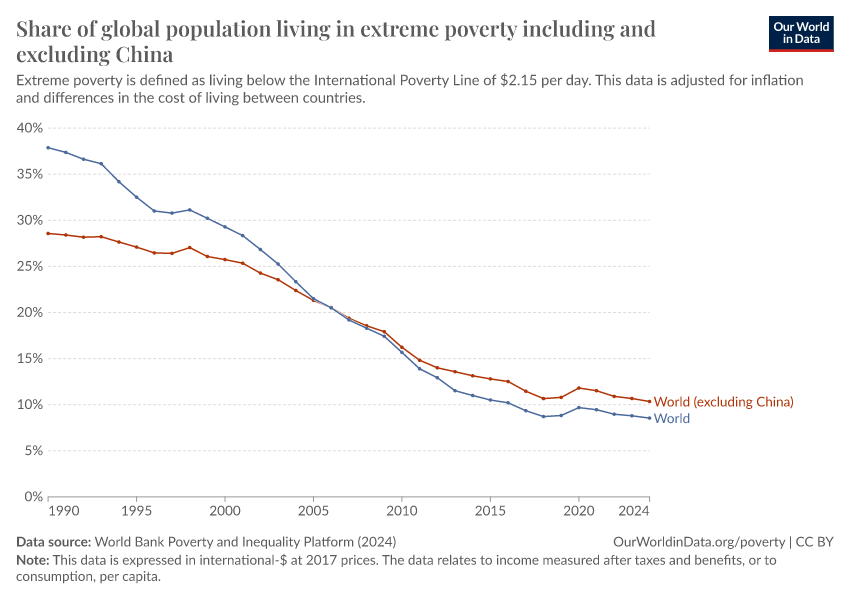
  • The World Bank defines extreme poverty as living on less than $3 per day. This threshold, known as the , is set so that poverty can be compared across countries. This indicator plays an important and successful role in focusing the world's attention on the very poorest people. The UN uses this indicator to track progress towards ending extreme poverty by 2030.
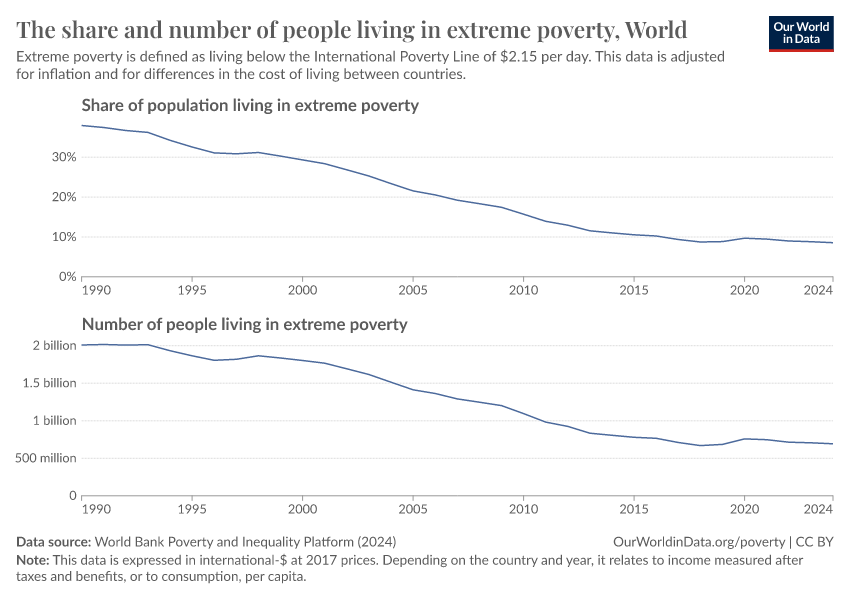
  • Two centuries ago, most of the world's population was extremely poor. Many believed that widespread poverty was inevitable. But this turned out to be wrong. Economic growth is possible, and poverty can decline. With this poverty line, we can track whether countries are leaving the worst poverty behind.
  • This data is expressed in constant international dollars to adjust for inflation and differences in living costs between countries. Read more in our article, What are international dollars?
  • Many people, today and in the past, have no monetary income. This data accounts for this by including the estimated value of non-market income, such as food grown by subsistence farmers for their own use.
  • Regional and global estimates are extrapolated up until the year of the data release using GDP growth estimates and forecasts. For more details about the methodology, please refer to the World Bank PIP documentation.
  • Depending on the country and year, the data refers either to income (after taxes and benefits) or to consumption, . For most countries, we have only one option available. But when there is a mix of consumption and income data points, we process the data to keep one observation per country and year. Our Poverty Data Explorer shows the original data with all available income and consumption measures separately.
Learn more in the FAQs

How is this data described by its producer - World Bank?

% of population living in households with consumption or income per person below the poverty line at 2021 international prices. As a result of revisions in PPP exchange rates, poverty rates for individual countries cannot be compared with poverty rates reported in earlier editions.

Share of population living in extreme poverty
World Bank
Percentage of population living in households with an income or consumption below $3 per day.
Source
World Bank Poverty and Inequality Platform (2026)with major processing by Our World in Data
Last updated
March 24, 2026
Next expected update
September 2026
Date range
1963–2026
Unit
%

What is the International Poverty Line, and how is it set?

There is no single definition of poverty. Our understanding of the extent of poverty and how it is changing depends on which definition we have in mind.

In particular, richer and poorer countries set very different poverty lines in order to measure poverty in a way that is informative and relevant to the level of incomes of their citizens.

For instance, while in the United States a person is counted as being in poverty if they live on less than roughly $27.10 per day, in Ethiopia the poverty line is set more than 10 times lower, at $2.59 per day. You can read more about how these comparable national poverty lines are calculated in this footnote.

Because the definition of poverty varies so widely, national poverty lines can’t be used to compare poverty across countries. To measure poverty globally, we need to use a poverty line that is applied consistently across all countries.

This is the goal of the International Poverty Line of $3 per day, which is set by the World Bank and used by the UN to monitor extreme poverty around the world.

In global terms, this is an extremely low threshold — set to represent the typical poverty lines adopted in the world’s poorest countries. It marks an incredibly low standard of living — a level of income much lower than just the cost of a healthy diet.

How does the World Bank set the International Poverty Line?

The exact method used by the World Bank to set the International Poverty Line has changed over time. But each time, the goal has remained broadly the same: to find a “typical standard by which the poorest countries of the world judge their citizens to be impoverished.”

The method used in the latest update to arrive at a figure of $3 (expressed in 2021 international-$) can be summarized as follows.

The World Bank begins by collecting a large set of national poverty lines — the lines used by individual countries to estimate official poverty rates among their populations. The World Bank has developed an approach to make these comparable.

The IPL aims to reflect the typical definition of poverty adopted among “low-income” countries, classified using the World Bank’s income classification system. For this, the World Bank uses the median value of these poverty lines.

Although the International Poverty Line is by far the most prominent international line, the same method is also used by the World Bank to set two higher poverty lines that reflect the national definitions adopted in lower-middle and upper-middle income countries. The median poverty line among these two groups of countries are $4.20 and $8.30, respectively.

You can read more in our article: The $3 a day International Poverty Line.

What are international-$ and why are they used to measure incomes?

Much of the economic data we use to understand the world, such as the incomes people receive or the goods and services firms produce and people buy, is recorded in the local currencies of each country. That means the numbers start out in rupees, US dollars, yuan, and many others, and without adjusting for inflation over time. This is known as being in “current prices” or “nominal” terms.

Before these figures can be meaningfully compared, they need to be converted into common units. International dollars (int.-$) are a hypothetical currency that is used for this.

The idea is simple: one international dollar should buy the same quantity and quality of goods and services, no matter where or when it is spent. To achieve this, international dollars adjust for two things. First, they account for inflation within each country, so that values from different years can be compared (showing “constant” prices). Second, they account for differences in living costs across countries. This second adjustment uses purchasing power parity (PPP) rates, which reflect how much local currency is needed to buy what one US dollar would buy in the United States.

The United States is the benchmark, so that one 2021 int.-$ is defined as the value of goods and services that one US dollar would buy in the US in 2021. One 2011 int.-$ is defined in the same way, but for prices in 2011.

You can read more in our article, What are international dollars?

How comparable is the World Bank data on household incomes across time or between countries?

There is no single global survey of incomes. What we have instead are national surveys, each designed by a different statistical agency, using different methodologies. The World Bank collects and harmonizes this data, but important comparability issues remain.

One key issue is that high-income countries typically measure people's incomes, while lower-income countries more often measure consumption expenditure — what households spend on goods and services. Pooling both types of survey is unavoidable if we want a global picture of inequality, but it means that somewhat different things are being measured depending on the country or year.

The two concepts are closely related: the income of a household equals its consumption plus savings.

At the bottom end of the income distribution, people’s consumption may be somewhat higher than their income. While zero consumption is not a feasible value — people must consume something to survive — a zero income is a feasible value. A common example is retired people drawing down their savings: they may have a very low, or even zero, income, but still have a high level of consumption.

At the top end of the distribution, consumption is typically lower than income. The gap rises with income, with households generally saving a higher share of their income the richer they are.

For both reasons, the distribution of consumption is generally more equal than the distribution of income. This means that inequality estimates tend to be somewhat lower when based on consumption surveys.

There are other comparability issues too — differences in survey design, coverage, and methodology. The PIP Methodology Handbook provides a good summary of the comparability and data quality issues affecting this data and how it tries to address them.

To help readers see where comparisons may be less reliable, the World Bank groups data points within each country into "spells" — periods where the underlying surveys are considered more comparable. Where available, you can reveal these breaks in our charts using the "breaks in data" option.

How does the World Bank produce global and regional estimates of poverty and inequality from national data?

For its poverty and inequality data, the World Bank relies on household surveys that are conducted nationally. In order to produce global or regional estimates, the survey data from different countries is “lined up” and aggregated. For each year, the World Bank finds the most recent survey for each country and projects the data forward (or backward) to the year being estimated. This is necessary, particularly since surveys are less frequently available in poorer countries and for earlier decades.

These projections are generally based on the assumption that incomes or expenditure grow in line with the growth rates observed in national accounts data. You can read more about the interpolation methods used by the World Bank in Chapter 5 of the Poverty and Inequality Platform Methodology Handbook.

Sources and processing

World Bank Poverty and Inequality Platform – World Bank Poverty and Inequality Platform (PIP)

The Poverty and Inequality Platform (PIP) is an interactive computational tool that offers users quick access to the World Bank’s estimates of poverty, inequality, and shared prosperity. PIP provides a comprehensive view of global, regional, and country-level trends for over 170 economies around the world.

Retrieved on
March 24, 2026
Citation
This is the citation of the original data obtained from the source, prior to any processing or adaptation by Our World in Data. To cite data downloaded from this page, please use the suggested citation given in Reuse This Work below.
World Bank (2026). Poverty and Inequality Platform (version 20260324_2021 and 20260324_2017) [Data set]. World Bank Group. https://pip.worldbank.org/.

All data and visualizations on Our World in Data rely on data sourced from one or several original data providers. Preparing this original data involves several processing steps. Depending on the data, this can include standardizing country names and world region definitions, converting units, calculating derived indicators such as per capita measures, as well as adding or adapting metadata such as the name or the description given to an indicator.

At the link below you can find a detailed description of the structure of our data pipeline, including links to all the code used to prepare data across Our World in Data.

Read about our data pipeline
Notes on our processing step for this indicator

For most countries in the dataset, estimates relate to disposable income or consumption, for all available years. Several countries, however, have a mix of income and consumption data points, with both data types sometimes available for particular years.

In most of our charts, we present the data with some data points dropped to present a single series for each country. This allows us to make readable visualizations that combine multiple countries. In choosing which data points to keep, we strike a balance between maintaining comparability over time and showing as long a time series as possible. As such, the exact approach varies across countries.

The original data with all available income and consumption measures is shown separately in our Poverty Data Explorer.

How to cite this page

To cite this page overall, including any descriptions, FAQs or explanations of the data authored by Our World in Data, please use the following citation:

“Data Page: Share of population living in extreme poverty”, part of the following publication: Joe Hasell, Bertha Rohenkohl, Pablo Arriagada, Esteban Ortiz-Ospina, and Max Roser (2022) - “Poverty”. Data adapted from World Bank Poverty and Inequality Platform. Retrieved from https://archive.ourworldindata.org/20260422-113457/grapher/share-of-population-in-extreme-poverty.html [online resource] (archived on April 22, 2026).

How to cite this data

In-line citationIf you have limited space (e.g. in data visualizations), you can use this abbreviated in-line citation:

World Bank Poverty and Inequality Platform (2026) – with major processing by Our World in Data

Full citation

World Bank Poverty and Inequality Platform (2026) – with major processing by Our World in Data. “Share of population living in extreme poverty – World Bank” [dataset]. World Bank Poverty and Inequality Platform, “World Bank Poverty and Inequality Platform (PIP) 20260324_2021, 20260324_2017” [original data]. Retrieved April 30, 2026 from https://archive.ourworldindata.org/20260422-113457/grapher/share-of-population-in-extreme-poverty.html (archived on April 22, 2026).

Quick download

Download the data shown in this chart as a ZIP file containing a CSV file, metadata in JSON format, and a README. The CSV file can be opened in Excel, Google Sheets, and other data analysis tools.

Data API

Use these URLs to programmatically access this chart's data and configure your requests with the options below. Our documentation provides more information on how to use the API, and you can find a few code examples below.

Data URL (CSV format)
https://ourworldindata.org/grapher/share-of-population-in-extreme-poverty.csv?v=1&csvType=full&useColumnShortNames=false
Metadata URL (JSON format)
https://ourworldindata.org/grapher/share-of-population-in-extreme-poverty.metadata.json?v=1&csvType=full&useColumnShortNames=false

Code examples

Examples of how to load this data into different data analysis tools.

Excel / Google Sheets
=IMPORTDATA("https://ourworldindata.org/grapher/share-of-population-in-extreme-poverty.csv?v=1&csvType=full&useColumnShortNames=false")
Python with Pandas
import pandas as pd
import requests

# Fetch the data.
df = pd.read_csv("https://ourworldindata.org/grapher/share-of-population-in-extreme-poverty.csv?v=1&csvType=full&useColumnShortNames=false", storage_options = {'User-Agent': 'Our World In Data data fetch/1.0'})

# Fetch the metadata
metadata = requests.get("https://ourworldindata.org/grapher/share-of-population-in-extreme-poverty.metadata.json?v=1&csvType=full&useColumnShortNames=false").json()
R
library(jsonlite)

# Fetch the data
df <- read.csv("https://ourworldindata.org/grapher/share-of-population-in-extreme-poverty.csv?v=1&csvType=full&useColumnShortNames=false")

# Fetch the metadata
metadata <- fromJSON("https://ourworldindata.org/grapher/share-of-population-in-extreme-poverty.metadata.json?v=1&csvType=full&useColumnShortNames=false")
Stata
import delimited "https://ourworldindata.org/grapher/share-of-population-in-extreme-poverty.csv?v=1&csvType=full&useColumnShortNames=false", encoding("utf-8") clear