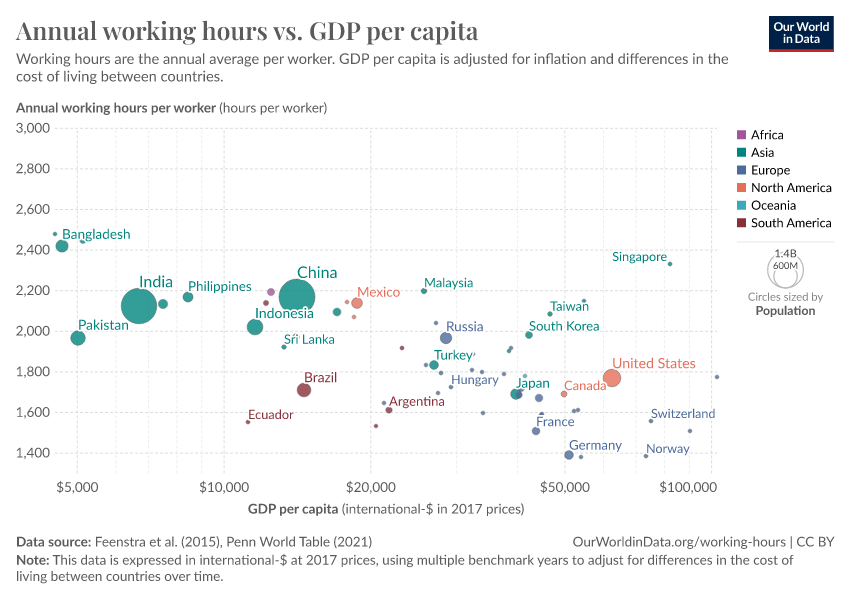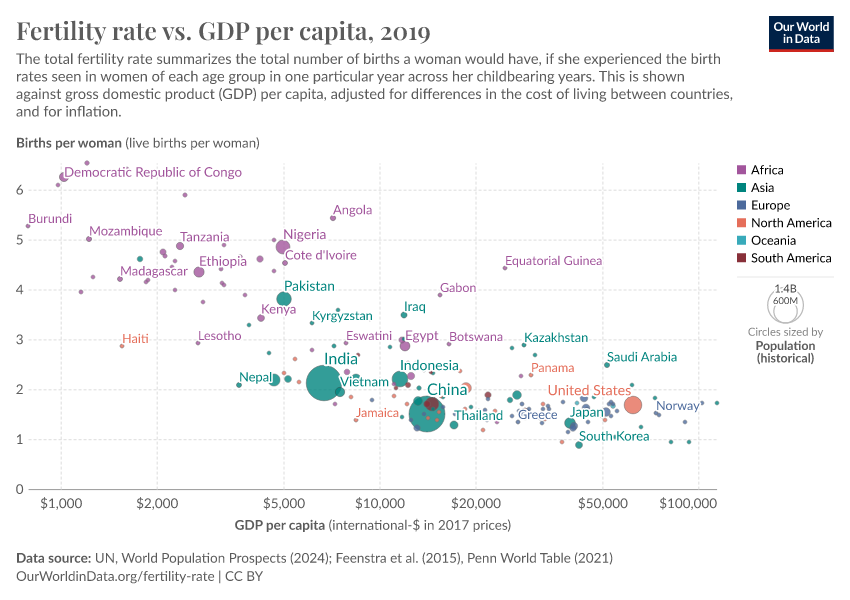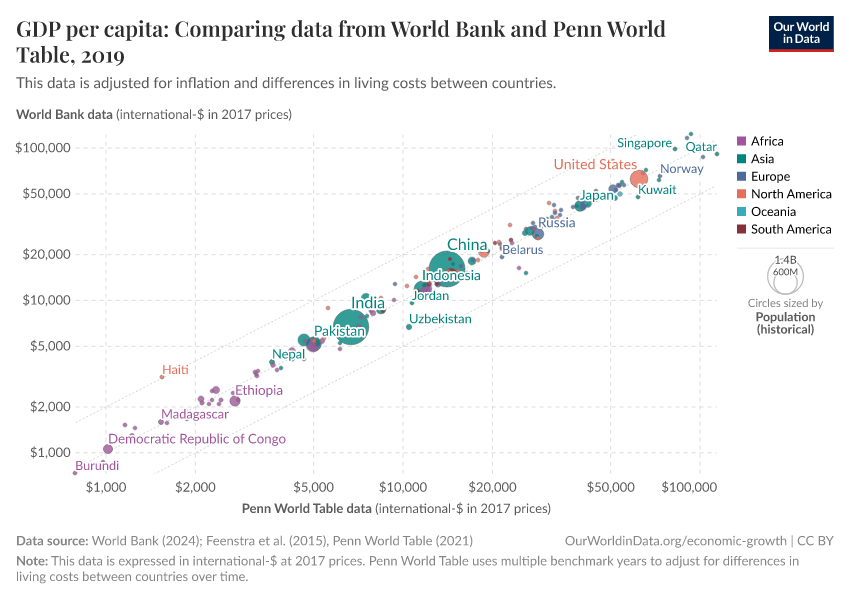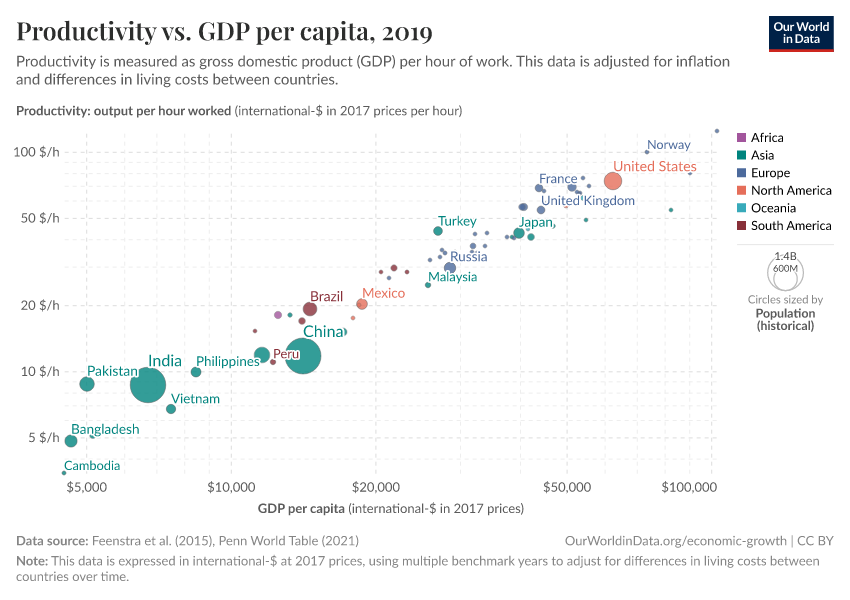
GDP per capita, 1950 to 2019

This data is adjusted for inflation and for differences in living costs between countries.

GDP per capita In constant international-$ – Penn World Tableinternational-$ in 2017 prices
Country or region
1950
2019
Absolute Change
Relative Change
Albania$12,532
Algeria$11,787
Angola$7,160
Anguilla$15,178
Antigua and Barbuda$16,230
Argentina$21,827
Armenia$14,735
Aruba$32,614
Australia$13,661$54,147+$40,486+296%
Austria$5,960$53,345+$47,385+795%
Azerbaijan$15,859
Bahamas$33,089
Bahrain$46,965
Bangladesh$4,658
Barbados$12,217
Belarus$21,666
Belgium$8,349$44,840+$36,491+437%
Belize$5,602
Benin$3,245
Bermuda$51,003
Bhutan$11,778
Bolivia$2,431$8,585+$6,154+253%
Bosnia and Herzegovina$13,795
Botswana$16,484
Brazil$1,665$14,594+$12,929+777%
British Virgin Islands$37,369
Brunei$73,249
Bulgaria$21,347
Burkina Faso$2,120
Burundi$790
Cambodia$4,500
Cameroon$3,651
Canada$12,879$49,884+$37,005+287%
Cape Verde$7,271
Cayman Islands$64,717
Central African Republic$978
Chad$1,615
Chile$4,542$23,253+$18,710+412%
China$963$14,129+$13,166+1,367%
Colombia$3,486$14,058+$10,572+303%
Comoros$3,209
Congo$4,657
Costa Rica$3,650$18,522+$14,872+407%
Cote d'Ivoire$5,035
Croatia$26,001
Curacao$21,162
Cyprus$3,253$32,302+$29,049+893%
Czechia$37,521
Democratic Republic of Congo$2,154$1,022-$1,133-53%
Denmark$10,533$54,027+$43,494+413%
Djibouti$6,132
Dominica$10,328
Dominican Republic$2,452$17,927+$15,475+631%
Ecuador$3,364$11,236+$7,872+234%
Egypt$12,060
El Salvador$668$8,116+$7,448+1,114%
Equatorial Guinea$24,713
Estonia$33,852
Eswatini$7,828
Ethiopia$425$2,721+$2,295+539%
Fiji$13,754
Finland$6,581$44,929+$38,348+583%
France$7,635$43,755+$36,120+473%
Gabon$15,492
Gambia$2,409
Georgia$17,056
Germany$5,227$51,191+$45,963+879%
Ghana$3,869$5,363+$1,494+39%
Greece$3,767$27,201+$23,434+622%
Grenada$15,374
Guatemala$2,285$7,770+$5,484+240%
Guinea$2,287
Guinea-Bissau$1,850
Guyana$13,010
Haiti$1,554
Honduras$2,339$5,428+$3,089+132%
Hong Kong$54,810
Hungary$29,236
Iceland$9,510$53,012+$43,502+457%
India$951$6,711+$5,761+606%
Indonesia$11,595
Iran$2,681$13,241+$10,560+394%
Iraq$11,920
Ireland$5,439$102,622+$97,183+1,787%
Israel$5,787$38,563+$32,776+566%
Italy$4,536$40,732+$36,196+798%
Jamaica$3,639$8,435+$4,795+132%
Japan$2,805$39,704+$36,899+1,316%
Jordan$2,298$10,789+$8,491+369%
Kazakhstan$28,306
Kenya$1,644$4,237+$2,593+158%
Kuwait$62,055
Kyrgyzstan$6,136
Laos$7,586
Latvia$29,411
Lebanon$14,750
Lesotho$2,695
Liberia$1,258
Lithuania$32,483
Luxembourg$14,919$90,479+$75,560+506%
Macao$93,488
Madagascar$1,539
Malawi$770$1,161+$391+51%
Malaysia$2,432$25,735+$23,304+958%
Maldives$19,411
Mali$2,446
Malta$38,910
Mauritania$4,676
Mauritius$5,206$23,438+$18,232+350%
Mexico$5,065$18,737+$13,672+270%
Moldova$9,439
Mongolia$11,900
Montenegro$21,850
Montserrat$15,573
Morocco$1,387$7,924+$6,537+471%
Mozambique$1,229
Myanmar$5,153
Namibia$9,353
Nepal$3,631
Netherlands$9,007$55,569+$46,562+517%
New Zealand$11,964$41,522+$29,559+247%
Nicaragua$3,636$5,024+$1,389+38%
Niger$1,211
Nigeria$1,800$4,984+$3,184+177%
North Macedonia$15,780
Norway$9,827$73,669+$63,842+650%
Oman$30,723
Pakistan$1,381$5,026+$3,645+264%
Palestine$7,386
Panama$2,170$29,880+$27,710+1,277%
Paraguay$2,401$12,320+$9,919+413%
Peru$2,250$12,237+$9,986+444%
Philippines$1,478$8,449+$6,971+472%
Poland$31,985
Portugal$2,978$31,797+$28,818+968%
Qatar$114,101
Romania$27,888
Russia$28,526
Rwanda$2,280
Saint Kitts and Nevis$22,939
Saint Lucia$14,238
Saint Vincent and the Grenadines$11,102
Sao Tome and Principe$3,785
Saudi Arabia$51,825
Senegal$3,248
Serbia$17,220
Seychelles$27,783
Sierra Leone$1,875
Singapore$82,336
Sint Maarten (Dutch part)$31,101
Slovakia$27,473
Slovenia$34,093
South Africa$5,968$12,536+$6,568+110%
South Korea$1,112$42,219+$41,108+3,698%
Spain$3,858$40,366+$36,509+946%
Sri Lanka$2,801$13,290+$10,489+375%
Sudan$4,231
Suriname$14,481
Sweden$10,465$52,433+$41,968+401%
Switzerland$16,252$75,299+$59,047+363%
Syria$7,211
Taiwan$1,621$46,761+$45,141+2,785%
Tajikistan$3,894
Tanzania$2,359
Thailand$1,219$17,116+$15,897+1,304%
Togo$2,235
Trinidad and Tobago$6,109$28,643+$22,535+369%
Tunisia$11,090
Turkey$3,409$26,948+$23,539+690%
Turkmenistan$26,026
Uganda$910$2,092+$1,182+130%
Ukraine$13,145
United Arab Emirates$66,113
United Kingdom$10,457$44,275+$33,818+323%
United States$15,912$62,589+$46,677+293%
Uruguay$6,526$20,545+$14,019+215%
Uzbekistan$10,490
Venezuela$6,121$12,935+$6,814+111%
Vietnam$7,507
Yemen$1,777
Zambia$1,342$3,179+$1,838+137%
Zimbabwe$1,979$2,788+$809+41%
Data

GDP per capita

In constant international-$ – Penn World Table
See all data and research on:

What you should know about this indicator

  • Gross domestic product (GDP) is a measure of the total value added from the production of goods and services in a country or region each year. GDP per capita is GDP divided by population.
  • This indicator provides information on economic growth and income levels in the medium run. Some country estimates are available as far back as 1950.
  • This data is adjusted for inflation and for differences in living costs between countries.
  • This data is expressed in at 2017 prices, using a multiple benchmark approach that incorporates PPP estimates from all available benchmark years.
  • For GDP per capita estimates in the very long run, see the Maddison Project Database's indicator.
  • For more regularly updated estimates of GDP per capita since 1990, see the World Bank's indicator.
Learn more in the FAQs

Output-side real GDP at chained PPPs (in mil. 2017US$) [From GDP description]

GDP per capita
In constant international-$ – Penn World Table
Average economic output per person in a country or region per year. This data is adjusted for inflation and for differences in living costs between countries.
Source
Feenstra et al. (2015), Penn World Table (2021) – with major processing by Our World in Data
Last updated
November 28, 2022
Next expected update
May 2025
Date range
1950–2019
Unit
international-$ in 2017 prices

Frequently Asked Questions

What are international-$ and why are they used to measure incomes?

Much of the economic data we use to understand the world — for instance, on the goods and services bought or produced by households, firms and governments, or the incomes they receive — is initially recorded in terms of the units in which these transactions took place. That means this data starts out being expressed in a variety of local currencies — such as rupees, US dollars, or yuan, etc. — and without adjusting for inflation over time. This is known as being in “current prices”, or in “nominal” terms.

Before these figures can be meaningfully compared, they need to be converted into common units.

International dollars (int.-$) are a hypothetical currency that is used for this. It is the result of adjusting both for inflation within countries over time and for differences in the cost of living between countries.

The goal of international-$ is to provide a unit whose purchasing power is held fixed over time and across countries, such that one int.-$ can buy the same quantity and quality of goods and services no matter where or when it is spent.

The price level in the US is used as the benchmark so that one 2021 int.-$ is defined as the value of goods and services that one US dollar would buy in the US in 2021. Similarly, one 2011 int.-$ is defined as the value of goods and services that one US dollar would buy in the US in 2011.

The year 2021 (or any other benchmark year) indicates two things related to the two adjustments mentioned. Firstly, it tells us the base year used for the inflation adjustment within countries. This is the year whose prices are chosen to be the benchmark. If prices are higher than in this benchmark year, nominal data will be adjusted downwards. If prices are lower, it will be adjusted upwards. In the base year itself, the nominal and inflation-adjusted figures are the same by definition.

Secondly, 2021 (or any other benchmark year) indicates the year in which the differences in the cost of living between countries were assessed.

Purchasing Power Parity rates

Converting data in local currencies to international-$ means dividing the figures by a set of “exchange” rates, known as Purchasing Power Parity (PPP) rates. Unlike the exchange rates between currencies you would see at the foreign exchange counter, these account for differences in the cost of living between countries.

If you have ever shopped or eaten in a restaurant abroad, you may have noticed a country as a particularly expensive or cheap place to live. A given amount of your own currency, when exchanged for another country’s currency, may buy you considerably more or less there than it would have done at home.

The goal of PPP rates is to account for these price differences. They express, for each country, the amount of local currency that is needed to buy the same goods and services there as one US dollar buys in the US.

You can read more about this in our article What are PPP adjustments and why do we need them?

The “rounds” of the International Comparison Program

The calculation of PPP rates is the task of the International Comparison Program (ICP), which gathers data on the prices of thousands of goods and services in each country in a particular year.

The ICP does not calculate PPP rates every year but rather conducts its work in “rounds” that are several years apart. The most recent round was conducted in 2021, and the previous two rounds were conducted in 2011 and 2017.

In converting economic data to international-$, which round of PPPs are used to adjust for living costs differences between countries is, in principle, a separate issue from the base year used to adjust for inflation over time. By convention, however, the same year tends to be chosen for both. When converted to 2021 international-$, nominal local currencies are first adjusted for inflation to local 2021 prices, and are then adjusted to US prices using the PPPs calculated in the ICP’s 2021 round. Likewise, 2011 international-$ adjust for inflation using 2011 local prices and then use the 2011 PPPs to adjust for differences in living costs.

Sources and processing

This data is based on the following sources

Penn World Table is a database with information on GDP and its composition, employment, productivity and trade, covering 183 countries between 1950 and 2019. Data comes from national accounts, ICP PPP estimations, multiple other sources

Retrieved on
November 28, 2022
Citation
This is the citation of the original data obtained from the source, prior to any processing or adaptation by Our World in Data. To cite data downloaded from this page, please use the suggested citation given in Reuse This Work below.
Feenstra, R. C., Inklaar, R. and Timmer, M.P. (2015), "The Next Generation of the Penn World Table". American Economic Review, 105(10), 3150-3182

How we process data at Our World in Data

All data and visualizations on Our World in Data rely on data sourced from one or several original data providers. Preparing this original data involves several processing steps. Depending on the data, this can include standardizing country names and world region definitions, converting units, calculating derived indicators such as per capita measures, as well as adding or adapting metadata such as the name or the description given to an indicator.

At the link below you can find a detailed description of the structure of our data pipeline, including links to all the code used to prepare data across Our World in Data.

Read about our data pipeline
Notes on our processing step for this indicator

We estimated this indicator as the GDP (output, multiple price benchmarks) divided by the population of each country.

This variable uses ICP PPP benchmarks from multiple years to correct for changing prices over time.

We replaced values for Bermuda with estimates on GDP per capita (output, single price benchmark) due to the unusual changes on prices in this country.

We excluded values considered outliers in the original dataset (i_outlier = "Outlier"), due to implausible relative prices (PPPs divided by exchange rates).

Reuse this work

  • All data produced by third-party providers and made available by Our World in Data are subject to the license terms from the original providers. Our work would not be possible without the data providers we rely on, so we ask you to always cite them appropriately (see below). This is crucial to allow data providers to continue doing their work, enhancing, maintaining and updating valuable data.
  • All data, visualizations, and code produced by Our World in Data are completely open access under the Creative Commons BY license. You have the permission to use, distribute, and reproduce these in any medium, provided the source and authors are credited.

Citations

How to cite this page

To cite this page overall, including any descriptions, FAQs or explanations of the data authored by Our World in Data, please use the following citation:

“Data Page: GDP per capita”, part of the following publication: Max Roser, Bertha Rohenkohl, Pablo Arriagada, Joe Hasell, Hannah Ritchie and Esteban Ortiz-Ospina (2023) - “Economic Growth”. Data adapted from Feenstra et al. (2015), Penn World Table (2021). Retrieved from https://ourworldindata.org/grapher/gdp-per-capita-penn-world-table [online resource]
How to cite this data

In-line citationIf you have limited space (e.g. in data visualizations), you can use this abbreviated in-line citation:

Feenstra et al. (2015), Penn World Table (2021) – with major processing by Our World in Data

Full citation

Feenstra et al. (2015), Penn World Table (2021) – with major processing by Our World in Data. “GDP per capita – Penn World Table – In constant international-$” [dataset]. Feenstra et al. (2015), Penn World Table (2021), “Penn World Table” [original data]. Retrieved April 7, 2025 from https://ourworldindata.org/grapher/gdp-per-capita-penn-world-table