Annual CO₂ emissions, 2021

Carbon dioxide (CO₂) emissions from fossil fuels and industry. Land-use change is not included.

Annual CO₂ emissions tonnes
Country/area
2021
Afghanistan
10,271,881.00 t
Albania
5,134,120.00 t
Algeria
179,596,320.00 t
Andorra
410,368.00 t
Angola
19,195,578.00 t
Anguilla
142,896.00 t
Antigua and Barbuda
637,536.00 t
Argentina
191,107,840.00 t
Armenia
7,417,117.00 t
Aruba
857,376.00 t
Australia
389,019,520.00 t
Austria
65,757,468.00 t
Azerbaijan
38,292,976.00 t
Bahamas
2,476,864.00 t
Bahrain
36,195,830.00 t
Bangladesh
107,621,110.00 t
Barbados
1,175,740.00 t
Belarus
60,938,200.00 t
Belgium
94,886,104.00 t
Belize
613,022.00 t
Benin
5,759,265.00 t
Bermuda
516,623.97 t
Bhutan
1,595,828.00 t
Bolivia
21,756,278.00 t
Bonaire Sint Eustatius and Saba
113,584.00 t
Bosnia and Herzegovina
21,264,064.00 t
Botswana
6,008,960.00 t
Brazil
498,016,860.00 t
British Virgin Islands
183,200.00 t
Brunei
11,712,750.00 t
Bulgaria
42,425,090.00 t
Burkina Faso
6,289,259.00 t
Burundi
775,342.00 t
Cambodia
19,248,236.00 t
Cameroon
9,605,282.00 t
Canada
540,311,600.00 t
Cape Verde
545,936.00 t
Central African Republic
241,824.00 t
Chad
2,670,142.00 t
Chile
83,655,176.00 t
China
11,447,913,000.00 t
Christmas Island
0.00 t
Colombia
94,323,270.00 t
Comoros
498,304.00 t
Congo
7,414,592.00 t
Cook Islands
69,616.00 t
Costa Rica
7,647,175.00 t
Cote d'Ivoire
13,669,025.00 t
Croatia
17,410,670.00 t
Cuba
22,552,592.00 t
Curacao
2,000,544.10 t
Cyprus
7,170,389.00 t
Czechia
96,645,176.00 t
Democratic Republic of Congo
4,268,556.00 t
Denmark
29,587,502.00 t
Djibouti
531,545.00 t
Dominica
161,216.00 t
Dominican Republic
30,835,334.00 t
East Timor
620,168.00 t
Ecuador
38,204,230.00 t
Egypt
260,935,820.00 t
El Salvador
7,581,415.00 t
Equatorial Guinea
7,119,171.00 t
Eritrea
681,637.00 t
Estonia
10,390,745.00 t
Eswatini
1,011,263.94 t
Ethiopia
16,160,769.00 t
Faroe Islands
780,432.00 t
Fiji
1,095,536.00 t
Finland
37,798,000.00 t
France
305,607,230.00 t
French Polynesia
875,696.00 t
Gabon
5,531,466.00 t
Gambia
725,472.00 t
Georgia
11,094,497.00 t
Germany
678,777,300.00 t
Ghana
20,546,160.00 t
Greece
57,519,204.00 t
Greenland
566,715.00 t
Grenada
311,440.00 t
Guatemala
19,805,034.00 t
Guinea
4,125,664.20 t
Guinea-Bissau
304,112.00 t
Guyana
3,581,269.00 t
Haiti
3,483,521.00 t
Honduras
10,187,936.00 t
Hong Kong
33,716,964.00 t
Hungary
48,330,956.00 t
Iceland
3,508,308.00 t
India
2,674,221,800.00 t
Indonesia
619,622,400.00 t
Iran
779,755,600.00 t
Iraq
159,044,850.00 t
Ireland
37,544,270.00 t
Israel
59,007,950.00 t
Italy
335,977,820.00 t
Jamaica
7,345,511.00 t
Japan
1,061,905,300.00 t
Jordan
20,638,542.00 t
Kazakhstan
255,142,930.00 t
Kenya
22,314,226.00 t
Kiribati
65,952.00 t
Kosovo
8,815,973.00 t
Kuwait
95,130,230.00 t
Kyrgyzstan
10,326,665.00 t
Laos
22,801,204.00 t
Latvia
7,238,093.00 t
Lebanon
19,291,330.00 t
Lesotho
3,425,840.00 t
Liberia
782,557.00 t
Libya
56,540,852.00 t
Liechtenstein
145,884.00 t
Lithuania
13,851,095.00 t
Luxembourg
8,420,578.00 t
Macao
1,025,920.06 t
Madagascar
4,454,924.00 t
Malawi
1,884,698.00 t
Malaysia
273,152,500.00 t
Maldives
1,971,232.00 t
Mali
6,885,983.00 t
Malta
1,610,855.00 t
Marshall Islands
146,560.00 t
Mauritania
4,503,056.00 t
Mauritius
3,971,776.00 t
Mexico
446,834,100.00 t
Micronesia (country)
142,896.00 t
Moldova
5,849,646.00 t
Mongolia
41,852,420.00 t
Montenegro
2,410,912.00 t
Montserrat
21,984.00 t
Morocco
70,245,224.00 t
Mozambique
7,867,599.00 t
Myanmar
29,599,936.00 t
Namibia
3,900,919.00 t
Nauru
54,960.00 t
Nepal
15,723,567.00 t
Netherlands
139,683,650.00 t
New Caledonia
4,536,780.00 t
New Zealand
34,322,604.00 t
Nicaragua
5,144,894.00 t
Niger
2,712,771.00 t
Nigeria
135,070,380.00 t
Niue
7,328.00 t
North Korea
53,951,624.00 t
North Macedonia
6,488,741.00 t
Norway
41,028,000.00 t
Oman
75,116,290.00 t
Pakistan
247,901,340.00 t
Palau
212,512.00 t
Palestine
3,634,688.00 t
Panama
10,540,848.00 t
Papua New Guinea
8,129,648.00 t
Paraguay
8,133,305.50 t
Peru
52,016,748.00 t
Philippines
141,174,030.00 t
Poland
330,979,420.00 t
Portugal
40,284,110.00 t
Qatar
104,244,050.00 t
Romania
77,270,420.00 t
Russia
1,711,993,300.00 t
Rwanda
1,658,745.00 t
Saint Helena
10,992.00 t
Saint Kitts and Nevis
230,832.00 t
Saint Lucia
505,631.97 t
Saint Pierre and Miquelon
54,960.00 t
Saint Vincent and the Grenadines
234,496.00 t
Samoa
245,488.00 t
Sao Tome and Principe
142,896.00 t
Saudi Arabia
695,841,900.00 t
Senegal
12,309,421.00 t
Serbia
43,683,996.00 t
Seychelles
611,888.00 t
Sierra Leone
1,256,752.00 t
Singapore
50,100,000.00 t
Sint Maarten (Dutch part)
685,168.00 t
Slovakia
35,215,996.00 t
Slovenia
13,058,881.00 t
Solomon Islands
289,456.00 t
Somalia
619,216.00 t
South Africa
425,917,900.00 t
South Korea
616,075,000.00 t
South Sudan
1,755,056.00 t
Spain
229,069,380.00 t
Sri Lanka
23,015,166.00 t
Sudan
22,218,356.00 t
Suriname
2,643,140.00 t
Sweden
38,633,692.00 t
Switzerland
35,779,836.00 t
Syria
26,034,452.00 t
Taiwan
283,570,900.00 t
Tajikistan
9,227,823.00 t
Tanzania
18,266,576.00 t
Thailand
267,141,810.00 t
Togo
2,670,490.00 t
Tonga
190,528.00 t
Trinidad and Tobago
36,413,136.00 t
Tunisia
31,166,850.00 t
Turkey
452,702,800.00 t
Turkmenistan
63,434,730.00 t
Turks and Caicos Islands
366,400.00 t
Tuvalu
10,992.00 t
Uganda
6,167,196.00 t
Ukraine
210,153,310.00 t
United Arab Emirates
216,231,700.00 t
United Kingdom
344,510,080.00 t
United States
5,032,213,000.00 t
Uruguay
7,833,110.00 t
Uzbekistan
120,240,860.00 t
Vanuatu
216,176.00 t
Venezuela
78,459,940.00 t
Vietnam
313,972,580.00 t
Wallis and Futuna
29,312.00 t
Yemen
10,870,608.00 t
Zambia
7,785,735.00 t
Zimbabwe
10,203,630.00 t
Other
Africa
1,441,534,000.00 t
Africa (GCP)
1,441,523,000.00 t
Antarctica
0.00 t
Asia
21,640,397,000.00 t
Asia (GCP)
18,894,787,000.00 t
Asia (excl. China and India)
7,518,262,300.00 t
Central America (GCP)
172,782,940.00 t
Europe
5,304,039,400.00 t
Europe (GCP)
5,304,039,400.00 t
Europe (excl. EU-27)
2,502,895,000.00 t
Europe (excl. EU-28)
2,158,385,200.00 t
European Union (27)
2,801,144,000.00 t
European Union (28)
3,145,654,300.00 t
High-income countries
14,433,055,000.00 t
International aviation
293,715,900.00 t
International shipping
599,905,340.00 t
Kuwaiti Oil Fires (GCP)
0.00 t
Low-income countries
194,180,020.00 t
Lower-middle-income countries
4,489,789,400.00 t
Middle East (GCP)
2,753,740,800.00 t
Non-OECD (GCP)
24,323,074,000.00 t
North America
6,192,752,600.00 t
North America (GCP)
6,019,980,300.00 t
North America (excl. USA)
1,160,539,400.00 t
OECD (GCP)
11,775,041,000.00 t
Oceania
439,661,570.00 t
Oceania (GCP)
431,531,940.00 t
Ryukyu Islands (GCP)
0.00 t
South America
1,079,731,200.00 t
South America (GCP)
1,079,731,200.00 t
Upper-middle-income countries
16,980,641,000.00 t
World
36,991,734,000.00 t
Data

Annual CO₂ emissions

GCB
See all data and research on:

What you should know about this indicator

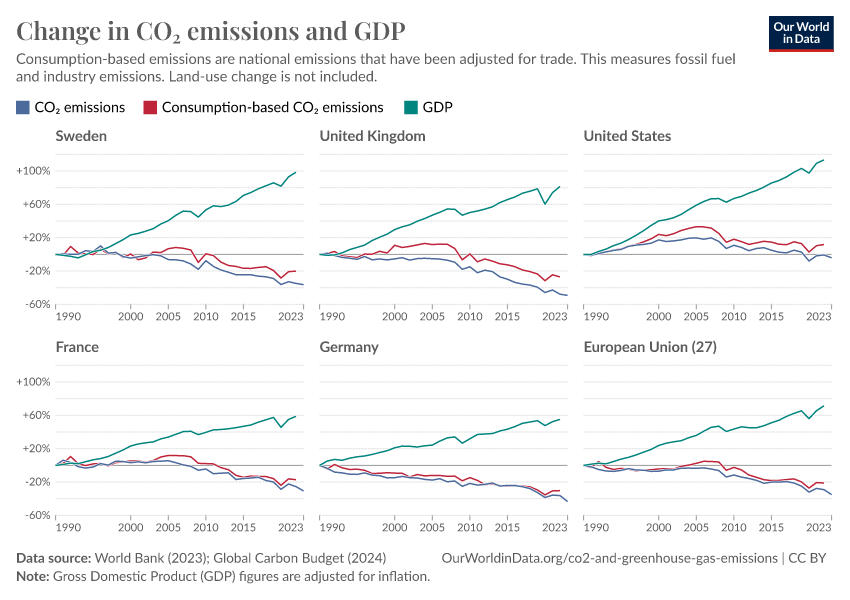
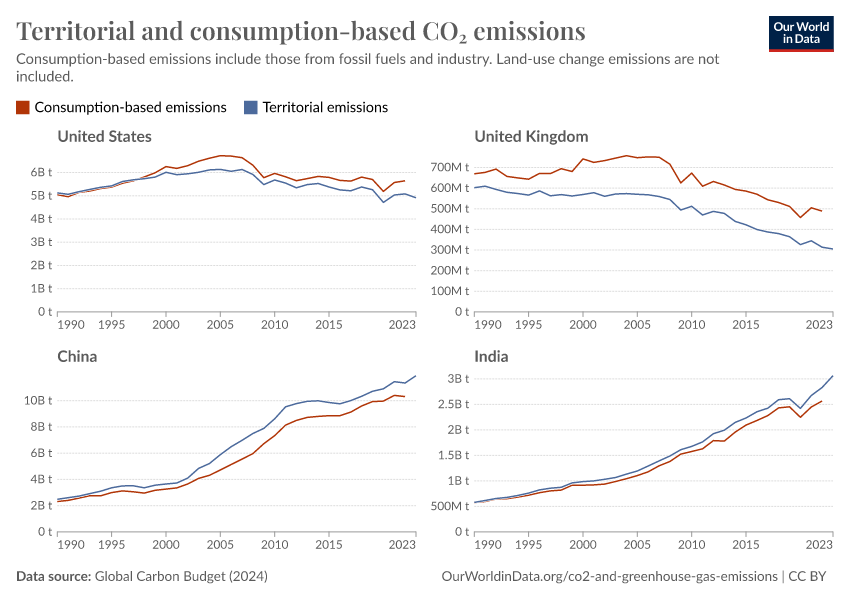
  • This data is based on territorial emissions, which do not account for emissions embedded in traded goods.
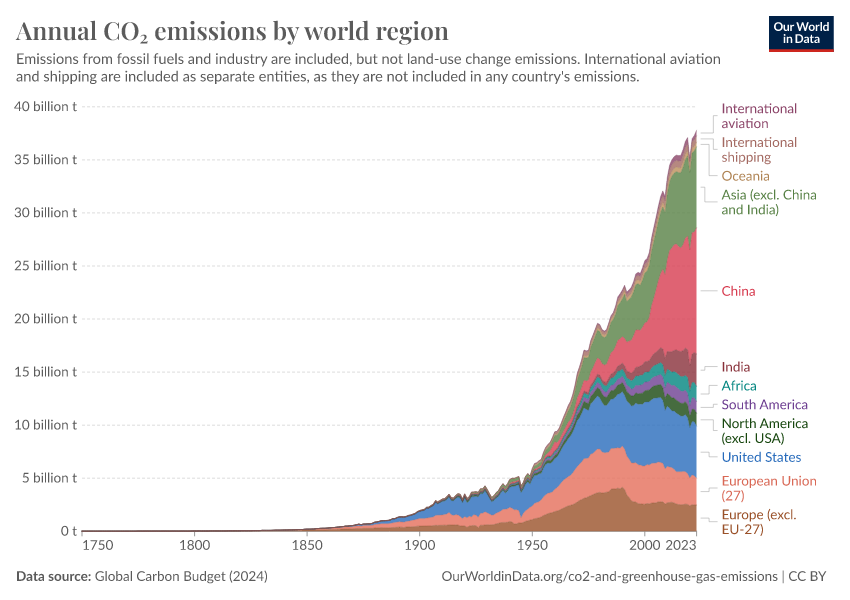
  • Emissions from international aviation and shipping are not included in any country or region's emissions. They are only included in the global total emissions.
Annual CO₂ emissions
GCB
Annual total emissions of carbon dioxide (CO₂), excluding land-use change, measured in tonnes.
Source
Global Carbon Budget (2024) – with major processing by Our World in Data
Last updated
November 21, 2024
Next expected update
November 2025
Date range
1750–2023
Unit
tonnes

Sources and processing

This data is based on the following sources

The Global Carbon Budget was founded by the Global Carbon Project (GCP) international science team to track the trends in global carbon emissions and sinks and is a key measure of progress towards the goals of the Paris Agreement. It's widely recognized as the most comprehensive report of its kind.

The GCP has been publishing estimates of global and national fossil CO2 emissions since 2001. In the first instance these were simple re-publications of data from another source, but over subsequent years refinements have been made in response to feedback and identification of inaccuracies.

Retrieved on
November 21, 2024
Citation
This is the citation of the original data obtained from the source, prior to any processing or adaptation by Our World in Data. To cite data downloaded from this page, please use the suggested citation given in Reuse This Work below.
Andrew, R. M., & Peters, G. P. (2024). The Global Carbon Project's fossil CO2 emissions dataset (2024v17) [Data set]. Zenodo. https://doi.org/10.5281/zenodo.13981696
The data files of the Global Carbon Budget can be found at: https://globalcarbonbudget.org/carbonbudget/
For more details, see the original paper:
Friedlingstein, P., O'Sullivan, M., Jones, M. W., Andrew, R. M., Bakker, D. C. E., Hauck, J., Landschützer, P., Le Quéré, C., Luijkx, I. T., Peters, G. P., Peters, W., Pongratz, J., Schwingshackl, C., Sitch, S., Canadell, J. G., Ciais, P., Jackson, R. B., Alin, S. R., Anthoni, P., Barbero, L., Bates, N. R., Becker, M., Bellouin, N., Decharme, B., Bopp, L., Brasika, I. B. M., Cadule, P., Chamberlain, M. A., Chandra, N., Chau, T.-T.-T., Chevallier, F., Chini, L. P., Cronin, M., Dou, X., Enyo, K., Evans, W., Falk, S., Feely, R. A., Feng, L., Ford, D. J., Gasser, T., Ghattas, J., Gkritzalis, T., Grassi, G., Gregor, L., Gruber, N., Gürses, Ö., Harris, I., Hefner, M., Heinke, J., Houghton, R. A., Hurtt, G. C., Iida, Y., Ilyina, T., Jacobson, A. R., Jain, A., Jarníková, T., Jersild, A., Jiang, F., Jin, Z., Joos, F., Kato, E., Keeling, R. F., Kennedy, D., Klein Goldewijk, K., Knauer, J., Korsbakken, J. I., Körtzinger, A., Lan, X., Lefèvre, N., Li, H., Liu, J., Liu, Z., Ma, L., Marland, G., Mayot, N., McGuire, P. C., McKinley, G. A., Meyer, G., Morgan, E. J., Munro, D. R., Nakaoka, S.-I., Niwa, Y., O'Brien, K. M., Olsen, A., Omar, A. M., Ono, T., Paulsen, M., Pierrot, D., Pocock, K., Poulter, B., Powis, C. M., Rehder, G., Resplandy, L., Robertson, E., Rödenbeck, C., Rosan, T. M., Schwinger, J., Séférian, R., Smallman, T. L., Smith, S. M., Sospedra-Alfonso, R., Sun, Q., Sutton, A. J., Sweeney, C., Takao, S., Tans, P. P., Tian, H., Tilbrook, B., Tsujino, H., Tubiello, F., van der Werf, G. R., van Ooijen, E., Wanninkhof, R., Watanabe, M., Wimart-Rousseau, C., Yang, D., Yang, X., Yuan, W., Yue, X., Zaehle, S., Zeng, J., and Zheng, B.: Global Carbon Budget 2023, Earth Syst. Sci. Data, 15, 5301-5369, https://doi.org/10.5194/essd-15-5301-2023, 2023.

How we process data at Our World in Data

All data and visualizations on Our World in Data rely on data sourced from one or several original data providers. Preparing this original data involves several processing steps. Depending on the data, this can include standardizing country names and world region definitions, converting units, calculating derived indicators such as per capita measures, as well as adding or adapting metadata such as the name or the description given to an indicator.

At the link below you can find a detailed description of the structure of our data pipeline, including links to all the code used to prepare data across Our World in Data.

Read about our data pipeline
Notes on our processing step for this indicator
  • Data on global emissions has been converted from tonnes of carbon to tonnes of carbon dioxide (CO₂) using a conversion factor of 3.664.
  • Emissions from the Kuwaiti oil fires in 1991 have been included as part of Kuwait's emissions for that year.
  • Country's share of the global population is calculated using our population dataset, based on different sources.
  • Each country's share of global CO₂ emissions from flaring has been calculated using global CO₂ emissions from flaring provided in the Global Carbon Budget dataset.

Reuse this work

  • All data produced by third-party providers and made available by Our World in Data are subject to the license terms from the original providers. Our work would not be possible without the data providers we rely on, so we ask you to always cite them appropriately (see below). This is crucial to allow data providers to continue doing their work, enhancing, maintaining and updating valuable data.
  • All data, visualizations, and code produced by Our World in Data are completely open access under the Creative Commons BY license. You have the permission to use, distribute, and reproduce these in any medium, provided the source and authors are credited.

Citations

How to cite this page

To cite this page overall, including any descriptions, FAQs or explanations of the data authored by Our World in Data, please use the following citation:

“Data Page: Annual CO₂ emissions”, part of the following publication: Hannah Ritchie, Pablo Rosado, and Max Roser (2023) - “CO₂ and Greenhouse Gas Emissions”. Data adapted from Global Carbon Project. Retrieved from https://ourworldindata.org/grapher/annual-co2-emissions-per-country [online resource]
How to cite this data

In-line citationIf you have limited space (e.g. in data visualizations), you can use this abbreviated in-line citation:

Global Carbon Budget (2024) – with major processing by Our World in Data

Full citation

Global Carbon Budget (2024) – with major processing by Our World in Data. “Annual CO₂ emissions – GCB” [dataset]. Global Carbon Project, “Global Carbon Budget” [original data]. Retrieved April 17, 2025 from https://ourworldindata.org/grapher/annual-co2-emissions-per-country