FAQs on the environmental impacts of food
The data presented in our Environmental Impacts of Food Data Explorer is sourced from the work of Joseph Poore and Thomas Nemecek (2018). This study, published in the journal Science is the largest meta-analysis of food systems to date.
I receive a lot of questions about the specifics of this dataset. Below I provide answers to the most common questions to clarify and help people understand the underlying data.
Where does the data from Poore and Nemecek (2018) come from? Does it come from a small or regionally-specific set of studies?
The study by Poore and Nemecek (2018) is the largest meta-analysis of food systems to date. A meta-analysis is, essentially a study of studies. To try to overcome bias from any individual study, it looks at the results of multiple studies to try to understand the overall trend or conclusion to a particular question.
In this paper, Poore and Nemecek identified 1530 studies for potential inclusion, in addition to additional data from 139 authors to supplement this. They then assessed these studies on the basis of 11 criteria to make sure the methodologies used in each were standardised – for example, making sure that all stages of the supply chain were considered. After this assessment, they had 570 suitable studies which used a consistent and high-quality methodology.
Their final dataset covered approximately 38,700 commercially viable farms across 119 countries. It spanned a total of 40 food products, which represented approximately 90% of global protein and calorie intake.
The breadth of this analysis – covering almost 40,000 farms and more than 100 countries with large geographical spread means that its results are not biased or reflective of any particular farming method, geographical region, or income level.
What stages of the supply chain does it cover?
This work is based on studies that quantify environmental impacts based on a life-cycle analysis. This means they include impacts across multiple stages of the supply chain.
All of the included studies quantify impacts from ‘cradle-to-gate’. This means they include:
- Land use change;
- On-farm impacts in crop or livestock production (including the manufacturing of inputs such as fertilizers, or emissions from manure);
- Animal feed production;
- Food processing: the conversion of raw ingredients into sold products, such as the processing of cereals into bread;
- Transport: this includes transport from the farm up to retail. Transport of food from retail to consumers’ homes is not included.
- Packaging
Impacts from food after they have been sold in retail are not included. For example, home cooking, refrigeration or household food waste is not included.
Which greenhouse gases are included? How are they quantified?
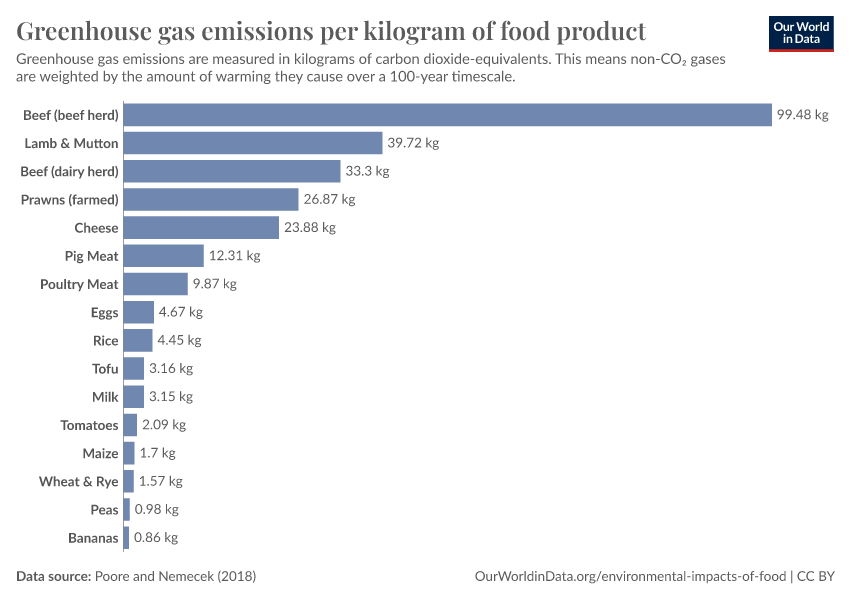
Since there are many different greenhouse gases, researchers often aggregate them into a common unit of measurement when they want to make comparisons. The study by Poore and Nemecek (2018) adopts the metric, ‘carbon dioxide-equivalents’, which is the most common way to measure this. This is the metric adopted by the Intergovernmental Panel on Climate Change (IPCC); and is used as the official reporting and target-setting metric within the Paris Agreement.
‘Carbon dioxide-equivalents’ (CO2eq) aggregate the impacts of all greenhouse gases into a single metric using ‘global warming potential’. More specifically, global warming potential over a 100-year timescale (GWP100) – a timeframe which represents a mid-to-long term period for climate policy.
To calculate CO2eq one needs to multiply the amount of each greenhouse gas emissions by its GWP100 value – a value which aims to represent the amount of warming that each specific gas generates relative to CO2. For example, the IPCC adopts a GWP100 value of 28 for methane based on the rationale that emitting one kilogram of methane will have 28 times the warming impact over 100 years as one kilogram of CO2. This factor is 34 when climate feedbacks are included.
How methane is treated – which is a shorter-lived, but more powerful greenhouse gas than CO2 – is often discussed. In my related article I look at the role of methane in this research in more detail.
The data you present on the environmental impacts of food is presented as a global average. How does this vary by region?
Yes, the values presented in our data explorer are the global median values across the 38,700 commercially viable farms, in 119 countries. There can be large differences in the impacts of the same products from different producers. This can be the result of specific production methods, or simply regional differences in terms of the efficiency of production.
Unfortunately data is not available to present this breakdown by country or region. However, in my article here I look at the full spectrum of greenhouse gas emissions – from the lowest to highest impact – producers for each product. I do the same for land use here.
What we find is that there can be a large difference between the ‘worst’ and ‘best’ producers. This means there is an opportunity to reduce the impacts of food production by optimizing for the lowest-impact producers. However, what is also clear is that this does not change the ordering of the impacts of different foods. It’s still the case that nearly all beef and lamb producers have a high carbon footprint – higher than plant-based alternatives, even if we opt for the ‘best’ (lowest-impact) producers.
You show some of these metrics as the environmental footprint per kilogram of product. What about comparisons by the nutritional content of foods?
The most useful comparison of food products will depend on the context and what question is being asked. For this reason, we make it easy to switch between environmental impacts per kilogram per 100 grams of protein, and per 1000 kilocalories in our Environmental Impacts Data Explorer.
Do food miles and transport play a large role in the carbon footprint of our food?
No, transport accounts for just 5% of greenhouse gas emissions from food. This finding has been backed up by other studies, such as the work of Crippa et al. (2021), published inNature.
The small contribution of transport to food’s emissions means that the benefits of eating local to reduce your carbon footprint is often overstated. I look at this in more detail in my article You want to reduce the carbon footprint of your food? Focus on what you eat, not whether your food is local.
On one chart you previously showed a value of 99.5 kilograms CO2eq per kilogram of beef from beef herds. On another, it was shown as 60 kgCO2eq per kilogram. Why were these values different?
Previously, two of our charts – the total emissions for each product, and the breakdown of emissions by stage of the supply chain – showed different values for some products. The former showed the mean, and the latter the median.
This is how the data is made available in the underlying study from Poore and Nemecek (2018).
This was the result of two differences. First, the breakdown of emissions by stage of the supply chain excluded losses in the supply chain. Second, one presented the mean (total emissions) and the other the median (breakdown) value for each product. For products with a large skew in emissions, the mean and median can be quite different.
We updated the data on the breakdown of emissions on 15th June 2022 based on supplementary data provided by the author, with supply chain losses included, and given as the mean. This means these two charts are now consistent. Note that the static visualization in our article here still uses the values without losses included, hence the values vary slightly.
How do you choose what foods to show by default in your charts?
In our Environmental Impacts of Food Data Explorer you can add and remove a range of food products to compare and combination you like. By default we cannot show every food on the chart – otherwise it would become unreadable. So, we have to make a choice about which ones to show.
For comparisons in kilograms and kilocalories we try to show a range of products, including meats, dairy, cereals, pulses, fruits, vegetables, nuts and oilcrops.
For comparisons in terms of protein, it makes most sense to compare animal products and plant products that are a good source of protein. It often doesn’t make sense to compare to plant-based products with little protein, such as fruits or vegetables. In the same way, it doesn’t make sense to assess animal fats – which contain little protein – on the basis of their protein content. However, the data for each product is made available as an option if you want to explore the data for yourself.
Why does cheese have a much higher carbon footprint than milk?
When measured per kilogram of product, cheese has a significantly higher carbon footprint than milk. This is because cheese is, effectively, a much denser form of milk. On a mass basis, it is like concentrated milk, with a much lower water content.
You will notice that the footprint is much more similar when measured on the basis of protein, or in terms of kilocalories because cheese will have a higher protein and energy content per kilogram than milk does.
Why does beef from beef herds have a higher environmental footprint than beef from dairy herds?
The environmental footprint of beef from beef herds is significantly higher than beef from dairy herds. This is because the impacts from dairy cows are split between beef and dairy co-products. For example, the methane emitted from anaerobic digestion from cows is split between milk and beef. So the individual contribution from either product is lower. In contrast, methane from beef herds is attributed solely to beef products.
Is the difference in emissions from beef, dairy and lamb only due to methane?
Methane is a significant contributor to the greenhouse gas emissions of ruminant livestock – that is, mainly, cattle and lamb. However, it is not the sole reason for the large emissions of beef, dairy and lamb. Livestock grazing is the dominant source of global deforestation and land use change; and large livestock require large amounts of animal feed, which has an associated footprint from the production of cereals, soy and other animal feeds.
Even when we remove methane entirely, these products still have a high carbon footprint.
I look at this question in detail here.
Does the greenhouse gas footprint of foods include the carbon opportunity costs of land use?
No, the data on greenhouse gases from food, presented in this study, only relates to greenhouse gas emissions. That is, the amount of greenhouse gases emitted in a given year. It does not account for historical emissions from land use change, nor does it factor in the carbon opportunity costs of what land could be used for if it was not used for farming.
I do, however, look at this data on the carbon opportunity costs of food in a related article.
How can nuts have negative greenhouse gas emissions?
In the recent past, many nut plantations have replaced grasslands or abandoned pastures. Since the trees of nut crops sequester carbon dioxide, when they replace some grasslands this can actually result in an emission saving due to positive land use change. This effect, however, will eventually diminish as nut plantations are grown on land that was not previously grasslands.
How does the environmental impact of plant-based milks compare to dairy?
All plant-based milks – regardless of type – have a lower environmental footprint than dairy when measured per serving. I cover this question in more detail here.
I can't find the data on the environmental impacts of plant-based milks in the paper. Where does it come from?
Only the footprint of dairy and soy milk were included in the published paper prior to publication. Due to frequent requests for comparisons of other plant-based milks, additional data was provided by the author after publication. This follows exactly the same methodology as was applied in the original paper. It also uses the same footprint results of the raw ingredients from the paper (e.g. oat milk adopts the footprint of oats as published in the study).
You can download this data as a single CSV file using the 'Download' button from our chart here.
I can't find the data on the breakdown of greenhouse gas emissions by stage of the supply chain in the paper. Where does it come from?
You find this breakdown in the Supplementary Data file (S2) in the tab 'Results – Global Totals'.
Explore the data
Related articles on this topic
Cite this work
Our articles and data visualizations rely on work from many different people and organizations. When citing this article, please also cite the underlying data sources. This article can be cited as:
Hannah Ritchie (2022) - “FAQs on the environmental impacts of food” Published online at OurWorldinData.org. Retrieved from: 'https://archive.ourworldindata.org/20251125-173858/faqs-environmental-impacts-food.html' [Online Resource] (archived on November 25, 2025).BibTeX citation
@article{owid-faqs-environmental-impacts-food,
    author = {Hannah Ritchie},
    title = {FAQs on the environmental impacts of food},
    journal = {Our World in Data},
    year = {2022},
    note = {https://archive.ourworldindata.org/20251125-173858/faqs-environmental-impacts-food.html}
}
Reuse this work freely
All visualizations, data, and articles produced by Our World in Data are completely open access under the Creative Commons BY license. You have the permission to use, distribute, and reproduce these in any medium, provided the source and authors are credited.
The data produced by third parties and made available by Our World in Data is subject to the license terms from the original third-party authors. We will always indicate the original source of the data in our documentation, so you should always check the license of any such third-party data before use and redistribution.
All of our charts can be embedded in any site.