FAQs on plastics
In our full entry on Plastic Pollution we provide an in-depth overview of global plastic production, distribution, management, and impacts through data visualisations and explainers. There you should find most of the data and context needed to understand the problem of global plastics.
Here I answer some common questions on plastic pollution:
- How much plastic and waste do we produce?
- How much oil do we use to make plastic?
- Which sectors use the most plastic?
- Where does the plastic in the ocean come from?
- I've heard most of our ocean plastic debris comes from fishing activity — is this true?
- What are the environmental impacts of landfills?
- What are the environmental impacts of incineration?
- Recycling, landfill or incineration: which should we choose?
- How much of global plastic waste is recycled?
- Can my recycling end up in landfill?
- Is it really helpful to separate recycling at home?
- Are all types of plastic equally easy to recycle?
- How many times can plastic be recycled?
- How long does it take plastics to break down?
- Can we use biodegradable plastic instead?
- Are plastic alternatives better for the environment?
- What are microplastics?
- What can I do if I want to stop plastic pollution of the oceans?
- Can we remove plastic already in the ocean?
- Is it true that some types of worm can break down plastic?
- Are there types of bacteria that can break down plastic?
How much plastic and waste do we produce?
In 1950 the world produced only 2 million tonnes per year. By 2019, annual production had increased nearly 230-fold, reaching 460 million tonnes. Over the period from 1950 to 2019, cumulative production reached 9.5 billion tonnes of plastic — more than one tonne of plastic for every person alive today.
In our entry we provide data visualisations and explainers on plastic waste by country, plastic waste per person, and importantly for plastic pollution (especially of the oceans), mismanaged waste by country and by region. Overall, it's generally the case that plastic waste per person is highest in high-income countries. However, richer countries tend to have effective waste management systems meaning mismanaged waste is low. Most mismanaged waste tends to arise from low-to-middle income countries where large coastal populations and rapid industrialization means waste management systems have failed to keep pace.

How much oil do we use to make plastic?
Estimates vary by source, but tend to converge on a range between 4 to 8 percent of global oil consumption. 6 percent of global oil consumption is taken as the mid-range estimate.1
Where does the plastic in the ocean come from?
This chart shows how global plastics emitted into the oceans breaks down by region.

Which sectors use the most plastic?
Packaging is the dominant sectoral use of plastics globally accounting for 42 percent (146 million tonnes) in 2016. This was followed by construction with 19 percent (65 million tonnes). You can view plastic use across main sector categories here.
Since packaging tends to have a much lower product lifetime than other products (such as construction or textiles), it is also dominant in terms of annual waste generation. It is responsible for almost half of global plastic waste — the breakdown by sector is shown in the chart here.
We cover this question more fully in our entry on Plastics, found here.

I've heard most of our ocean plastic debris comes from fishing activity — is this true?
In summary, best estimates suggest that approximately 80% of global ocean plastics come from land-based sources, and the remaining 20% from marine.2 Marine inputs here are dominated by fishing activity, including discarded nets, fishing lines, and abandoned vessels.
Whilst this is the relative contribution as an aggregate of global ocean plastics, the relative contribution of different sources will vary depending on geographical location and context. For example, our most recent estimates of the contribution of marine sources to the 'Great Pacific Garbage Patch' (GPGP) is that abandoned, lost or otherwise discarded fishing gear make up 75% of 86% of floating plastic mass (greater than 5 centimeters).3 This research suggests that most of this fishing activity originates from five countries – Japan, South Korea, China, the United States and Taiwan.
What are the environmental impacts of landfills?
One option of handling plastic waste is sending it to landfill. Here, it's important to distinguish between the quality/effectiveness of landfills.
The modern definition of a landfill is of a disposal site for materials through burial. This is typically the case in high-income countries today where landfills are well-managed and effectively regulated. However, across many countries today landfill resources can be poorly-managed; in many cases dumped in open landfills, pits or dumps. Such uncontrolled disposal facilities can make plastics vulnerable to pollution of the surrounding environment and at risk of entering the ocean.
Well-managed landfill facilities have expectations to gather, compact and safely store waste. In many cases this involves covering or burying with soils or other materials. However, such landfills still have negative environmental impacts:
Greenhouse gases: when organic matter decomposes to produce methane (CH4) and carbon dioxide (CO2) — both are greenhouse gases which contribute to climate change. In some landfill sites, methane gas can be captured and 'flared' (burned) for energy production. Plastic, which is hard to break down, degrades over very long timescales (particularly under low oxygen conditions) does not contribute to this effect.
Leachate: decomposing material can produce nutrient-rich or polluted waters which — if not properly contained — can leach to the surrounding environment and potentially enter waterways and soils. Well-managed landfills are usually surrounded by protective lining to prevent water leaching to the surrounding environment. However, local pollution can occur where this is not implemented effectively, or the lining breaks down and is not replaced.
Where plastics are not handled correctly, some types of plastic — such as polyvinyl chloride; PVC — can leach chemicals such as additives and plasticiser compounds.4 A report by the European Commission aimed to provide a detailed analysis and overview of the available evidence on the behaviour of PVC in landfills.5 The study concluded that whilst leachate of substances as either non-detectable or in very low concentrations, a precautionary approach would deem this material only controllable if landfills are equipped with adequate liner and leachate treatment.
What are the environmental impacts of incineration?
Incineration is the burning of a given material — in the case of plastic, this is done at very high temperatures. Incineration is one form of waste management. What are the environmental impacts of incineration?
Greenhouse gases: the incineration of plastic produces carbon dioxide (CO2) — a primary driver of global climate change. However, the incineration process can be integrated as a 'Waste to Energy' (WtE) solution. WtE is a form of energy recovery; in this case energy from the plastics can be stored and utilised for energy. On a net balance, does incineration therefore have a net positive or negative impact on greenhouse gas emissions?
It depends. The relative gains from energy recovery vary depending on the efficiency of the incineration process in addition to the mix of energy sources it's replacing. In countries where the energy mix is dominated by fossil fuels, incineration energy recovery can reduce emissions. However, across many countries — most across Europe — where incineration efficiency is low and the energy mix is lower-carbon, this does provide a net source of greenhouse gas emissions.6
Air pollution: a common concern of incineration is that it releases toxic emissions to the surrounding environment. The burning of plastics can produce several toxic gases: incomplete combustion of Polyethylene (PE), Polypropylene (PP) and Polystyrene (PS) can release carbon monoxide (CO) and noxious emissions, while polyvinyl chloride (PVC) can produce dioxins.7,8 Such gases can be toxic and dangerous to both human and ecosystem health. Open or uncontrolled burning of plastics should therefore be strongly avoided.
Is this also the case in incinerator facilities? It largely depends on the efficiency and environmental control of emissions of the particular incinerator site. In high-income countries in particular, waste management and incinerator sites are heavily regulated with monitoring of emissions and potential leaks to the surrounding environment. Modern incinerators have largely dealt with the problem of dioxin or other toxin emissions. Technologies here include efficient combustion, end-of-pipe treatment, selective catalytic reduction, and the addition of suitable inhibitors.9 A study in Belgium, for example, reported no difference in dioxin-serum levels of maintenance workers of municipal waste incinerator facilities — individuals who would experience high exposure rates if such methods were not implemented.10
However, such incinerator technologies and standards are not implemented everywhere — in countries where environmental regulation is less strict, unsafe or open burning of municipal waste remains common. This typically occurs in low-t0-middle income countries. Studies in India, Kenya and Thailand, for example, report notable pollution from the burning of waste (including the generation of dioxins).11,12,13 For incineration to become a universally safe solution, standards and uptake of appropriate technologies and approaches must be adopted globally.
Recycling, landfill or incineration: which should we choose?
There are three key options for handling plastic waste: recycling, incineration or disposal in landfill.14 What should we choose?
What seems like a simple question can sometimes be complex. Opinions differ depending on what particular environmental, health or economic issues someone cares about. Impact of different methods can be assessed across multiple factors including greenhouse gas emissions, energy use, local pollution, and cost of processing.
In the table we show the summary results of a meta-study on the comparison between recycling (R), incineration (I) and landfill (L) of plastics.15 This summarises the conclusions of a range of location-specific studies assessing the relative global warming potential (GWP) and total energy use (TEU) of the three methods. Each is shown from lowest impact to highest impact (e.g. R-L-I means recycling has the lowest impact, followed by landfill, then incineration has the highest).
Reference | Material/application | Global warming potential (GWP) Ranked best-mid-worst | Total energy use (TEU) Ranked best-mid-worst |
|---|---|---|---|
Arena et al. 2003 | PE and PET liquid containers | R-L-I | R-I-L |
Beigl and Salhofer 2004 | Plastic packaging | R-I | - |
Chilton et al. 2010 | PET | R-I | - |
Craighill and Powell 1996 | PET, HDPE and PVC | R-L | - |
Dodbiba et al. 2008 | Plastics (PE, PS and PVC) | R-I | - |
Eriksson and Finnveden 2009 | Non-recyclable plastic | I-L | - |
Eriksson et al. 2005 | PE PE, PP, PS, and PET | R-I-L R-I-L | R-I-L R-I-L |
Finnveden et al. 2005 | PVC PE, PP, PS, PET and PVC | R=I-L I-L-R | R-I-L I-R-L |
Foolmaun and Ramjeeawon 2013 | PET | R-L-I | R-I-L |
Grant et al. 2001 | PET, HDPE AND PVC | R-L | R-L |
Moberg et al. 2005 | PET | R-I-L | R-I-L |
Mølgaard 1995 | Plastics Plastics | - - | R-I-L I-L-R |
Perigini et al. 2004 | PE and PET liquid containers | R-L-I | R-I-L |
Perigini et al. 2005 | PE and PET liquid containers | R-L-I | R-I-L |
Rajendran et al. 2013 | Plastics | R-I | - |
US EPA 2006 | HDPE, LDPE and PET | R-L-I | R-I-L |
Wenisch et al. 2004 | Plastics | R=L | - |
Wollny et al. 2001 | Plastic packaging | R-L-I | R-I-L |
M. Al-Maaded et al. 2012 | Plastics, non-specified Plastics | R-L R-L-I | - R-I-L |
Shonfield 2008 | Plastics | I-L-R | - |
Recycling had the lowest global warming potential and energy use across nearly all of the studies. From an environmental perspective, recycling is usually the best option. This typically holds true, but note that there are a few caveats:
- this is based on the assumption that recycled material is a one-for-one displacement of primary plastic production, i.e. each tonne of recycled material prevents one tonne of primary material being produced. However, this is not always the case. Recycling processes can often lead to products of lower quality and economic value — often termed 'downcycling'. This means that we cannot take for granted that this substitution for primary production is one-to-one.16
- much of the plastic we recycle can only be recycled once or twice (as we answer, here). Then it will end up in landfill or incinerated. This means that whilst recycling is the best of the three management options, it's not a silver bullet. Recycling only delays — rather than prevents — disposal in landfill or incineration.
- whilst recycling has clear environmental benefits, it's not always the most economically-favourable choice. The relative profitability between recycling and the production of new plastic is strongly determined by oil prices. When oil prices are low, it can be cheaper to make raw plastics than to recycle. For example, when crude oil prices were low in 2015-16, the recycling industry struggled to compete with raw material production.
Nonetheless, recycling in general is the best of the three options.
But what about the plastic that is not recyclable — should we send it to landfill or incinerate? Here, the winner is less clear-cut. As we see across the range of studies above: it depends on context, plastic type and conditions as to whether landfill or incineration has lower impact in terms of greenhouse gas emissions or energy use.
As we describe in the sections above on landfill and incineration consequences, both have potential environmental risks if they're not managed or regulated correctly. The best choice may depend on local context. Incineration for example, can have a net positive on greenhouse gas emissions if burned efficiently and is utilised in a fossil fuel dominant energy mix. Across some countries — many across Europe — incineration efficiency is low and the energy mix is lower-carbon6, meaning landfill may be more favourable. Incineration may be favourable where fossil fuels are dominant, landfill space is limited or poorly managed, or subsurface conditions are unfavourable to landfills.
In either case it's critical that proper management and regulation is in place to minimise environmental impacts.
How much of global plastic is recycled?
We cover this question more fully in our entry on Plastics, found here. In summary, it's estimated that in 2015, around 55 percent of global plastic waste was discarded, 25 percent was incinerated, and 20 percent was recycled. Of the plastic waste produced between 1950 and 2015, only 9 percent was recycled.

Can my recycling end up in landfill?
Unfortunately, yes. Some plastics intended for recycling end up in landfill.
There are several reasons why this can occur:
- In most countries, some share of plastics intended for recycling are eventually rejected at local or regional waste handling facilities. The most common reason for rejected recycling is the 'contamination' of recycling streams — this can result from high concentrations of non-recyclable items in the waste stream, or contamination of other forms such as food waste. Even in cases where plastic contamination could be dealt within, it is sometimes more economically-feasible to divert some loads to landfill. Processing costs of poorly-sorted or contaminated plastic loads are more expensive, in some cases outweighing profits from recycled materials.The rate of 'rejected recycling' can vary significantly between countries depending on recycling policies, targets and the effectiveness of recycling separation methods (either at the household and local collection level, or at waste handling facilities). For a sense of scale, latest figures For England estimate that between 3 to 4 percent of total household recycling (which is plastics but also paper, metals etc.) was rejected and sent to landfill or incineration.17 In relative terms, this share is relatively low but could be improved through better understanding of how to avoid contamination of plastic recycling streams.
- As we describe in our full Plastics entry, recycled plastic is a globally traded commodity. The majority of major exporters are high-income countries. If we look at the top ten exporting countries over the period from 1988 to 2016, we see that collectively they account for 78 percent of global plastic exports (as shown in the chart). All of the top ten exporters are defined as high-income. Collectively, they have exported 168 million tonnes over this period, equivalent to an economic value of US$65 billion. China has been the world's largest plastic importer. Collectively, China and Hong Kong have imported 72.4 percent of all plastic waste (with most imports to Hong Kong eventually reaching China).18 In 2017, China introduced a ban on non-industrial plastic imports in part because of the levels of contaminated plastics in countries' export stream. Some of this imported plastic therefore ended up in landfill (and possibly at risk of entering the ocean).It's challenging to track the ultimate fate of traded plastics, however it's likely that at least some of recycled plastics exported from high-income countries enters landfill in the countries to which they are traded.
- Following China's ban on imported plastic in 2017, previous large exporters such as the United States, Canada, Australia and UK have failed to handle the increase in domestic plastic recycling demand. As such, some materials intended for recycling have subsequently been diverted to landfill.
- Plastics typically degrade in quality during the recycling process. For most recyclable plastics, they are typically only suitable for recycling once. As a result, most recycled plastic we use eventually reaches landfill, even if it goes through an additional use cycle as another product. Recycling typically delays rather than prevents plastic disposal to landfill or incineration.

Is it really helpful to separate recycling at home?
Approaches to recycling differ both between and within countries in terms of handling protocol at recycling centres, as well as guidance for disposal of waste at home. Some localities, for example, have a single mixed recycling disposal bin whilst others have separate bins for plastic, paper, and aluminium/cans. It's therefore difficult to provide universal guidance on the correct approach to separating waste. But there are some key points which apply in most cases.
Many believe that taking care of what they do or don't put into recycling at home is irrelevant — that landfill and recycling are mixed then separated later at waste management facilities. This is false. Landfill and recycling collections are not mixed. If you place recyclables in general waste bins (in localities with designated recycling bins) they will end up landfill.
It's important to be careful about what you place in recycling; non-recyclable plastics can lead to contamination of the supply. Although many facilities have automated and/or manual procedures for removing non-recyclables, they're not always 100 percent effective. If waste loads contain a significant amount of non-recyclables, facilities may deem them non-economic to sort. The same applies to food or liquid waste: unwashed plastics can contaminate the supply. These loads can be sent straight to landfill.
What about the separation of different recyclables (e.g. plastic, paper, and metal cans) — is it necessary to sort these at home? If your locality has only mixed recycling collection (called 'single-stream') then your job is easy. The exception here is glass and batteries — they should be recycled separately. The municipality will collect fully mixed loads and sort them at dedicated facilities using methods such as density separation, magnets and infrared technology. Infrared cameras can be used to determined specific plastic polymer types. You can read an overview of the recycling process by one UK locality here.
Some localities still use 'multi-stream' recycling where you have separate bins for each type of recyclable. But, with evidence that single-stream recycling increases recycling rates, many are turning away from multi-stream.19 If your locality relies on multi-stream recycling then its waste management processes are less likely to separate different types of recycling in waste streams. Ensuring your recycling goes in the correct bin is therefore important.
Are all types of plastic equally easy to recycle?
There are a wide range of polymers used in common plastics. Such materials have different properties and are therefore appropriate for different uses. The structure of the polymers also affect a plastic's recyclability. Some polymers fail and break down under mechanical or thermal stress; this affects their ability to be recycled.
In the table we summarise the key categories of plastics, their common uses, properties and whether they can be recycled or not. Most plastic items have a marked symbol numbered from 1 to 7 on them — this should provide some guidance on recyclability. Note that this information is based on general guidelines for household collection, however, these can vary depending on waste management infrastructure in specific locations. You should check local recycling guidelines for clarification. For example, it used to be the case that most recycling facilities were unable to handle plastic caps/tops from water or soft drink bottles. Some facilities now can, and encourage residents to recycle both together.
In general I try to remember a simple code of: 1 and 2 are recyclable; 3 and 5 sometimes recyclable; 4, 6 and 7 usually not recyclable. One good general source of information of what items are and aren't accepted is available here. You can also search for specific items, where guidance is provided on how to dispose of it properly.
You can view the relative amounts of plastic waste generation by polymer here.
How many times can plastic be recycled?
It's a common misconception that most plastics can be recycled many times over. This belief can allow us to justify high rates of single-use plastics on the basis that they are recyclable and therefore do not end up as waste in landfill.
In practice, the majority of recycled plastics are only recycled once or twice before being finally disposed of in landfill or incineration. In their 2017 Science paper on the fate of global plastics, Geyer et al. (2017) write that "Recycling delays, rather than avoids, final disposal. It reduces future plastic waste generation only if it displaces primary plastic production; however, because of its counterfactual nature, this displacement is extremely difficult to establish."20 The study estimates that of the plastic recycled to date, only 10 percent has been recycled more than once. Following this, they end up in the municipal waste stream.
The limits to repeated mechanical recycling occur because of thermal breakdown/destruction in processing (which can degrade the quality of material) and the mixing or contamination of plastic polymer types means secondary plastics can be of low economic or practical value. When plastics become products of lower quality following recycling, this is often termed 'downcycling'. A 2016 report by the World Economic Forum, the Ellen MacArthur Foundation, and McKinsey & Company, estimated that around 14 percent of plastic packaging globally is collected for recycling, however the costs of sorting and reprocessing mean that only 5 percent of material value is retained for use as further materials.1
In recent years there has been promising progress in the development of polymer materials which can be chemically recycled back to their initial raw materials for the production of virgin plastic production.21 In a recent study, Zhu et al. (2018) successfully synthesised a plastic with mechanical properties similar to commercially available plastics, but with infinite recyclability through chemical recycling. Such methods are currently expensive and unfavourable in terms of energy inputs, but could provide a commercially-viable solution in the years to follow.22
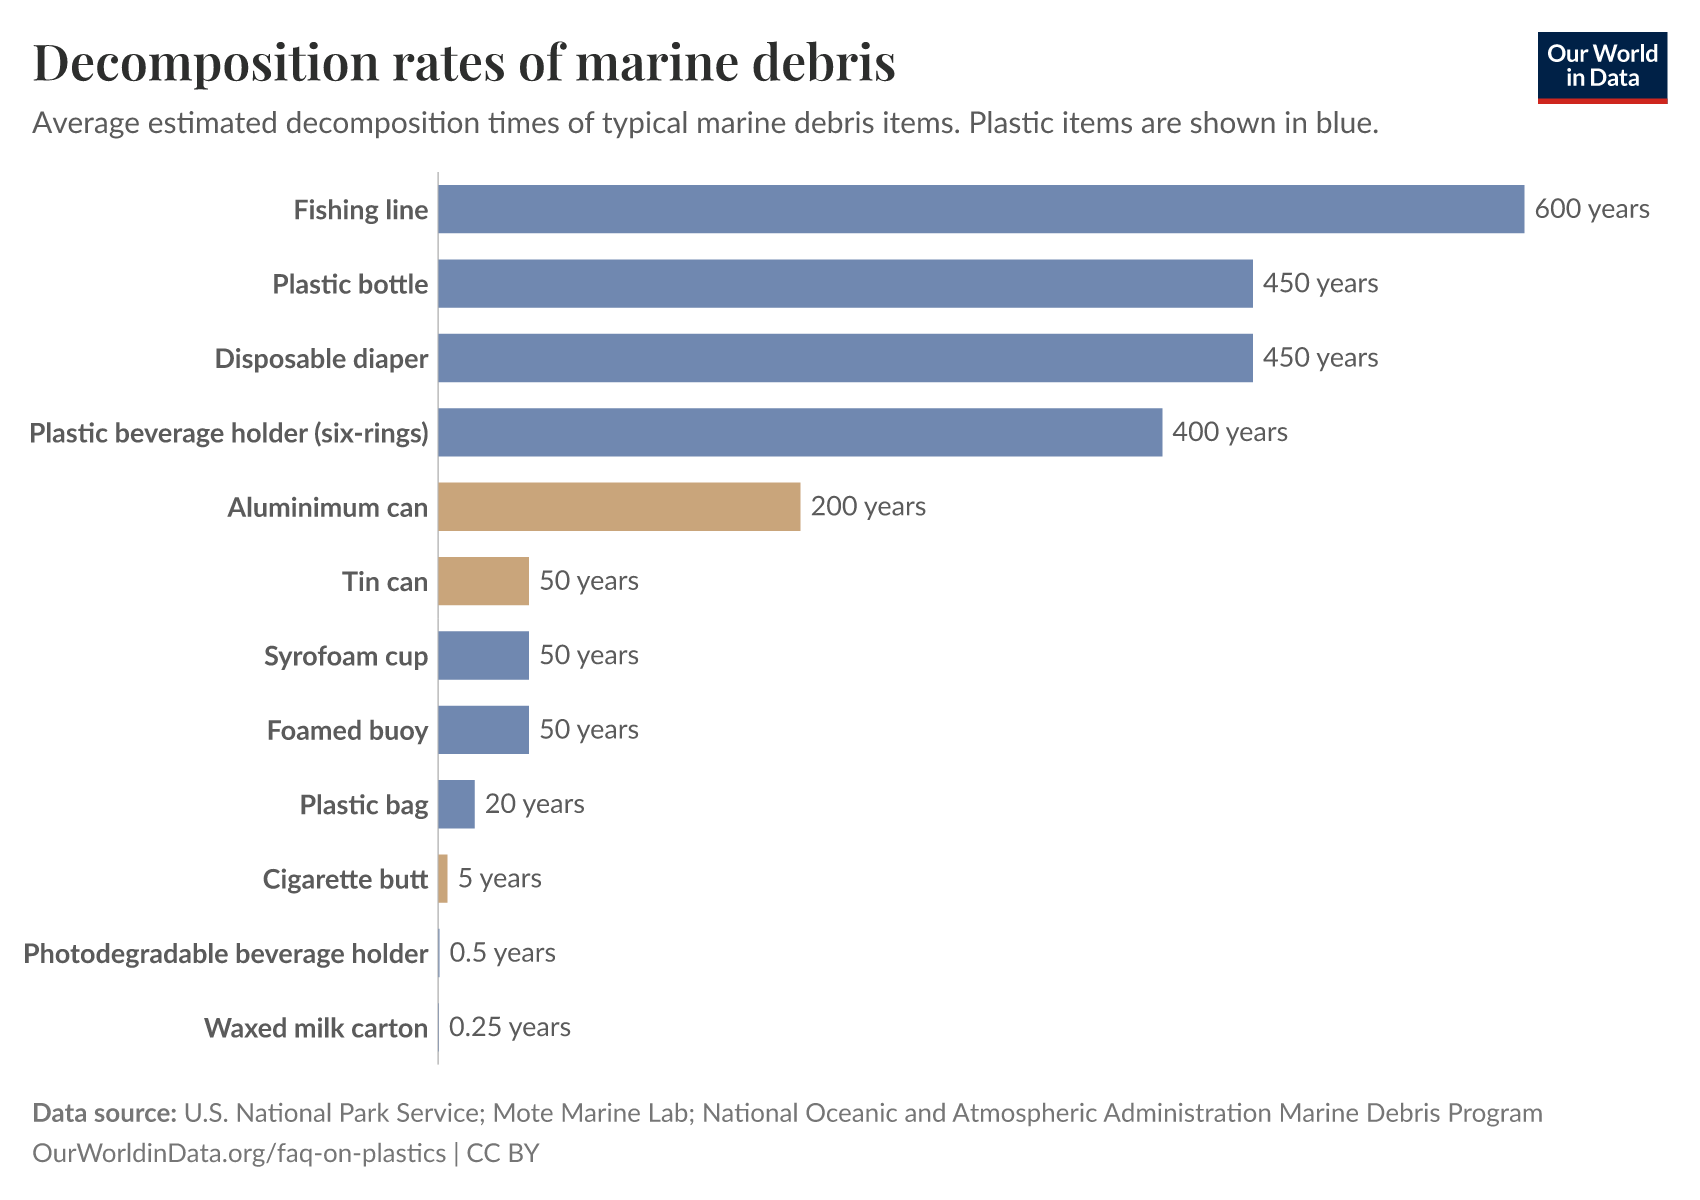
How long does it take plastics to break down?
Many plastics are defined as non-degradable, meaning they fail to decompose and are instead broken down into smaller and smaller particles. Materials can slowly break down through photodegradation (from UV radiation). Estimated decomposition times for plastics and other common marine debris items are shown in the chart here.
Fishing lines, for example, take an estimated 600 years to break down. Plastic bottles take an estimated 450 years.23
Can we use biodegradable plastic instead?
The production of so-called 'bioplastics' or biodegradable plastics is currently very low: estimated at around 4 million tonnes per year (which would be just over one percent of global plastics production).24,25
'Biodegradable' plastic is typically defined as plastics which break down at faster rates than standard plastics. However, this broad definition means the boundary of what constitutes biodegradable plastics is often intensely debated. Biodegradability can in some cases be claimed simply because break down is accelerated (without necessitating fast degradation).
One example of this is ‘oxo-degradable plastics’: plastics (such as polyethylene) with additives which accelerate the oxidation process (causing them to break down faster). In essence, however, all this does is break the plastics down into microplastics.
This has been the case with several so-called biodegradable plastics: they are proven to break down faster under specific environmental conditions (which may not actually reflect the normal environment), but may not be effectively degradable under natural conditions. The labels of 'biodegradable', 'bio-based', 'compostable', are therefore often claimed and used in marketing contexts, with little understanding for consumers on what these definitions mean in practice.
A key current challenge of biodegradable plastics is that they tend to need particular waste management methods which are not always widely available. They usually need to be separated from the traditional recycling stream (which can be difficult and expensive), and have to go to specific compostable facilities. This doesn’t mean such methods are unfeasible, but could be additional economic cost especially if they're in the waste stream at low concentrations, and would take significant work in terms of infrastructure redesign.
In 2015, the United Nations Environment Programme (UNEP) published a report on the misconceptions, concerns and impacts of biodegradable plastics.26 It concluded that: "the adoption of plastic products labelled as ‘biodegradable’ will not bring about a significant decrease either in the quantity of plastic entering the ocean or the risk of physical and chemical impacts on the marine environment, on the balance of current scientific evidence."
Are plastic alternatives better for the environment?
Plastics are undeniably a key environmental concern — particular in terms of impacts to ocean health and wildlife. But it's also important to acknowledge the value plastic plays across many aspects of society. It is a unique material: often lightweight, resilient, usually non-reactive, waterproof and cheap. For most of us, it has an almost constant place in our lives. Even those who try to minimise or cut plastic from their lives are likely to come into contact with it every day.
One example where plastic plays an important role is food packaging. Whilst over-packaging can undoubtedly be a significant issue, packaging of food products is essential for the prevention of food losses, wastage and contamination.27 Storage and packaging plays a crucial role from harvest all the way through to final consumption of the foods we eat. Even if some consider the final phase of packaging (from retail to home) to be unnecessary, it is likely it has played an important role in preserving food from the farm to the retail stage. It protects foods from pest and disease, significantly increases shelf life, and maintains food safety.28
Packaging is sometimes taken for granted in higher income countries. Across many low-to-middle income countries, lack of packaging is an important issue for food security. The UN Food and Agriculture Organization (FAO) emphasise that lack of packaging, storage and refrigeration leads to significant post-harvest losses.29 It notes: "large losses from farm to plate are attributed to poor handling, distribution, storage, and purchase/ consumption behavior. Huge resources that could otherwise be spent on more productive activities go into producing and transporting goods that only go to waste. Losses at almost every stage of the food chain may be reduced by using appropriate packaging."
In fact, studies have shown that when we compare environmental impacts such as greenhouse gas emissions, energy, water and resource use, plastic packaging tends to have a net positive impact. The impact of plastic production and handling is lower than the impacts which would result from food waste without packaging.30,31,32 Reducing packaging where it is used in excess is useful, however, abandoning packaging completely would have serious implications for food security, safety, and would ultimately lead to large increases in the environment impact of food.
The question is therefore: is plastic the best material to use for packaging? Which material is 'best' for the environment? As designer and sustainability innovator, Leyla Acaroglu, discusses in her TED Talk 'Paper beats plastic? How to rethink environmental folklore', there is no universal consensus on 'best' or 'worst' materials.33 Materials have different relative impacts across different environmental metrics. This ultimately leads to trade-offs. Some materials may release fewer greenhouse gas emissions but require more water or fertiliser inputs, for example.
There's no simple answer; your choice would be different depending on the environmental impacts you're most concerned about. In general, plastic tends to be cheap and has significantly lower greenhouse gas emissions, energy, water and fertilizer inputs than alternatives such as paper, aluminium, cotton or glass. The obvious environmental detriment is it's pollution of the natural environment when poorly managed. In the charts here we summarise one life-cycle analysis (LCA) study of environmental impacts by grocery bag type. This is based on results from the Danish Environmental Protection Agency.34 These figures present the number of times a grocery bag would have to be reused to have as low an environmental impact as a standard LDPE (Low-density polyethylene) single-use plastic bag. For example, a value of 5 indicates a bag would have to be reused 5 times to equal the environmental impact of a standard single-use plastic bag.
This is shown for greenhouse gas emissions only, and for combined environmental impact (including greenhouse gas emissions, ozone depletion, human toxicity (cancer effects), human toxicity (non-cancer effects), photochemical ozone formation, ionizing radiation, particulate matter, terrestrial acidification, terrestrial eutrophication, marine eutrophication, ecosystem toxicity, resource depletion (fossil), resource depletion (abiotic), and water resource depletion).


What are microplastics?
Microplastics tend to receive a lot of public and media attention. They are often discussed, or confused, as being a unique and different from conventional plastics.
By definition, microplastic is simply plastic of a very small particle size. When we discuss plastics we sometimes categorise them based on particle size; typical particle size ranges are shown in the table.35 Microplastics are plastic particles with a diameter typically less than 5 millimetres, or in some scales less than 4.75 millimetres. Even smaller particles, measuring less than 0.0001 millimetres (<0.1μm — micrometre) in diameter are often referred to as nanoplastics.
Microplastic can arise through primary or secondary processes. Primary microplastics are already of a small size in production: common sources include fibres, pellets, microbeads, and capsules. Secondary microplastics form from the breakdown of larger plastic products. For example, when meso- or macroplastic particles are exposed to the natural environment (for example in rivers, ocean waters, sunlight), physical or ultraviolet (UV) weathering can occur, which degrades them into smaller particles.
One challenge of microplastics is that their small size makes them easier to (consciously or not) ingest. Ingestion of microplastics could have detrimental impacts on wildlife health. The small size of these particles make them difficult to track and monitor; evidence on the impacts and behaviour of microplastics are therefore currently very limited.
Particle category | Diameter range (mm = millimetres) |
|---|---|
Nanoplastics | < 0.0001 mm (0.1μm) |
Small microplastics | 0.0001 – 1 mm |
Large microplastics | 1 – 4.75 mm |
Mesoplastics | 4.76 – 200 mm |
Macroplastics | >200 mm |
What can I do if I want to stop plastic pollution of the oceans?
If we want to reduce or stop the amount of plastic entering the oceans, what can we do?
There are multiple levels at which we can answer this question: there are things we can do as individuals, innovators, corporations, and in policy-making and financing.
Individuals:
- Cut out non-essential plastics where possible. As described in an earlier question, plastic can play a crucial role in many aspects: it is essential to preserving food quality, safety and shelf-life thereby preventing food wastage, for example. We must therefore be careful in cutting out plastics completely (this could lead to negative environmental consequences elsewhere). But if there are areas where you can reduce plastic usage which knock-on negative impacts, this is a good place to start.
- If you can replace single-use plastics with long-term, sustainable alternatives then substitute. To make this worthwhile across other environmental metrics (e.g. energy use, water use, greenhouse gas emissions), you often need to use them many times over a significant period of time. If you continually purchase alternatives to single-use plastic bags, for example, you’re probably increasing your environmental impact in other ways.
- In most cases, recycling plastic is better than incineration or landfill. Therefore recycle whenever possible. However, it’s important to note that recycling is not a holy grail to the plastic challenge. Most plastics are recycled only once or a few times before also ending up in landfill or incineration. The notion that recycled plastic has no impact (and can therefore be used indefinitely) is a misconception.
- Look at your local recycling guidelines to make sure you know what can and can’t be recycled in your area. Avoid putting plastics in recycling which cannot be handled properly. If in doubt, you’re better to put it in landfill than risk contaminating the whole recycling load (if recycling loads have significant levels of contamination they be judged to be non-economic to sort and therefore sent straight to landfill).
- In high-income countries (typically with good waste management systems), plastics at risk of entering the ocean arise from littering and dumping of waste by the public. It really shouldn't have to be said: don't litter or abandon your waste, and call out anyone who does. Through collective action, zero tolerance can become a societal norm.
- As individuals we can be limited in the magnitude of our impact. The above changes can make a contribution, but as the late David MacKay noted: “If we all do a little, we’ll only achieve a little”. As we quantified in our main Plastic Pollution entry, even if all countries across Europe and North America cut out plastic use completely, global mismanaged plastic would decline by less than five percent. To drive urgent and large-scale change, arguably our most important role lies in putting pressure on governments and policy-makers to collaborate globally (see below).
Governments and policy-makers:
- It has been a historic trend that some high-income countries have exported some of their recyclable plastics elsewhere. This has often been to mid- and low-income countries where poor waste management infrastructure has led to high levels of mismanaged waste (see the statistics and discussion on this in our Plastic Pollution entry). This exported waste is therefore at risk of entering the ocean. High-income countries should manage all of their waste appropriately and avoid such transfers to countries which higher risk of poor management.
- Some have proposed that if trade of recycled plastics was maintained, mid- or low-income countries should tax the plastics they accept.18 These taxes should be used to expand and improve waste management infrastructure.
- An estimated 20 percent of ocean plastic pollution results from the fishing industry. However, in particular regions — for example, the Great Pacific Garbage Patch — fishing activity is estimated to generate more than half of plastic pollution. Implementing and monitoring of strict regulations on the prevention of waste from fishing activity is important not only at national levels but through regional and global cooperation.
- The majority of plastic enters the ocean as a result of inadequate waste management; open landfills and dumps can’t effectively prevent plastics from being lost to the environment. Improving waste management infrastructure – particularly across industrializing countries – is critical and urgent if we are to prevent and reduce plastics entering the ocean. As a general sense of magnitude: if all countries had the management infrastructure of high-income countries (i.e. no mismanaged waste with the exception of littering), global plastics at risk of entering the ocean could decline by more than 80 percent.
Global cooperation to upscale waste management is therefore crucial. Such solutions are not new or innovative: they have already been implemented successfully across many countries. Note that this is not a case of finger-pointing or blame: rich countries too have benefited from the rapid industrialization (a rate at which waste management could not keep up) of others. This is a global system we have collective responsibility for.
Middle- and low-income countries where plastics are poorly managed have an obvious role and responsibility. But if high-income countries are truly serious about addressing the ocean plastic issue, the most impactful way to contribute is to invest in the improvement of waste management infrastructure practices across the world. Without such investment and cooperation we will not be able to reduce the quantity of plastic entering the ocean. We are still currently on a trend of rapidly increasing plastic waste: to stabilise, let alone reduce, will require large-impact solutions.
Innovation and industry:
Effective management of waste we produce is an essential and urgent demand if we are to prevent plastic entering the ocean. As noted above, this is a solution we know how to achieve: many countries have low levels of mismanaged waste. This is important, regardless of how successful we are in reducing plastic usage.
However, reducing demand for new plastic production is also crucially important. Whilst recycled plastic is usually favourable to primary plastics, it is not a long-term solution: most recycled plastics still end up in landfill or incineration after one or two cycles.20 For recycling to be sustainable over the long-term, innovations which would allow for continuous recycling would have to be developed. As noted in another question, there has been promising progress in recent years in the development of polymer materials which can be chemically recycled back to their initial raw materials.21 However, they are currently expensive and unfavourable in terms of energy inputs.22
The economic viability and environmental trade-offs will be critical components to the development of not only recyclable materials but other alternatives. Plastic is so widely used because it is cheap, versatile, and requires relatively little energy, water and land to produce. To achieve wide uptake of alternatives across countries of all income levels, breakthrough alternatives will have to be economically competitive with current methods. Functionality, price and scalability of innovations are key to addressing this challenge.
Can we remove plastic already in the ocean?
Plastic removal at large-scale is always going to be a major challenge. This becomes an even greater challenge over time, since plastics in the ocean tend to break down into smaller particles (and the smaller they are, they less easy it is to detect and then remove them at scale). Of course the easiest way to mitigate this problem is to stop plastic entering the ocean in the first place.
But still, we already have a large quantity of plastic in the ocean and this will continue (even if we can begin to reduce the amount that reaches the ocean in the years which follow).
Very small particles (microplastics, for example) are difficult to remove. Technologies being proposed currently for plastic removal therefore tend to focus on larger plastics. The fact that plastic tends to accumulate in gyres at the centre of ocean basins makes this easier: it concentrates plastics for removal.
The removal solution which has received the most attention from investors and researchers is The Ocean Cleanup. They are focusing on one major gyre of plastic: the Great Pacific Garbage Patch. Their technology in simple terms deploys buoyant tubes several kilometres in length. The project claim it can capture plastic ranging in size from tens of metres down to 1 cm.
It's too early to say whether this could be a feasible contribution. You can follow their milestone journey here. They make some bold claims, stating that full deployment of the technology could remove 50% of the plastic within 5 years. The prototype has been proven at various small-scales and in the summer of 2018 launch their first cleanup system in the Great Pacific Garbage Patch. If all goes well, their timeline suggests they aim to expand globally in 2020.
Is it true that some types of worm can break down plastic?
Yes, in 2017 researchers discovered that the wax worm (the larvae of the wax moth) has the ability to break down polyethylene (PE).36 PE accounts for around 40% of global plastics.
PE is largely non-degradable, but there have been a couple of previous instances where particular bacteria or fungi have been able to break it down at very, very slow rates. This latest discovery of the wax worm, however, showed faster rates of breakdown — although still slow. The researchers left 100 wax worms on a PE plastic bag for 12 hours and measured a 92 milligram breakdown of the plastic (about 3% of the plastic bag).
These rates are of course very slow, and at a tiny scale. The plan wouldn't be to scale-up the use of wax worms for plastic degradation — this would be unscalable. However, this discovery could be useful in allowing us to identify a particular enzyme which breaks down plastics. The authors suggest that wax worms break down the carbon-carbon bonds in PE either from the organism itself, or from the generation of a particular enzyme from its flora.
It could be possible to produce this enzyme or the bacteria which secrete this given enzyme at industrial scales.
Are there types of bacteria that can break down plastic?
Yes, there are particular strains of bacteria that are effective in breaking down plastic.
The most prominent discovery of this bacteria was made in Japan where researchers found a bacterium, Ideonella sakaiensis 201-F6, which could digest polyethylene terephthalate (PET) — the material used for single-use plastic bottles.37 This bacterium does so by producing and secreting an enzyme called PETase.
PETase (a protein which accelerates reactions) can split certain chemical bonds in PET; the bacteria can then absorb the smaller molecules it left behind (which contain carbon, and can be used by the bacteria as fuel/food).38
This breakthrough has been shown at very small laboratory scales. However, the authors and researchers in this field are open about the fact that this is not a near-term solution and would take major technological and scientific developments before it can close to the scale that would have an impact.
Endnotes
Neufeld, L., Stassen, F., Sheppard, R., & Gilman, T. (2016). The new plastics economy: rethinking the future of plastics. In World Economic Forum. Available at: http://www3.weforum.org/docs/WEF_The_New_Plastics_Economy.pdf.
Li, W. C., Tse, H. F., & Fok, L. (2016). Plastic waste in the marine environment: A review of sources, occurrence and effects. Science of the Total Environment, 566, 333-349. Available at: https://www.sciencedirect.com/science/article/pii/S0048969716310154.
Lebreton, L., Royer, SJ., Peytavin, A. et al. (2022). Industrialised fishing nations largely contribute to floating plastic pollution in the North Pacific subtropical gyre. Scientific Reports 12, 12666.
Previous studies (notably Lebreton et al. 2018) estimated that plastic lines, ropes, and fishing nets contributed just over half of the plastic mass in the 'Great Pacific Garbage Patch'. More recent studies estimate that this share is higher – giving the 75% to 86% referenced here.
Lebreton, L., Slat, B., Ferrari, F., Sainte-Rose, B., Aitken, J., Marthouse, R., … & Noble, K. (2018). Evidence that the Great Pacific Garbage Patch is rapidly accumulating plastic. Scientific Reports, 8(1), 4666. Available at: https://www.nature.com/articles/s41598-018-22939-w.
Asakura, H., Matsuto, T., & Tanaka, N. (2004). Behavior of endocrine-disrupting chemicals in leachate from MSW landfill sites in Japan. Waste Management, 24(6), 613-622. Available at: https://www.sciencedirect.com/science/article/pii/S0956053X04000261.
European Commission (2000). The Behaviour of PVC in Landfills. Available at: http://ec.europa.eu/environment/waste/studies/pvc/landfill.pdf.
Eriksson, O., & Finnveden, G. (2009). Plastic waste as a fuel-CO2-neutral or not?. Energy & Environmental Science, 2(9), 907-914. Available at: http://pubs.rsc.org/en/content/articlelanding/2009/ee/b908135f.
Verma, R., Vinoda, K. S., Papireddy, M., & Gowda, A. N. S. (2016). Toxic Pollutants from Plastic Waste-A Review. Procedia Environmental Sciences, 35, 701-708. Available at: https://www.sciencedirect.com/science/article/pii/S187802961630158X.
Barabad, M. L. M., Jung, W., Versoza, M. E., Lee, Y. I., Choi, K., & Park, D. (2018). Characteristics of Particulate Matter and Volatile Organic Compound Emissions from the Combustion of Waste Vinyl. International journal of environmental research and public health, 15(7).
Mukherjee, A., Debnath, B., & Ghosh, S. K. (2016). A review on technologies of removal of dioxins and furans from incinerator flue gas. Procedia Environmental Sciences, 35, 528-540. Available at: https://www.sciencedirect.com/science/article/pii/S1878029616301268.
De Meester, M., Kiss, P., & Braeckman, L. (2018). 317 Occupational dioxin exposure of workers in municipal waste incinerators. Available at: http://oem.bmj.com/content/75/Suppl_2/A401.3?utm_source=trendmd&utm_medium=cpc&utm_campaign=oem&utm_content=consumer&utm_term=0-A.
Nagpure, A. S., Ramaswami, A., & Russell, A. (2015). Characterizing the spatial and temporal patterns of open burning of municipal solid waste (MSW) in Indian cities. Environmental Science & Technology, 49(21), 12904-12912. Available at: https://pubs.acs.org/doi/abs/10.1021/acs.est.5b03243
Shih, Y. H., Kasaon, S. J. E., Tseng, C. H., Wang, H. C., Chen, L. L., & Chang, Y. M. (2016). Health risks and economic costs of exposure to PCDD/Fs from open burning: a case study in Nairobi, Kenya. Air Quality, Atmosphere & Health, 9(2), 201-211. Available at: https://link.springer.com/article/10.1007/s11869-015-0325-8
Phoungthong, K. (2017). Municipal solid waste management in Thailand. Current Science, 112(4), 674. Available at: https://www.researchgate.net/profile/Khamphe_Phoungthong/publication/315487357_Municipal_solid_waste_management_in_Thailand/links/58d603d8aca2727e5ebe296e/Municipal-solid-waste-management-in-Thailand.pdf
Of course, the most useful options of reducing consumption or reusing still apply. Here we are talking about the remaining plastic which ends up as waste.
Bernardo, C. A., Simões, C. L., & Pinto, L. M. C. (2016, October). Environmental and economic life cycle analysis of plastic waste management options. A review. In AIP Conference Proceedings (Vol. 1779, No. 1, p. 140001). AIP Publishing. Available at: https://aip.scitation.org/doi/pdf/10.1063/1.4965581.
Geyer, R., Kuczenski, B., Zink, T., & Henderson, A. (2016). Common misconceptions about recycling. Journal of Industrial Ecology, 20(5), 1010-1017. Available at: https://onlinelibrary.wiley.com/doi/full/10.1111/jiec.12355.
DEFRA (2017). Statistics on waste managed by local authorities in England in 2016/17. UK Department for Environment, Food and Rural Affairs. Available at: https://assets.publishing.service.gov.uk/government/uploads/system/uploads/attachment_data/file/664594/LACW_mgt_annual_Stats_Notice_Dec_2017.pdf.
Brooks, A. L., Wang, S., & Jambeck, J. R. (2018). The Chinese import ban and its impact on global plastic waste trade. Science Advances, 4(6), eaat0131. Available at: http://advances.sciencemag.org/content/4/6/eaat0131.
Lakhan, C. (2015). A comparison of single and multi-stream recycling systems in Ontario, Canada. Resources, 4(2), 384-397. Available at: http://www.mdpi.com/2079-9276/4/2/384/htm.
Geyer, R., Jambeck, J. R., & Law, K. L. (2017). Production, use, and fate of all plastics ever made. Science Advances, 3(7), e1700782. Available at: http://advances.sciencemag.org/content/3/7/e1700782.
Sardon, H., & Dove, A. P. (2018). Plastics recycling with a difference. Science, 360(6387), 380-381. Available at: http://science.sciencemag.org/content/360/6387/380.
Zhu, J. B., Watson, E. M., Tang, J., & Chen, E. Y. X. (2018). A synthetic polymer system with repeatable chemical recyclability. Science, 360(6387), 398-403. Available at: http://science.sciencemag.org/content/360/6387/398.
U.S. National Park Service; Mote Marine Lab, Sarasota, FL; National Oceanic and Atmospheric Administration Marine Debris Program. Available at: https://www.des.nh.gov/organization/divisions/water/wmb/coastal/trash/documents/marine_debris.pdf.
Geyer, R., Jambeck, J. R., & Law, K. L. (2017). Production, use, and fate of all plastics ever made. Science Advances, 3(7), e1700782. Available at: http://advances.sciencemag.org/content/3/7/e1700782.
European Bioplastics, Bioplastics—Facts and Figures (European Bioplastics, 2017). Available at: http://docs.european-bioplastics.org/publications/EUBP_Facts_and_figures.pdf.
UNEP (2015) Biodegradable Plastics and Marine Litter. Misconceptions, concerns and impacts on marine environments. United Nations Environment Programme (UNEP). Available at: https://europa.eu/capacity4dev/unep/document/biodegradable-plastics-and-marine-litter-misconceptions-concerns-and-impacts-marine-environ.
Marsh, K., & Bugusu, B. (2007). Food packaging—roles, materials, and environmental issues. Journal of Food Science, 72(3), R39-R55. Available at: https://onlinelibrary.wiley.com/doi/abs/10.1111/j.1750-3841.2007.00301.x.
Opara, U. L. (2013). A review on the role of packaging in securing food system: Adding value to food products and reducing losses and waste. African Journal of Agricultural Research, 8(22), 2621-2630. Available at: http://www.academicjournals.org/journal/AJAR/article-full-text-pdf/80C982E34864.
UN FAO (2011). Appropriate food packaging solutions for developing countries. Food and Agriculture Organization of the United Nations. Available at: http://www.fao.org/3/a-i3684e.pdf.
Licciardello, F. (2017). Packaging, blessing in disguise. Review on its diverse contribution to food sustainability. Trends in Food Science & Technology, 65, 32-39. Available at: https://www.sciencedirect.com/science/article/pii/S092422441730 1644.
Silvenius, F., Grönman, K., Katajajuuri, J. M., Soukka, R., Koivupuro, H. K., & Virtanen, Y. (2014). The role of household food waste in comparing environmental impacts of packaging alternatives. Packaging Technology and Science, 27(4), 277-292. Available at: https://onlinelibrary.wiley.com/doi/abs/10.1002/pts.2032.
Williams, H., & Wikström, F. (2011). Environmental impact of packaging and food losses in a life cycle perspective: a comparative analysis of five food items. Journal of Cleaner Production, 19(1), 43-48. Available at: https://www.sciencedirect.com/science/article/pii/S0959652610003239.
In her TED Talk, Leyla Acaroglu, shows that in the comparison of paper versus plastic bags, paper bags tend to have a higher environmental footprint in terms of greenhouse gas emissions. To function as a bag, substantially more paper is needed than plastic (i.e. a paper bag is at least 2.5 times heavier than a plastic bag).
Bisinella, V., Albizzati, P. F., Astrup, T. F., & Damgaard, A. (2018). Life Cycle Assessment of grocery carrier bags. Available at: https://www2.mst.dk/Udgiv/publications/2018/02/978-87-93614-73-4.pdf.
Eriksen, M., Lebreton, L. C., Carson, H. S., Thiel, M., Moore, C. J., Borerro, J. C., ... & Reisser, J. (2014). Plastic pollution in the world's oceans: more than 5 trillion plastic pieces weighing over 250,000 tons afloat at sea. PloS one, 9(12), e111913. Available at: http://journals.plos.org/plosone/article?id=10.1371/journal.pone.0111913.
Bombelli, P., Howe, C. J., & Bertocchini, F. (2017). Polyethylene bio-degradation by caterpillars of the wax moth Galleria mellonella. Current Biology, 27(8), R292-R293. Available at: https://www.sciencedirect.com/science/article/pii/S0960982217302312.
Yoshida, S., Hiraga, K., Takehana, T., Taniguchi, I., Yamaji, H., Maeda, Y., ... & Oda, K. (2016). A bacterium that degrades and assimilates poly (ethylene terephthalate). Science, 351(6278), 1196-1199. Available at: http://science.sciencemag.org/content/351/6278/1196.full.
Austin, H. P., Allen, M. D., Donohoe, B. S., Rorrer, N. A., Kearns, F. L., Silveira, R. L., ... & Mykhaylyk, V. (2018). Characterization and engineering of a plastic-degrading aromatic polyesterase. Proceedings of the National Academy of Sciences, 115(19), E4350-E4357. Available at: http://www.pnas.org/content/early/2018/04/16/1718804115.
Cite this work
Our articles and data visualizations rely on work from many different people and organizations. When citing this article, please also cite the underlying data sources. This article can be cited as:
Hannah Ritchie (2018) - “FAQs on plastics” Published online at OurWorldinData.org. Retrieved from: 'https://archive.ourworldindata.org/20260518-093348/faq-on-plastics.html' [Online Resource] (archived on May 18, 2026).BibTeX citation
@article{owid-faq-on-plastics,
    author = {Hannah Ritchie},
    title = {FAQs on plastics},
    journal = {Our World in Data},
    year = {2018},
    note = {https://archive.ourworldindata.org/20260518-093348/faq-on-plastics.html}
}
Reuse this work freely
All visualizations, data, and articles produced by Our World in Data are completely open access under the Creative Commons BY license. You have the permission to use, distribute, and reproduce these in any medium, provided the source and authors are credited.
The data produced by third parties and made available by Our World in Data is subject to the license terms from the original third-party authors. We will always indicate the original source of the data in our documentation, so you should always check the license of any such third-party data before use and redistribution.
All of our charts can be embedded in any site.